Additional Blogs by SAP
cancel
Showing results for 
Search instead for 
Did you mean: 
boris_gebhardt
Explorer
0 Kudos
Release NetWeaver 2004s

Those of you, who frequently check out SDN news or even had been at TechEd05 in Boston or Vienna know that the New ABAP Editor and the New ABAP Debugger won the live demo jam sessions at both events.
While there is already lots of information available about the New ABAP Editor in SDN, it is hard to get details about the New ABAP Debugger.
Therefore it’s time for a short note, which will prove that not only ABAP development with the New ABAP Editor but even bug hunting with the New ABAP Debugger can be the fun part of your live.

The New ABAP Debugger is in contrast to the good old Classic ABAP Debugger a two process debugger. This means the debuggee (the application that is being debugged) runs in one window, while the debugger occupies it's own second window.
Without going into all the architectural details of this decoupling, it should be pointed out that this makes it now possible to provide a state-of-the art debugger UI and finally supply all the debugging features you've ever dreamed of.

Some basics about the UI of the New ABAP Debugger

In the New ABAP Debugger you have several debugger desktops, which can be customized to your needs. On each desktop you can arrange from only 1 up to 4 arbitrary debugger tools.

For example you may display the source code in full screen mode ( see screenshot 1 below ), display two internal tables in parallel ( see screenshot 3 below ) or visualize the source code, a complex data object and the inheritance of an object at the same time ( see screenshot 4 below), or whatever you prefer.

Customizing the UI is as easy as a mouse click and of course you can save your UI settings for later use.

Adopting the UI and, in contrast to the Classic ABAP Debugger, using the full size of your screen for debugging information is already quite nice but here are some selected features which will boost your trouble shooting efficiency:

  • Use the integrated New ABAP Editor to have syntax coloring and to display variable values just by pointing at a variable ( see screenshot 1 below ).
  • Display all local variables and parameters of e.g. a method ( see screenshot 2 below )
  • Store the parameters of a function module in the test environment of function builder, to run a single test with this test data later on
  • Display all global variables (globals) of the current program or even all globals of all loaded programs ( see screenshot 5 below)
  • Use watchpoints on internal tables to find out where the table is changed
  • Use the diff tool to compare e.g. 2 internal tables with 10000 lines within 1 second ( see screenshot 6 below )


Screenshot 1: Full-screen source code view: New ABAP Editor with variable quick info window


Screenshot 2: Local varables including procedure signature
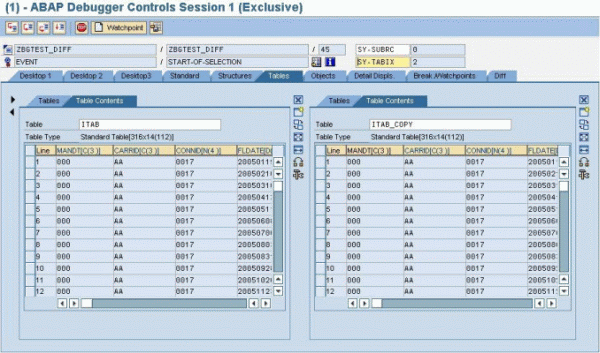


Screenshot 3: Compare two internal tables using two table views in parallel


Screenshot 4: Three tools on one destop: The source code display, the object view with the inheritance hierarchy and the data explorer


Screenshot 5: List of all loaded programs: By clicking on the program name you get detailed info about all global variables


Screenshot 6: Integrated Diff tool, showing the differences between two internal tables (ITAB[5]-PRICE <> ITAB_COPY[5]-PRICE)

16 Comments
Peter_Inotai
Active Contributor
0 Kudos
Hi Boris,

Thanks for this weblog.
The version in 7.00 is quite impressive.

>While there is already lots of information available about the New ABAP Editor in SDN, it is hard to get details about the New ABAP Debugger.
Actually there is quite a lot of info about the New Debugger in SDN for the 6.40 version, but not for the 7.00 version.

For me it's not clear what are the new changes between version 6.40 and 7.00 except the integrated AB4 editor. Can you highlight these changes?

Thanks,
Peter
boris_gebhardt
Explorer
0 Kudos
Hi Peter,

Thanks for your feedback.

In 6.40 (NetWeaver04) we delivered the first version of the New ABAP Debugger, including the flexible UI with all the desktops and the standard debugger features and tools like editor, stack, variable fast display, detail views for object, table etc.
But unfortunately some techniques/features like watchpoints and HTTP-debugging, update debugging, attach to a running process are not available in the 6.40 version.

With 7.00 (NetWeaver04s) you get:
- Watchpoints (even for internal tables)
- RFC, HTTP debugging, attach to a running process
- Breakpoints in screen logic of screens
- more sophisticated tools:
  - diff tool
  - locals, global variables
  - loaded programs (+ all global variables)
  - data explorer
  - combined ABAP/screen stack
  - integrated memory inspector
  - download parameters of a function module to
     se37 test environment
  - Integrated AB4 Editor
  - ...
- debugger sessions
   (save current breakpoints, debugger settings 
   for later use ...)
- ...

The architecture of the New ABAP Debugger now allows us to add new tools and features very easily.

Thanks
Boris
Peter_Inotai
Active Contributor
0 Kudos
Hi Boris,

Thanks a lot for this detailed list.

Regards,
Peter
Peter_Inotai
Active Contributor
0 Kudos
Hi Boris,

Just one more question.

>The architecture of the New ABAP Debugger now allows us to add new tools and features very easily.
Is it possible to add customer tools/features to the New Debugger like in the case of Code Inspector to add customer checks?

Thanks,
Peter
boris_gebhardt
Explorer
0 Kudos
Hi Peter,

The architecture would allow adding new tools (plug and play) on customer side.
But at the moment we allow this only within SAP (the tools are registered - hard coded - in the debugger) - but we think about a more general "enhancement" concept.

Additionally with the next release we provide the so called debugger scripting (automated debugging) which allows you to use a local ABAP class as a debugger script which runs in the debugger and can control the debugger.(using all debugger features)
Using this technology you can add more or less all features you can think of.

Regards
Boris
Peter_Inotai
Active Contributor
0 Kudos
Hi Boris,

Thanks for your answer.
It really sounds interesting.

There was a really good SAPTutor about the New Debugger in 6.40. It would be great to see something similar for the version 7.00.

It would be also great, if you could publish some more weblogs about the new debugger in 7.00 with details.

Thanks,
Peter
Former Member
0 Kudos
Hi ,

Thanks for the excellent and useful weblog.
Keep blogging.

Regards
Elini.P
Peter_Inotai
Active Contributor
0 Kudos
Thanks for the presentation in the ABAP corner, it's  really great.

Peter
Former Member
0 Kudos
Hi
This is very interesting topic from developer
point of sight. I like to know more detail
especially on what is the minimum requirement
to install, whether this version available already?
Could you please refer me the URL where I can
download or check the updates about this?
Appreciate your help.

Rgds,
Gun
boris_gebhardt
Explorer
0 Kudos
Hi Gun,

Thanks for your feedback.

The described features of the New ABAP Debugger are available with Netwaver04s which wil be shipped with ERP 2005. ( available in Q4 2005)
http://www.sap.com/services/pdf/BWP_WP_Release_Strategy.pdf

Best Regards
Boris
abdul_hakim
Active Contributor
0 Kudos
Hi,This is editor really looking good..
LeonardoAraujo
Active Contributor
0 Kudos
Very nice job.

I am looking forward to have my hands on a WebAS 7.0 !!!
Any word on a sneak peak preview 7.0 Abap?

Thx
0 Kudos
Very nice.
Peter_Inotai
Active Contributor
0 Kudos
Hi Boris,

Is there a way to display the SCREEN table in the new ABAP debugger?
I was playing around in 6.40 and 7.00, but I couldn't find the way. I could display only the SCREEN header line.

Thanks in addvance,
Peter
boris_gebhardt
Explorer
0 Kudos
Hi Peter,

Sorry for the late response - I attended Teched in Las Vegas.

In Release 700 (NetWeaver04s) you can use the (quite technical) debugger tool "System Areas"(Folder: special tools).
Use the area "screen" - here you will see the field attributes of all elements of the current screen.

With the next release we will provide a sophistated dynpro tool which allows to display the whole screen stack with all attributes.

Regards
Boris
Peter_Inotai
Active Contributor
0 Kudos
Hi Boris,

Thanks for the info, I'll check it.

Best regards,
Peter