1. Objective
The objective of this blog is to explain step-by-step process to trace AMDP method to analyze the performance and pin-point any performance bottlenecks.
2. Requirement
Requirement is to analyze performance of any AMDP method which gives us a fair idea about its execution times across it’s modularization units such as subsequent AMDP method calls within any AMDP method. The developer would like to leverage AMDP statement trace utility to address this requirement.
3. Understanding limitation in regular performance traces
3.1 Transaction SAT
SAT transaction gives us performance snapshot across processing blocks in given transaction or report program. This transaction provides the execution time of any given method, any given subroutine or any function module etc. along with its percentage with respect to total. With new code push down techniques now more and more code is being pushed to database layer, we are seeing increase in AMDP methods. However, SAT transaction gives us idea that AMDP method is taking how much time, but it is displayed as single row in SAT analysis snapshot mentioning as database procedure (DB: Exec).
The limitation arises when AMDP method is not so much straight forward. What if AMDP method itself has thousands of lines of code with multiple AMDP methods call with in an AMDP method. See below screenshot.

One can see here one AMDP method CL_FR_DAYS_CALCULATION=CALC_FR_DAYS_PLAN takes majority time approx. 28% of total (5.2 secs) in it’s processing. When we see this AMDP method, we find that it has around 1500 lines of code with multiple AMDP method calls from with in. So it becomes difficult to pin point the bottleneck in performance by seeing SAT results.
3.2 Transaction ST05
Transaction ST05 is also powerful tool to analyze performance. It provides various traces such as SQL Trace, Buffer Trace, RFC Trace etc to trace and analyze the results. In case of AMDP methods, SQL trace provides results similar to SAT Transaction. It provides one line of result that this database procedure is taking how much of the time. But what is causing that much time is not clear by looking at the result. See below screenshot.

One can see here ST05 trace also provides high level view on AMDP method performance. It tells us that around 5.3 sec is execution time of our AMDP method, but it does not provide any further information on what caused this execution time.
4. Steps to trace AMDP method
The following steps explain step by step process for AMDP method trace:
4.1 Run Transaction AMDP_UTILS
This transaction provides list of AMDP utilities present in our system.

4.2 RS_AMDP_STMT_TRACE Report
Double click on the line having RS_AMDP_STMT_TRACE report name and following screen appears.

Here we see self-explanatory buttons similar to transaction ST05 where one can switch on and switch off AMDP statement trace.
Click on button ‘Activate Trace’ and then run your transaction.
Once your transaction is complete, click on button ‘Deactivate trace’ and then button ‘Display Trace Entries’ to display the trace result.
5. Understanding AMDP trace with an example
In our current example, we have seen that the method CL_FR_DAYS_CALCULATION=>CALC_FR_DAYS_PLAN takes 5.2 secs. Let’s trace it with AMDP_UTILS transaction and try to identify its performance bottlenecks.
Step 5.1: Activate the AMDP trace for current user
Run transaction AMDP_UTILS and then choose statement RS_AMDP_STMT_TRACE.

Click on button ‘Activate Trace’.
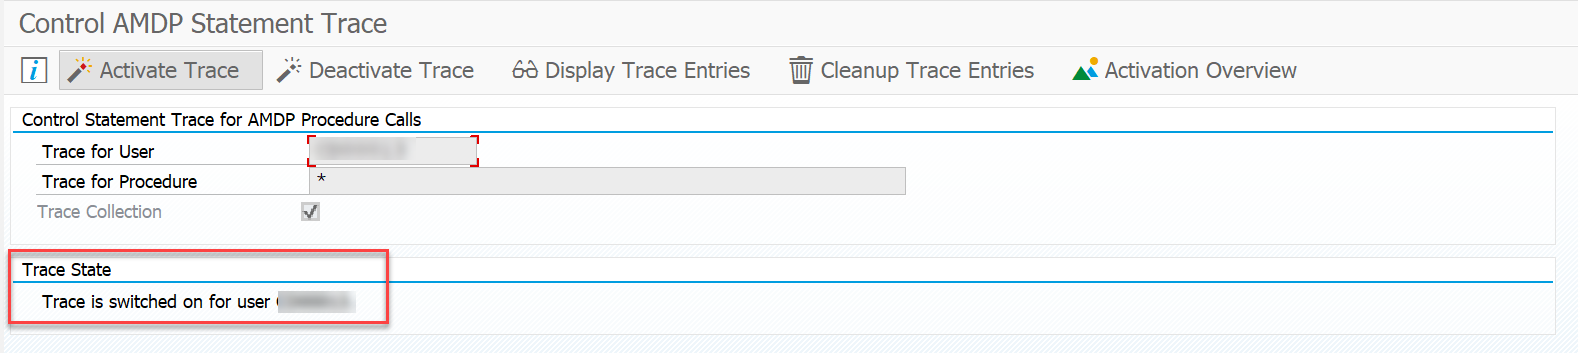
Confirmation message is displayed that trace is switched on for current user.
Step 5.2:
Now run your transaction and once your transaction is finished click on ‘Deactivate Trace’ button.

Step 5.3:
Now click on ‘Display Trace Entries’ button.

Following screen appears.
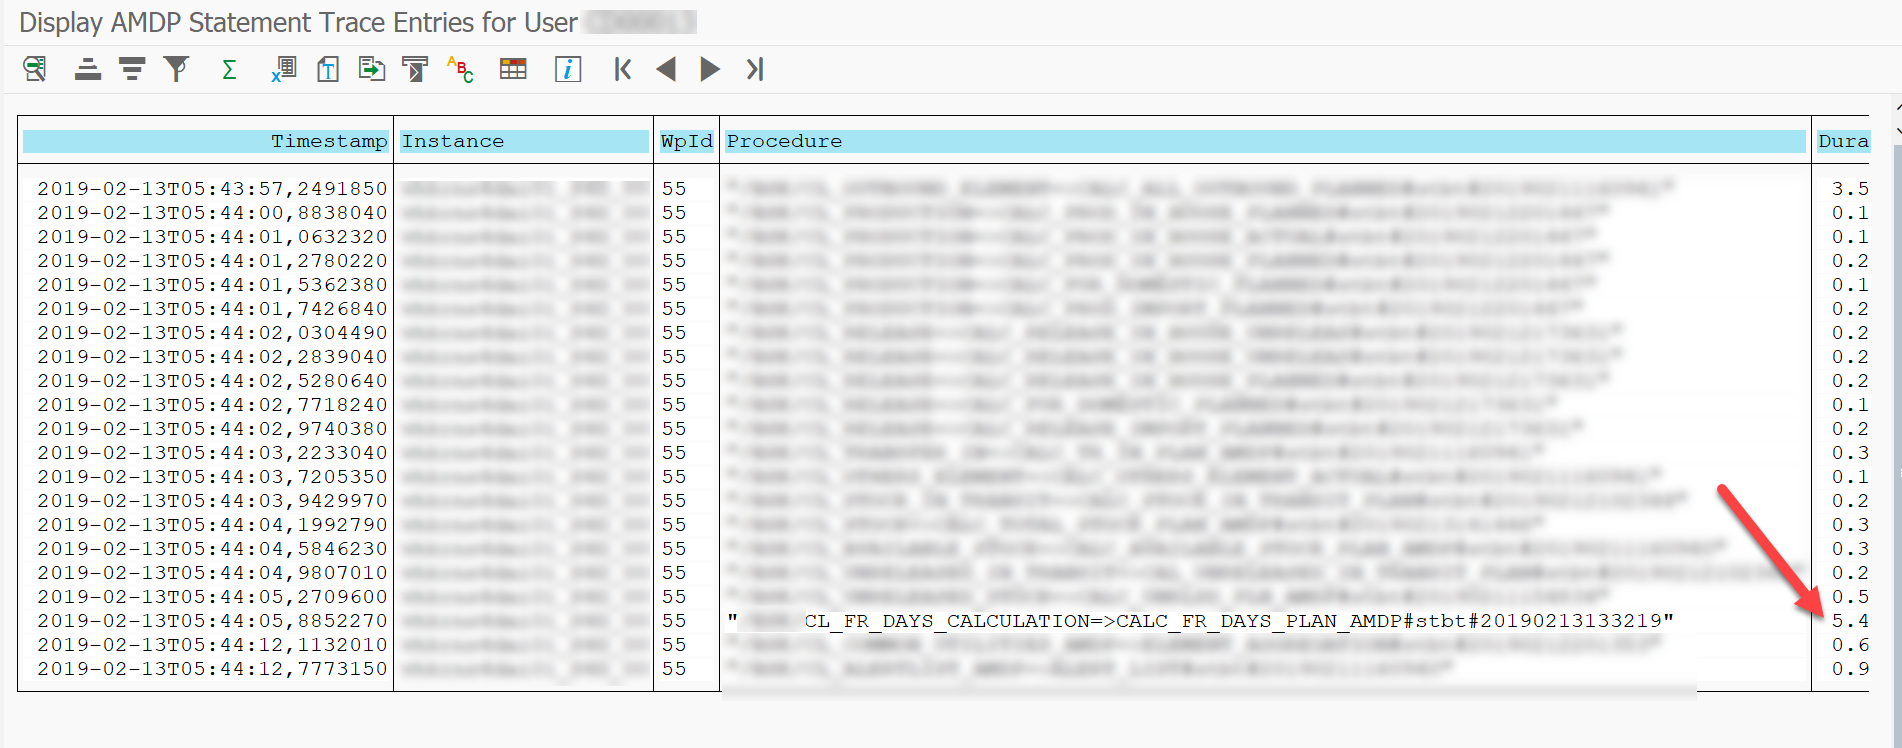
It list down all the AMDP method calls within your transaction and also displays execution time against each AMDP method. Once can see here our AMDP method CL_FR_DAYS_CALCULATION=>CALC_FR_DAYS_PLAN_AMDP takes 5.4 secs
Scroll to the right

We see a column ‘Display’. We can click on this button against any particular AMDP and it will display details about each processing block with in AMDP method.

Step 5.4:
Click display button in front of AMDP method CL_FR_DAYS_CALCULATION=>CALC_FR_DAYS_PLAN_AMDP
Following screen appears.

We can see from here that out of 5.4 secs, 3.35 secs were spent while executing one underlying AMDP CL_FR_DAYS_CALCULATION=>CALC_OUTB_QTY_EXTEN. Rest other AMDP’s are executing at fairly normal level.
Step 5.5:
As we now know the performance pain point, we can focus our analysis in this AMDP only. After analyzing this AMDP CL_FR_DAYS_CALCULATION=>CALC_OUTB_QTY_EXTEN, it was found that we have put SELECT DISTINCT unnecessarily in one of it’s select query. This SELECT DISTINCT was causing underlying select query to run slow.
Once we removed this SELECT DISTINCT, the performance is greatly improved. We can see the stats after this change.
AMDP Trace after the code change:

SAT Trace after the code change:

Once can see the improvement in the performance.
Earlier same AMDP method was taking approx. 5.4 secs (28% of total), now after code changes, it takes only 0.3 secs to execute less than 2% of total execution time.
