
- SAP Community
- Products and Technology
- Technology
- Technology Blogs by Members
- Build a Custom Widget in SAP Analytics Cloud, Anal...
Technology Blogs by Members
Explore a vibrant mix of technical expertise, industry insights, and tech buzz in member blogs covering SAP products, technology, and events. Get in the mix!
Turn on suggestions
Auto-suggest helps you quickly narrow down your search results by suggesting possible matches as you type.
Showing results for
ferrygun18
Contributor
Options
- Subscribe to RSS Feed
- Mark as New
- Mark as Read
- Bookmark
- Subscribe
- Printer Friendly Page
- Report Inappropriate Content
12-06-2019
3:32 AM
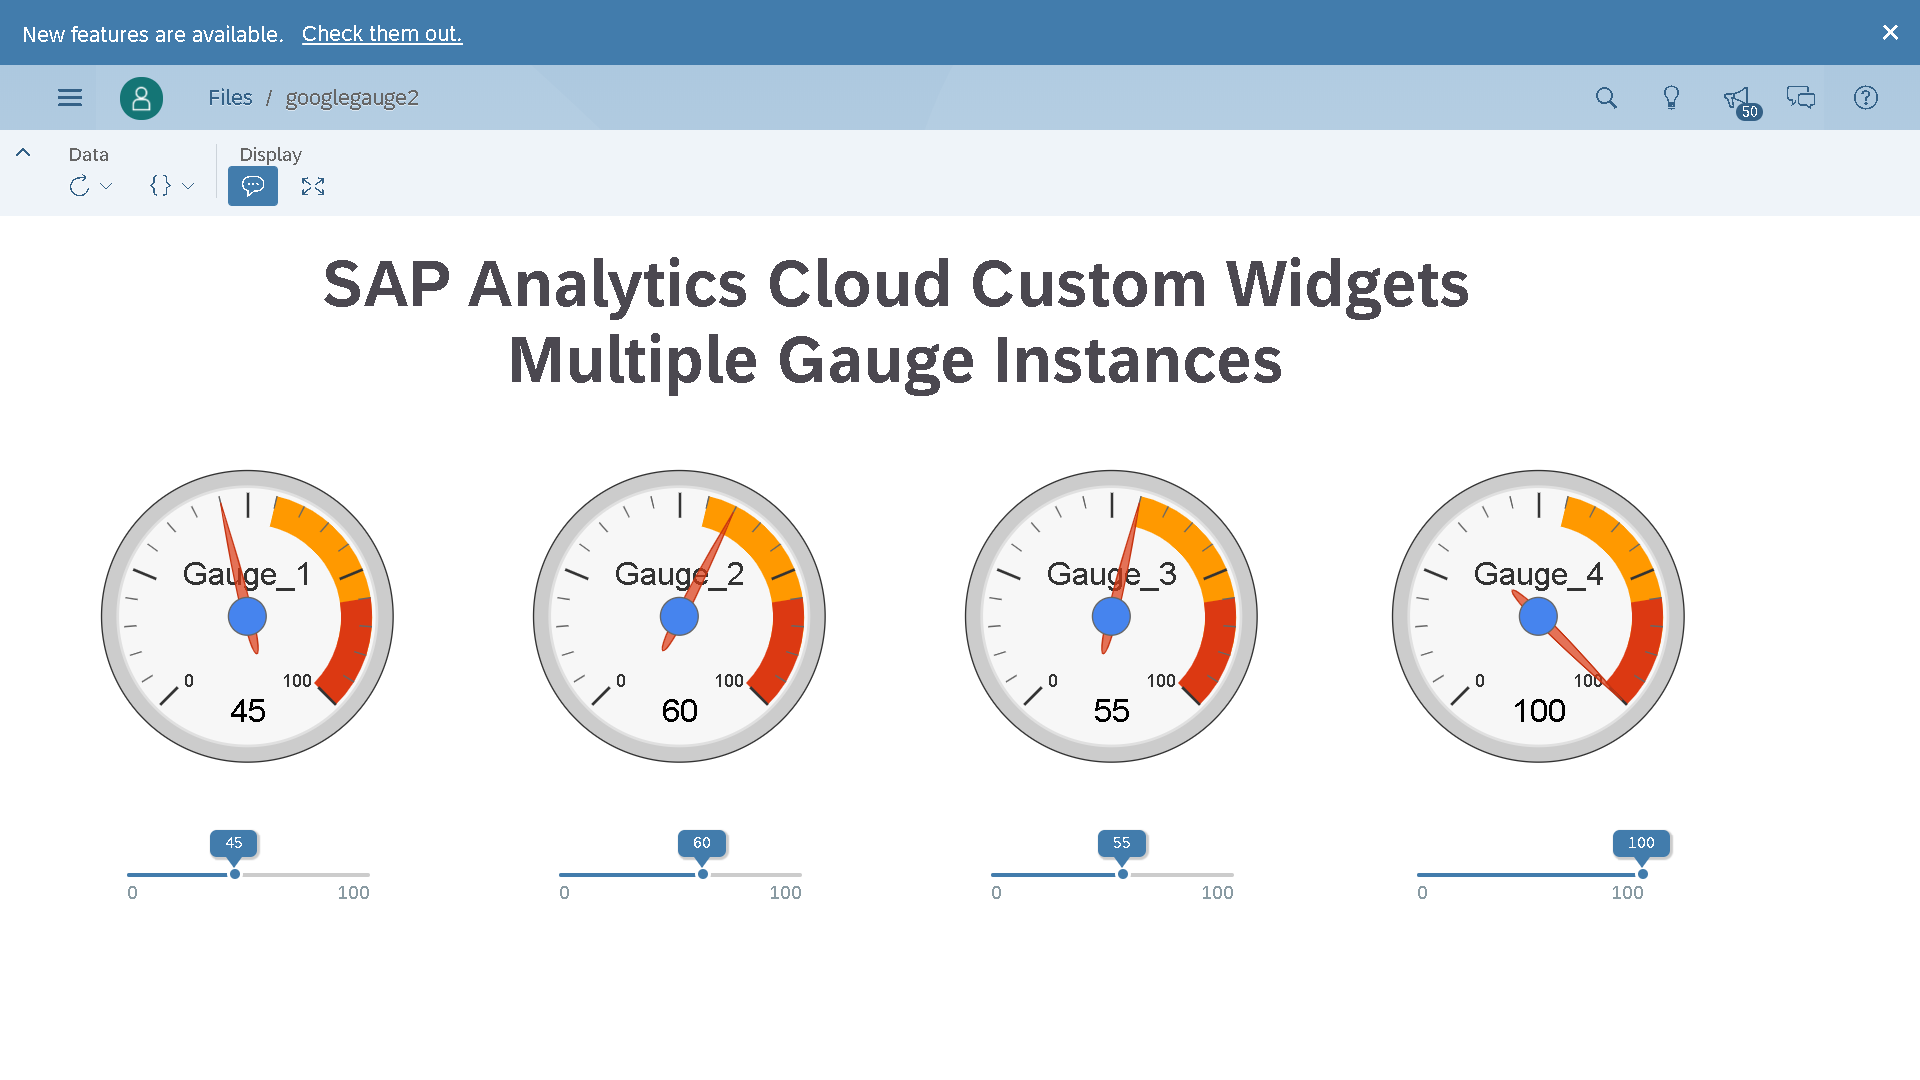
In this tutorial, we will build a simple custom widget in SAP Analytics Cloud, Analytics Application to show the gauge chart as shown below.


A custom widgets are implemented as Web Components. The Web Components are made of HTML, CSS and JavaScript.
Custom widget consists of the following files:
You need a web server that hosts the resources of the custom widget files (JavaScript files, CSS files, images, and so on). Assume that your web server address is :
The Gauge Box custom widget consist of three Web Components: the actual Gauge Box, the Styling Panel and the Builder Panel of the Gauge Box and it consist the following files:
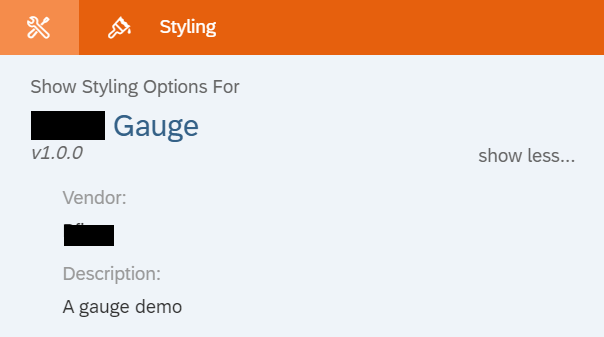
The Gauge Box custom widget has the unique ID, version, and the name, which is displayed in the analytics designer, Styling Panel.

The Gauge Box custom widget is composed of the following three Web Components:

The first Web Component is the actual Gauge Box as indicated by the kind of "main". The second Web Component is the Styling Panel of the Gauge Box as indicated by the kind of "styling". The third Web Component is the Builder Panel of the Gauge Box as indicated by the kind of "builder".
Moving on, these are the properties of the Gauge Box custom widget: value, info, color, width and height.

The property value represents the value in percentage of the Gauge Box. The property info represents the title of the Gauge Box. The property color represents the color of the Gauge Box. And the properties width and height represent the initial width and height of the custom widget.
And then the script methods of the Gauge Box are defined:

The function setValue takes three parameters, newValue, newInfo and newColor. The body property contains the script code which sets the passed all the parameters to the respective Gauge Box's properties.
Function getValue takes no parameter and returns the percentage value of the Gauge Box.
Finally, an onClick event is defined:

Note that the event has no parameters.
This section shows the Web Component JavaScript of the Gauge Box (box.js).
2.1 Template Object
The following code creates a template HTML element:

The template element represents the gauge chart.

2.2 JavaSript API of the Custom Element
The Styling Panel lets you change the background color of the Gauge chart in analytics designer.

This following code shows the Web Component JavaScript of the Styling Panel (box_sps.js).
The Web Component JavaScript defines a new custom element com-demo-box-sps. The JavaScript API of the new custom element is implemented in the BoxSps class which extends the JavaScript API of the HTMLElement class.

3.1 Template Object
The following code creates a template HTML element:

This template HTML element is a template for the shadow DOM HTML element that represents the HTML DOM of the Styling Panel of the Gauge Box.
3.2 JavaSript API of the Custom Element

This Builder Panel lets you change the text color of the Gauge Box in analytics designer.

The code is very similar to the Web Components JavaScript of the Styling Panel. The following code shows the Web Component JavaScript of the Builder Panel (box_bps.js).
The Web Component JavaScript defines a new custom element com-demo-box-bps. The JavaScript API of the new custom element is implemented in the BoxSps class which extends the JavaScript API of the HTMLElement class.

4.1 Template Object
The following code creates a template HTML element:

This template HTML element is a template for the shadow DOM HTML element that represents the HTML DOM of the Builder Panel of the Gauge Box.
4.2 JavaSript API of the Custom Element

Once we have created all the required files, we need to organize in the following structure:
Once you have added the Gauge custom widget, you can see the following functions.

The below code illustrates who to define the parameters for the setValue function. And how to call the getValue function.
See it in action:
Here is another demo of Google Gauge widget:
Chill the Lion:
Integration between amCharts and SAC:
Another integration with amChart and SAC:
Highcharts 3D Cylinder:
Google Map widget:
YouTube Player widget:
Multiple Instances of Google Gauges widget:
Another version of Google Map widget:
Singapore map widget:
Clock widget:
Geo Chart widget:
Rotate Globe widget:
Another Rotate Globe widget:
Liquid Fill Gauge widget:
QR code generator widget:
Word Cloud widget:
Solid Gauge widget:
Amchart Gauge widget:
Heat map widget:
Compass widget:
Text widget:
Linear Gauge widget:
Three.js custom widget:
3D object widget (with mouse controls):
3D scatter widget:
Bubble chart widget:
Barcode generator widget:
Pie Chart widget:
Day & Night World Map widget:
amCharts Serpentine timeline:
Column with Rotated Series from amCharts:
Stadium track chart from amCharts:
Radar Timeline chart from amCharts:
Dragging Pie Slices from amCharts:
Pictorial Chart from amCharts:
Radial Bar Chart with Highcharts:
Surface Chart with Anychart:
Seat Map Chart with Anychart:
Connector Map with Anychart:
Gauge with FusionCharts:
Cylinder Fill Chart with FusionCharts:
Gantt Chart with FusionCharts:
Map chart with FusionCharts:
Gauges with FusionCharts:
Google Poly:
Org chart with FusionCharts:
Radar (Spider) custom widget with FusionCharts:
A quick demo video to control the SAP Analytics Cloud Custom Widget with web Bluetooth and micro:bit. User presses the button A and B on micro:bit to fill in and out the cylinder gauge.
Control two Google Gauges widgets with two micro:bits and Web Bluetooth:
Grouped Location Chart with ZoomCharts:
Another custom widget with ZoomCharts:
Google Translate Custom Widget:
Currency conversion custom widget with Google Finance:
Display stock price information from Google Sheets function "=GOOGLEFINANCE("NYSE:BABA","price",TODAY()-180,TODAY())"
Currency exchange trends:
Object detection with TensorFlow JS:
Tracking Coronavirus COVID-19 with Here:
Novel Coronavirus (COVID-19) Infection Map:
3D map with wrld3d.com:
Real-time temperature monitoring with WhatsApp notification:
SAPUI5 Date Picker Custom Widgets:
SAPUI5 KPI Tile Custom Widget:
SAP ChatBot Custom Widget with SAP Conversational AI:
SAPUI5 sap.suite.ui.commons.networkgraph.Graph:
SAC Visual Tree Mapper:
SAC Widget to Send and Receive Messages with RabbitMQ:
SAC Widget to Send and Receive Messages with Kafka:
Generic Tile Custom Widget:
Launch Zoom Meeting from Analytic App:
Custom Chat Bot Widget:
Covid-19 Widget:
Real Time Notification Custom Widget:
Zoom Meeting:
Sankey Diagram:
https://youtu.be/NpFv3AAE56I?si=SyION4yt2JyMnB8W
https://youtu.be/_HGiqIkAohU?si=IpHxwPhwQQ64o7xX
Bar Race Chart:
https://youtu.be/bF9BMh6pBCA?si=3VNh2yBGZdkFXyip
SAP Analytics Cloud Custom Widget Developer Guide
SAC Custom Widget Facebook Page
A custom widgets are implemented as Web Components. The Web Components are made of HTML, CSS and JavaScript.
Custom Widgets
Custom widget consists of the following files:
- Custom Widget JSON
The custom widget JSON file specifies the custom widget properties like id, version, name, description and so on. - Web Component JavaScript
A custom widget is composed of one or more Web Components.
Each Web Component is implemented in a Web Component JavaScript file, which defines and registers a custom element and implements the custom element’s JavaScript API. It has the lifecyles: constructor(), onCustomWidgetBeforeUpdate(), onCustomWidgetAfterUpdate(), connectedCallback(). - Web Component JavaScript of Styling Panel (optional)
The Styling Panel of a custom widget is an area in analytics designer where you can set property values of the custom widget at design time. It is implemented as a Web Component.
- Web Component JavaScript of Builder Panel (optional)
The Builder Panel of a custom widget is an area in analytics designer where you can set property values of the custom widget at design time. It is implemented as a Web Component.
- Icon file
Any icon file image in 16x16 pixels.
Prerequisites
You need a web server that hosts the resources of the custom widget files (JavaScript files, CSS files, images, and so on). Assume that your web server address is :
https://example.demo/customwidgetsCreate a Custom Widget
The Gauge Box custom widget consist of three Web Components: the actual Gauge Box, the Styling Panel and the Builder Panel of the Gauge Box and it consist the following files:
- box.json
Custom Widget JSON of Gauge Box. - box.js
Web Component JavaScript file of the Gauge Box. - box_sps.js
Web Component JavaScript file of the Styling Panel of the Gauge Box. - box_bps.js
Web Component JavaScript file of the Builder Panel of the Gauge Box. - icon.png
Icon of the Gauge Box in any 16x16 pixel icon.
1. Custom Widget JSON of Gauge Box (box.json)
The Gauge Box custom widget has the unique ID, version, and the name, which is displayed in the analytics designer, Styling Panel.
The Gauge Box custom widget is composed of the following three Web Components:
The first Web Component is the actual Gauge Box as indicated by the kind of "main". The second Web Component is the Styling Panel of the Gauge Box as indicated by the kind of "styling". The third Web Component is the Builder Panel of the Gauge Box as indicated by the kind of "builder".
Moving on, these are the properties of the Gauge Box custom widget: value, info, color, width and height.
The property value represents the value in percentage of the Gauge Box. The property info represents the title of the Gauge Box. The property color represents the color of the Gauge Box. And the properties width and height represent the initial width and height of the custom widget.
And then the script methods of the Gauge Box are defined:
The function setValue takes three parameters, newValue, newInfo and newColor. The body property contains the script code which sets the passed all the parameters to the respective Gauge Box's properties.
Function getValue takes no parameter and returns the percentage value of the Gauge Box.
Finally, an onClick event is defined:
Note that the event has no parameters.
2. Web Components JavaScript (box.js)
This section shows the Web Component JavaScript of the Gauge Box (box.js).
(function() {

	let template = document.createElement("template");

	template.innerHTML = `

		<style>

		:host {

			border-radius: 10px;

			border-width: 2px;

			border-color: black;

			border-style: solid;

			display: block;

		}


		body {

		  background: #fff;

		}


		.metric {

		  padding: 10%;

		}


		.metric svg {

		  max-width: 100%;

		}


		.metric path {

		  stroke-width: 75;

		  stroke: #ecf0f1;

		  fill: none;

		}


		.metric text {

		  font-family: "Lato", "Helvetica Neue", Helvetica, Arial, sans-serif;

		}


		.metric.participation path.data-arc {

		  stroke: #27ae60;

		}


		.metric.participation text {

		  fill: #27ae60;

		}

		</style>


		<div class="container">

		  <div class="row">

		    <div class="col-md-4 col-sm-4">

		      <div class="metric participation" data-ratio=".95">

		        <svg viewBox="0 0 1000 500">

			        <path d="M 950 500 A 450 450 0 0 0 50 500"></path>

					<text class='percentage' text-anchor="middle" alignment-baseline="middle" x="500" y="300" font-size="140" font-weight="bold">0%</text>

					<text class='title' text-anchor="middle" alignment-baseline="middle" x="500" y="450" font-size="90" font-weight="normal"></text>

  	            </svg>

		      </div>

		    </div>

		  </div>

		</div>

	`;


	class Box extends HTMLElement {

		constructor() {

			super();

			let shadowRoot = this.attachShadow({mode: "open"});

			shadowRoot.appendChild(template.content.cloneNode(true));


			this.$style = shadowRoot.querySelector('style');

			this.$svg = shadowRoot.querySelector('svg');


			this.addEventListener("click", event => {

				var event = new Event("onClick");

				this.dispatchEvent(event);

			});


			this._props = {};

		}


		render(val, info, color) {

			var val1 = val * 0.01;

			var x = this.svg_circle_arc_path(500, 500, 450, -90, val1 * 180.0 - 90);

			var rounded = Math.round( val * 10 ) / 10;


			if(rounded >=0 && rounded <=100) {

				this.$style.innerHTML = ':host {border-radius: 10px;border-width: 2px;border-color: black;border-style: solid;display: block;}.body {background: #fff;}.metric {padding: 10%;}.metric svg {max-width: 100%;}.metric path {stroke-width: 75;stroke: #ecf0f1;fill: none;}.metric text {font-family: "Lato", "Helvetica Neue", Helvetica, Arial, sans-serif;}.metric.participation path.data-arc {stroke: ' + color + ';}.metric.participation text {fill: ' + color + ';}';

				this.$svg.innerHTML = '<path d="M 950 500 A 450 450 0 0 0 50 500"></path><text class="percentage" text-anchor="middle" alignment-baseline="middle" x="500" y="300" font-size="140" font-weight="bold">' + rounded + '%</text><text class="title" text-anchor="middle" alignment-baseline="middle" x="500" y="450" font-size="90" font-weight="normal">' + info + '</text><path d="' + x + '" class="data-arc"></path>"';

			}

		}


		polar_to_cartesian(cx, cy, radius, angle) {

		    var radians;

		    radians = (angle - 90) * Math.PI / 180.0;

		    return [Math.round((cx + radius * Math.cos(radians)) * 100) / 100, Math.round((cy + radius * Math.sin(radians)) * 100) / 100];

		}


		svg_circle_arc_path(x, y, radius, start_angle, end_angle) {

		    var end_xy, start_xy;

		    start_xy = this.polar_to_cartesian(x, y, radius, end_angle);

		    end_xy = this.polar_to_cartesian(x, y, radius, start_angle);

		    return "M " + start_xy[0] + " " + start_xy[1] + " A " + radius + " " + radius + " 0 0 0 " + end_xy[0] + " " + end_xy[1];

		  };


		onCustomWidgetBeforeUpdate(changedProperties) {

			this._props = { ...this._props, ...changedProperties };

		}


		onCustomWidgetAfterUpdate(changedProperties) {

			if ("value" in changedProperties) {

				this.$value = changedProperties["value"];

			}


			if ("info" in changedProperties) {

				this.$info = changedProperties["info"];

			}


			if ("color" in changedProperties) {

				this.$color = changedProperties["color"];

			}


			this.render(this.$value, this.$info, this.$color);

		}

	}

	customElements.define("com-demo-gauge", Box);

})();
2.1 Template Object
The following code creates a template HTML element:
The template element represents the gauge chart.
2.2 JavaSript API of the Custom Element
- Constructor
The first function in the JavaScript API is the constructor.

The super() function is called, then the shadow DOM root element is created. The copy of the template element is added as a child element to the shadow DOM root element. An element style and svg is selected by using querySelector where shadowRoot is a reference to the document fragment. Finally, an event listener is attached to the custom element, listening for click events. Lastly, to make managing the properties of the Web Component easier, an empty _props object is initialized. - Handling Custom Widget Updates
In the onCustomWidgetBeforeUpdate() function, the properties in the changedProperties are merged with the properties of the _props object. The _props contains the state of all Gauge Box properties before the Gauge Box is updated.

In the onCustomWidgetAfterUpdate() function, the properties in the passed changedProperties object is used to directly set the gauge value, info(text information) and color of Gauge Box.
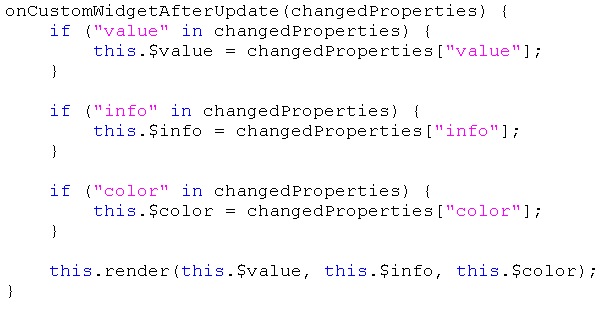
And finally call the render() function to update the chart.

3. Web Components JavaScript of the Styling Panel (box_sps.js)
The Styling Panel lets you change the background color of the Gauge chart in analytics designer.
This following code shows the Web Component JavaScript of the Styling Panel (box_sps.js).
(function()  {

	let template = document.createElement("template");

	template.innerHTML = `

		<form id="form">

			<fieldset>

				<legend>Color Properties</legend>

				<table>

					<tr>

						<td>Color</td>

						<td><input id="sps_color" type="text" size="40" maxlength="40"></td>

					</tr>

				</table>

				<input type="submit" style="display:none;">

			</fieldset>

		</form>

	`;


	class BoxSps extends HTMLElement {

		constructor() {

			super();

			this._shadowRoot = this.attachShadow({mode: "open"});

			this._shadowRoot.appendChild(template.content.cloneNode(true));

			this._shadowRoot.getElementById("form").addEventListener("submit", this._submit.bind(this));

		}


		_submit(e) {

			e.preventDefault();

			this.dispatchEvent(new CustomEvent("propertiesChanged", {

					detail: {

						properties: {

							color: this.color

						}

					}

			}));

		}


		set color(newColor) {

			this._shadowRoot.getElementById("sps_color").value = newColor;

		}


		get color() {

			return this._shadowRoot.getElementById("sps_color").value;

		}

	}


customElements.define("com-demo-box-sps", BoxSps);
The Web Component JavaScript defines a new custom element com-demo-box-sps. The JavaScript API of the new custom element is implemented in the BoxSps class which extends the JavaScript API of the HTMLElement class.
3.1 Template Object
The following code creates a template HTML element:
This template HTML element is a template for the shadow DOM HTML element that represents the HTML DOM of the Styling Panel of the Gauge Box.
3.2 JavaSript API of the Custom Element
- Constructor
The first function in the JavaScript API is the constructor.
 The super() function is called, then the shadow DOM root element is created. The copy of the template element is added as a child element to the shadow DOM root element.
Finally, an event listener is attached to form, listening for submit events. If one such event occurs, the event handler function _submit() is called. Calling bind() and passing this to _submit() ensures that in _submit() the keyword this references the custom element.The submit() function is implemented as follows:

The _submit() function calls function preventDefault() on the passed event object, which prevents submitting the form to the server.
Then, a custom event propertiesChanged is created, indicates a change of properties to the Custom Widget SDK framework. This custom event contains a JSON payload which is the color property of the custom widget. - Getters and Setters Property
The following code shows the implementation of color setter and getter functions.

The color setter function places a text representation of the new color into the input field of the Gauge Box’s Styling Panel.
The color getter function returns the text of the input field (color value) of the Gauge Box’s Styling Panel.
4. Web Components JavaScript of the Builder Panel (box_bps.js)
This Builder Panel lets you change the text color of the Gauge Box in analytics designer.
The code is very similar to the Web Components JavaScript of the Styling Panel. The following code shows the Web Component JavaScript of the Builder Panel (box_bps.js).
(function()  {

	let template = document.createElement("template");

	template.innerHTML = `

		<form id="form">

			<fieldset>

				<legend>Color Properties</legend>

				<table>

					<tr>

						<td>Color</td>

						<td><input id="bps_color" type="text" size="10" maxlength="10"></td>

					</tr>

				</table>

				<input type="submit" style="display:none;">

			</fieldset>

		</form>

		<style>

		:host {

			display: block;

			padding: 1em 1em 1em 1em;

		}

		</style>

	`;


	class BoxBps extends HTMLElement {

		constructor() {

			super();

			this._shadowRoot = this.attachShadow({mode: "open"});

			this._shadowRoot.appendChild(template.content.cloneNode(true));

			this._shadowRoot.getElementById("form").addEventListener("submit", this._submit.bind(this));

		}


		_submit(e) {

			e.preventDefault();

			this.dispatchEvent(new CustomEvent("propertiesChanged", {

					detail: {

						properties: {

							color: this.color

						}

					}

			}));

		}


		set color(newColor) {

			this._shadowRoot.getElementById("bps_color").value = newColor;

		}


		get color() {

			return this._shadowRoot.getElementById("bps_color").value;

		}

	}


	customElements.define("com-demo-box-bps", BoxBps);

})();
The Web Component JavaScript defines a new custom element com-demo-box-bps. The JavaScript API of the new custom element is implemented in the BoxSps class which extends the JavaScript API of the HTMLElement class.
4.1 Template Object
The following code creates a template HTML element:
This template HTML element is a template for the shadow DOM HTML element that represents the HTML DOM of the Builder Panel of the Gauge Box.
4.2 JavaSript API of the Custom Element
- Constructor
The first function in the JavaScript API is the constructor.
 The super() function is called, then the shadow DOM root element is created. The copy of the template element is added as a child element to the shadow DOM root element.
Finally, an event listener is attached to form, listening for submit events. If one such event occurs, the event handler function _submit() is called. Calling bind() and passing this to _submit() ensures that in _submit() the keyword this references the custom element.The submit() function is implemented as follows:

The _submit() function calls function preventDefault() on the passed event object, which prevents submitting the form to the server.
Then, a custom event propertiesChanged is created, indicates a change of properties to the Custom Widget SDK framework. This custom event contains a JSON payload which is the color property of the custom widget. - Getters and Setters Property
The following code shows the implementation of color setter and getter functions.

The color setter function places a text representation of the new color into the input field of the Gauge Box’s Builder Panel.
The color getter function returns the text of the input field (color value) of the Gauge Box’s Builder Panel.
Construct All Files Together
Once we have created all the required files, we need to organize in the following structure:
- Create a folder called customwidgets and put box.json into that folder.
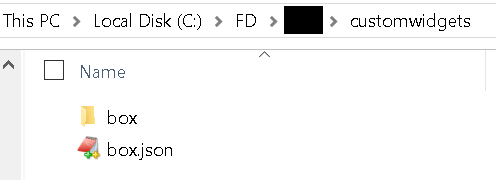
- Create another folder box inside customwidgets folder and put the rest of the files inside box folder.
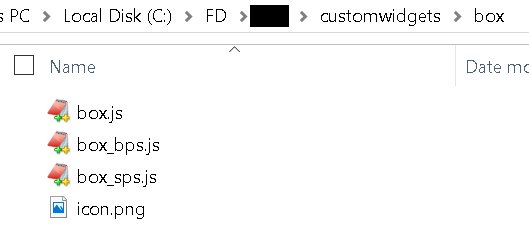
- Upload all files to the web server.
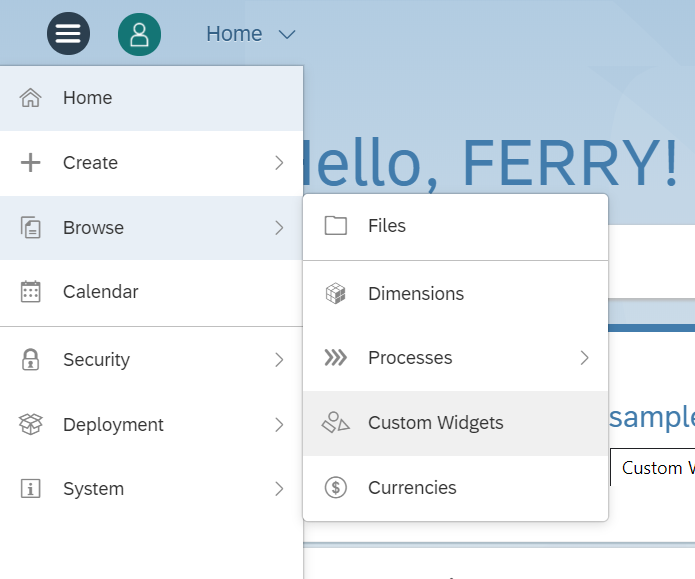
Adding the Custom Widget to Analytics Designer
- In the Analytics Designer, navigate to Main Menu > Browse > Custom Widgets. If you don't see this option, check your security roles.
- Click the Create toolbar icon.

- In the Upload File dialog, click the Select File button.
- Select the custom widget JSON file box.json.

- Create a new analytic application. The custom widget is listed in the widget list of the dropdown menu of the Add menu.

Using the Custom Widget in Analytics Designer
Once you have added the Gauge custom widget, you can see the following functions.
The below code illustrates who to define the parameters for the setValue function. And how to call the getValue function.
ScriptVariable_1 = ScriptVariable_1 + 1;

ScriptVariable_2 = ScriptVariable_2 - 1;


//Set value

Gauge_1.setValue(ScriptVariable_1, "Plus Gauge 1", "#e74c3c");

Gauge_2.setValue(ScriptVariable_2, "Plus Gauge 2", "#3498db");


//Get percentage value

console.log(Gauge_1.getValue());
See it in action:
Here is another demo of Google Gauge widget:
Chill the Lion:
Integration between amCharts and SAC:
Another integration with amChart and SAC:
Highcharts 3D Cylinder:
Google Map widget:
YouTube Player widget:
Multiple Instances of Google Gauges widget:
Another version of Google Map widget:
Singapore map widget:
Clock widget:
Geo Chart widget:
Rotate Globe widget:
Another Rotate Globe widget:
Liquid Fill Gauge widget:
QR code generator widget:
Word Cloud widget:
Solid Gauge widget:
Amchart Gauge widget:
Heat map widget:
Compass widget:
Text widget:
Linear Gauge widget:
Three.js custom widget:
3D object widget (with mouse controls):
3D scatter widget:
Bubble chart widget:
Barcode generator widget:
Pie Chart widget:
Day & Night World Map widget:
amCharts Serpentine timeline:
Column with Rotated Series from amCharts:
Stadium track chart from amCharts:
Radar Timeline chart from amCharts:
Dragging Pie Slices from amCharts:
Pictorial Chart from amCharts:
Radial Bar Chart with Highcharts:
Surface Chart with Anychart:
Seat Map Chart with Anychart:
Connector Map with Anychart:
Gauge with FusionCharts:
Cylinder Fill Chart with FusionCharts:
Gantt Chart with FusionCharts:
Map chart with FusionCharts:
Gauges with FusionCharts:
Google Poly:
Org chart with FusionCharts:
Radar (Spider) custom widget with FusionCharts:
A quick demo video to control the SAP Analytics Cloud Custom Widget with web Bluetooth and micro:bit. User presses the button A and B on micro:bit to fill in and out the cylinder gauge.
Control two Google Gauges widgets with two micro:bits and Web Bluetooth:
Grouped Location Chart with ZoomCharts:
Another custom widget with ZoomCharts:
Google Translate Custom Widget:
Currency conversion custom widget with Google Finance:
Display stock price information from Google Sheets function "=GOOGLEFINANCE("NYSE:BABA","price",TODAY()-180,TODAY())"
Currency exchange trends:
Object detection with TensorFlow JS:
Tracking Coronavirus COVID-19 with Here:
Novel Coronavirus (COVID-19) Infection Map:
3D map with wrld3d.com:
Real-time temperature monitoring with WhatsApp notification:
SAPUI5 Date Picker Custom Widgets:
SAPUI5 KPI Tile Custom Widget:
SAP ChatBot Custom Widget with SAP Conversational AI:
SAPUI5 sap.suite.ui.commons.networkgraph.Graph:
SAC Visual Tree Mapper:
SAC Widget to Send and Receive Messages with RabbitMQ:
SAC Widget to Send and Receive Messages with Kafka:
Generic Tile Custom Widget:
Launch Zoom Meeting from Analytic App:
Custom Chat Bot Widget:
Covid-19 Widget:
Real Time Notification Custom Widget:
Zoom Meeting:
Sankey Diagram:
https://youtu.be/NpFv3AAE56I?si=SyION4yt2JyMnB8W
https://youtu.be/_HGiqIkAohU?si=IpHxwPhwQQ64o7xX
Bar Race Chart:
https://youtu.be/bF9BMh6pBCA?si=3VNh2yBGZdkFXyip
More Tutorials Related to SAC Custom Widget
- Adding LED Display as an Threshold Indicator in SAP Analytics Cloud
- Display Stock Price with SAP Analytics Cloud Custom Widget and Google Sheets
- SAP Analytics Cloud Barcode Scanner Custom Widget
- Add and Use SAPUI5 Elements in SAP Analytics Cloud Custom Widget
- How to Build a Chatbot for SAP Analytics Cloud with SAP Conversational AI
- Execute Stored Procedure from SAP Analytics Cloud with NodeJS App
- SAP Analytics Cloud REST API Custom Widget
- SAP Analytics Cloud Custom Widget REST API with OAuth 2.0 and SAP HANA XSA
- SAP Analytics Cloud MultiInput Custom Widget
- Excel File Upload From SAP Analytics Cloud Analytic Application
- Populate Master Data in SAC Planning Model from an Excel File Upload with Analytic Application
- Protect SAP Analytics Cloud Analytic Application Code from Illegal Copy
- Network Graph Visualization in SAP Analytics Cloud Analytic App
- Build SAP Analytics Cloud QR Code Generator Custom Widget
- SAP Analytics Cloud Custom Widget to Send and Receive Messages with RabbitMQ
- SAP Analytics Cloud Custom Widget to Send and Receive Messages with Kafka
- Create Generic Tiles in SAP Analytics Cloud Analytic App
- Displaying a PDF File in SAP Analytics Cloud, Analytic App with Custom Widget
- Add Zoom Meeting Custom Widget in SAP Analytics Cloud, Analytic Application
- Build a Chat Bot Interface Custom Widget in SAP Analytics Cloud
- SAP Analytics Cloud Real Time Notification List Custom Widget
- SAP Analytics Cloud Zoom Meeting Custom Widget
- SAP Analytics Cloud, Analytics Application Slideshow Controller
- Interface SAP Analytics Cloud Google Gauge Custom Widget with RGB LED
- Control SAP Analytics Cloud, Analytics Designer App Remotely with Mobile Phone
- Build SAP Analytics Cloud QR Code Generator Custom Widget
Reference
SAP Analytics Cloud Custom Widget Developer Guide
SAC Custom Widget Facebook Page
- SAP Managed Tags:
- SAP Analytics Cloud,
- SAP Analytics Cloud, analytics designer,
- SAPUI5
62 Comments
You must be a registered user to add a comment. If you've already registered, sign in. Otherwise, register and sign in.
Labels in this area
-
"automatische backups"
1 -
"regelmäßige sicherung"
1 -
"TypeScript" "Development" "FeedBack"
1 -
505 Technology Updates 53
1 -
ABAP
22 -
ABAP API
1 -
ABAP CDS Views
4 -
ABAP CDS Views - BW Extraction
2 -
ABAP CDS Views - CDC (Change Data Capture)
1 -
ABAP class
2 -
ABAP Cloud
3 -
ABAP DDIC CDS view
1 -
ABAP Development
5 -
ABAP in Eclipse
3 -
ABAP Platform Trial
1 -
ABAP Programming
3 -
abap technical
1 -
abap to xml
1 -
abapGit
1 -
absl
2 -
access data from SAP Datasphere directly from Snowflake
1 -
Access data from SAP datasphere to Qliksense
1 -
Accrual
1 -
action
1 -
adapter modules
1 -
Addon
1 -
Adobe Document Services
1 -
ADS
1 -
ADS Config
1 -
ADS with ABAP
1 -
ADS with Java
1 -
ADT
3 -
Advance Shipping and Receiving
1 -
Advanced Event Mesh
3 -
Advanced formula
1 -
AEM
1 -
AI
9 -
AI Launchpad
2 -
AI Projects
1 -
AIML
11 -
Alert in Sap analytical cloud
1 -
Amazon S3
1 -
Analytic Models
1 -
Analytical Dataset
1 -
Analytical Model
1 -
Analytics
1 -
Analyze Workload Data
1 -
annotations
1 -
API
1 -
API and Integration
5 -
API Call
2 -
API security
1 -
Application Architecture
1 -
Application Development
5 -
Application Development for SAP HANA Cloud
3 -
Applications and Business Processes (AP)
1 -
Architecture
1 -
Artificial Intelligence
1 -
Artificial Intelligence (AI)
8 -
Artificial Intelligence (AI) 1 Business Trends 363 Business Trends 8 Digital Transformation with Cloud ERP (DT) 1 Event Information 462 Event Information 15 Expert Insights 114 Expert Insights 76 Life at SAP 418 Life at SAP 1 Product Updates 4
1 -
Artificial Intelligence (AI) blockchain Data & Analytics
2 -
Artificial Intelligence (AI) blockchain Data & Analytics Intelligent Enterprise
1 -
Artificial Intelligence (AI) blockchain Data & Analytics Intelligent Enterprise Oil Gas IoT Exploration Production
1 -
Artificial Intelligence (AI) blockchain Data & Analytics Intelligent Enterprise sustainability responsibility esg social compliance cybersecurity risk
1 -
Artificial Intelligence role in shaping the future of Energy Industry
1 -
AS Java
1 -
ASE
1 -
ASR
2 -
Asset Management
2 -
Associations in CDS Views
1 -
ASUG
1 -
Attachment Handling. Create Attachment
1 -
Attachments
1 -
Authentication
1 -
Authorisations
1 -
Authorizations
1 -
Automate the Interim Account Update rule using Integration Center Job (Time Off)
1 -
Automated Test
1 -
Automating Processes
1 -
Automation
2 -
aws
2 -
Azure
2 -
Azure AI Studio
2 -
Azure API Center
1 -
Azure API Management
1 -
B2B Integration
1 -
Background job
1 -
Backorder Processing
1 -
Backpropagation
1 -
Backup
1 -
Backup and Recovery
1 -
Backup schedule
1 -
BADI_MATERIAL_CHECK error message
1 -
Bank
1 -
Bank Communication Management
1 -
BAS
1 -
basis
2 -
Basis Monitoring & Tcodes with Key notes
2 -
Batch Management
1 -
BDC
1 -
Best Practice
1 -
BI
1 -
bitcoin
1 -
Blockchain
3 -
bodl
1 -
BOP in aATP
1 -
BOP Segments
1 -
BOP Strategies
1 -
BOP Variant
1 -
BPC
1 -
BPC LIVE
1 -
BTP
19 -
BTP AI Launchpad
1 -
BTP Destination
2 -
BTP for Sustainability
1 -
Business AI
1 -
Business and IT Integration
1 -
Business application stu
1 -
Business Application Studio
3 -
Business Architecture
1 -
Business Communication Services
1 -
Business Continuity
2 -
Business Data Fabric
3 -
Business Fabric
1 -
Business Partner
14 -
Business Partner Master Data
13 -
Business Technology Platform
2 -
Business Trends
4 -
Business_catalog
1 -
BW ODP
1 -
BW4 HANA Dev
1 -
BW4HANA
1 -
C4C cloud root certificate
1 -
CA
1 -
calculation view
1 -
CAP
6 -
CAP development
1 -
Capgemini
1 -
CAPM
1 -
Catalyst for Efficiency: Revolutionizing SAP Integration Suite with Artificial Intelligence (AI) and
1 -
CCMS
2 -
CDQ
13 -
CDS
2 -
CDS Views
1 -
Cental Finance
1 -
Certificates
1 -
CFL
1 -
Change Management
1 -
chatbot
1 -
ChatGPT
4 -
CICD
1 -
CL_SALV_TABLE
2 -
Class Runner
1 -
Classrunner
1 -
Cloud ALM Monitoring
1 -
Cloud ALM Operations
1 -
cloud connector
2 -
Cloud Extensibility
1 -
Cloud Foundry
4 -
Cloud Integration
6 -
Cloud Platform Integration
2 -
cloudalm
1 -
Collaboration
1 -
Collaborative Draft
1 -
communication
1 -
Compensation Information Management
1 -
Compensation Management
1 -
compliance
1 -
Compound Employee API
1 -
Configuration
1 -
Connectors
1 -
Consolidation
1 -
Consolidation Extension for SAP Analytics Cloud
4 -
Control Indicators.
1 -
Controller-Service-Repository pattern
1 -
Conversion
1 -
Corrective Maintenance
1 -
Cosine similarity
1 -
CPI
3 -
cryptocurrency
1 -
CSI
1 -
ctms
1 -
Custom chatbot
3 -
Custom Destination Service
1 -
custom fields
1 -
Custom Headers
1 -
Custom Widget
2 -
Customer Experience
1 -
Customer Journey
1 -
Customizing
1 -
cyber security
6 -
cybersecurity
1 -
DAC
1 -
Data
1 -
Data & Analytics
1 -
Data Aging
1 -
Data Analysis
1 -
Data Analytics
2 -
Data and Analytics (DA)
2 -
Data Archiving
1 -
Data Back-up
1 -
Data Flow
1 -
Data Governance
6 -
Data Integration
2 -
Data Quality
13 -
Data Quality Management
13 -
Data Replication
1 -
Data Synchronization
1 -
data transfer
1 -
Data Unleashed
1 -
Data Value
9 -
Database
1 -
Database and Data Management
1 -
database tables
1 -
Databricks
1 -
Dataframe
1 -
Datasphere
7 -
Datasphere Delta
1 -
datenbanksicherung
1 -
dba cockpit
1 -
dbacockpit
1 -
Debug
1 -
Debugging
2 -
Defender
1 -
Delimiting Pay Components
1 -
Delta Integrations
1 -
Destination
3 -
Destination Service
1 -
Developer extensibility
1 -
Developing with SAP Integration Suite
2 -
Devops
1 -
digital transformation
1 -
Disaster Recovery
1 -
Document Information Extraction
1 -
Documentation
1 -
Dot Product
1 -
DOX
1 -
DQM
1 -
dump database
1 -
dump transaction
1 -
duration
1 -
e-Invoice
1 -
E4H Conversion
1 -
Eclipse ADT
1 -
Eclipse ADT ABAP Development Tools
3 -
edoc
1 -
edocument
1 -
ELA
1 -
Embedded Consolidation
1 -
Embedding
1 -
Embeddings
1 -
Emergency Maintenance
1 -
Employee Central
1 -
Employee Central Payroll
1 -
Employee Central Time Off
1 -
Employee Information
1 -
Employee Rehires
1 -
Enable Now
1 -
Enable now manager
1 -
endpoint
1 -
Enhancement Request
1 -
Enterprise Architecture
2 -
Enterprise Asset Management
2 -
Entra
1 -
ESLint
1 -
ETL Business Analytics with SAP Signavio
1 -
Euclidean distance
1 -
Event Dates
1 -
Event Driven Architecture
1 -
Event Mesh
2 -
Event Reason
1 -
EventBasedIntegration
1 -
EWM
1 -
EWM Outbound configuration
1 -
EWM-TM-Integration
1 -
Existing Event Changes
1 -
Expand
1 -
Expert
2 -
Expert Insights
2 -
Exploits
1 -
Filter
1 -
Fiori
17 -
Fiori App Extension
2 -
Fiori Elements
2 -
Fiori Launchpad
2 -
Fiori SAPUI5
15 -
first-guidance
2 -
Flask
2 -
FLP_APP_MANAGER
1 -
FLP_CONTENT_MANAGER
1 -
Fragment Forms
1 -
Fragment Forms using ABA[
1 -
FTC
1 -
Full Stack
9 -
Funds Management
1 -
gCTS
1 -
Gemini
1 -
GenAI hub
1 -
General
3 -
Generative AI
4 -
Getting Started
1 -
GitHub
11 -
Google cloud
1 -
Grants Management
1 -
groovy
2 -
GTP
1 -
HANA
6 -
HANA Cloud
3 -
hana cloud database
2 -
Hana Cloud Database Integration
2 -
HANA DB
2 -
Hana Vector Engine
1 -
HANA XS Advanced
1 -
HanaDB
1 -
Historical Events
1 -
home labs
1 -
HowTo
1 -
HR Data Management
1 -
html5
9 -
HTML5 Application
1 -
Hyperlinks
1 -
ICCX
1 -
ico
1 -
Identity cards validation
1 -
idm
1 -
Impact of AI on Energy Industry's Future
1 -
Implementation
1 -
Improvement Maintenance
1 -
Infuse AI
1 -
Input Controls
1 -
input parameter
1 -
instant payments
1 -
Integration
4 -
Integration Advisor
1 -
Integration Architecture
1 -
Integration Center
1 -
Integration Suite
1 -
intelligent enterprise
1 -
Internal Table
1 -
IoT
2 -
Java
1 -
Java Script
1 -
JavaScript
2 -
JMS Receiver channel ping issue
1 -
job
1 -
Job Information Changes
1 -
Job-Related Events
1 -
Job_Event_Information
1 -
joule
5 -
Journal Entries
1 -
Just Ask
1 -
Kafka
1 -
Kerberos for ABAP
10 -
Kerberos for JAVA
9 -
KNN
1 -
Launch Wizard
1 -
Learning Content
3 -
Life at SAP
4 -
lightning
1 -
Linear Regression SAP HANA Cloud
1 -
Live Sessions
1 -
Loading Indicator
1 -
local tax regulations
1 -
LP
1 -
Machine Learning
6 -
Machine learning using SAP HANA
1 -
Marketing
1 -
Master Data
3 -
Master Data Governance
1 -
Master Data Management
15 -
Maxdb
2 -
MDG
2 -
MDGM
1 -
MDM
1 -
Message box.
1 -
Messages on RF Device
1 -
Microservices Architecture
1 -
Microsoft
1 -
Microsoft Universal Print
1 -
Middleware Solutions
1 -
Migration
6 -
ML Model Development
1 -
MLFlow
1 -
Modeling in SAP HANA Cloud
9 -
Monitoring
3 -
MPL
1 -
MTA
1 -
Multi-factor-authentication
1 -
Multi-Record Scenarios
1 -
Multilayer Perceptron
1 -
Multiple Event Triggers
1 -
Myself Transformation
1 -
Neo
1 -
NetWeaver
1 -
Neural Networks
1 -
New Event Creation
1 -
New Feature
1 -
Newcomer
1 -
NodeJS
3 -
OCR
1 -
ODATA
3 -
OData APIs
1 -
odatav2
1 -
ODATAV4
1 -
ODBC
1 -
ODBC Connection
1 -
ODP
1 -
ODP connectivity
1 -
ODP to Datasphere
1 -
Onpremise
1 -
open source
2 -
OpenAI
1 -
OpenAI API
1 -
Optimized Story Experience
1 -
Oracle
1 -
Overhead and Operational Maintenance
1 -
PaPM
1 -
PaPM Dynamic Data Copy through Writer function
1 -
PaPM Remote Call
1 -
Partner Built Foundation Model
1 -
PAS-C01
1 -
Pay Component Management
1 -
Personal story
1 -
PGP
1 -
Pickle
1 -
pio
1 -
PLANNING ARCHITECTURE
1 -
Plant Maintenance
2 -
Plugin Attachment
1 -
PO Directory API
1 -
Popup in Sap analytical cloud
1 -
Postgresql
1 -
PostgrSQL
1 -
POSTMAN
1 -
Practice Systems
1 -
Prettier
1 -
Proactive Maintenance
1 -
Process Automation
3 -
Process Management
1 -
Product Updates
6 -
Product Updates
1 -
PSE
1 -
PSM
1 -
Public Cloud
1 -
Python
5 -
python library - Document information extraction service
1 -
Qlik
1 -
Qualtrics
1 -
RAP
3 -
RAP BO
2 -
Rapid Data Governance
2 -
RDG
1 -
React
1 -
Reactive Maintenance
2 -
Record Deletion
1 -
Recovery
1 -
recurring payments
1 -
redeply
1 -
Release
1 -
Remote Consumption Model
1 -
Replication Flows
1 -
Replication using Cloud Connector
1 -
Report Malfunction
1 -
report painter
1 -
research
1 -
Research and Development Custom Widgets in SAP Analytics Cloud
1 -
Resilience
1 -
REST
1 -
REST API
1 -
Retagging Required
1 -
RFC
1 -
RFID
1 -
Risk
1 -
Robots
1 -
rolandkramer
3 -
Rolling Kernel Switch
1 -
route
1 -
Route determination
1 -
Router Non-XML condition
1 -
rules
1 -
S4 HANA
3 -
S4 HANA ABAP Dev
1 -
S4 HANA Cloud
2 -
S4 HANA On-Premise
3 -
S4HANA
8 -
S4HANA Cloud
1 -
S4HANA_OP_2023
2 -
SAC
13 -
SAC PLANNING
10 -
SAC STORIES
1 -
SAN
1 -
SAP
4 -
SAP ABAP
1 -
SAP Advanced Event Mesh
2 -
SAP AI
1 -
SAP AI Core
11 -
SAP AI Launchpad
9 -
SAP Analytic Cloud
1 -
SAP Analytic Cloud Compass
1 -
Sap Analytical Cloud
1 -
SAP Analytics Cloud
9 -
SAP Analytics Cloud for Consolidation
4 -
SAP Analytics cloud planning
1 -
SAP Analytics Cloud Story
1 -
SAP analytics clouds
1 -
SAP API Management
1 -
SAP Application Lifecycle Management
1 -
SAP Application Logging Service
1 -
SAP BAS
1 -
SAP Basis
6 -
SAP BO FC migration
1 -
SAP BODS
1 -
SAP BODS certification.
1 -
SAP BODS migration
1 -
SAP BPC migration
1 -
SAP BTP
28 -
SAP BTP Build Work Zone
3 -
SAP BTP Cloud Foundry
9 -
SAP BTP Costing
1 -
SAP BTP CTMS
1 -
SAP BTP Generative AI
1 -
SAP BTP Innovation
1 -
SAP BTP Migration Tool
1 -
SAP BTP SDK IOS
1 -
SAP BTPEA
1 -
SAP Build
12 -
SAP Build App
1 -
SAP Build apps
1 -
SAP Build CodeJam
1 -
SAP Build Process Automation
5 -
SAP Build work zone
11 -
SAP Business AI
1 -
SAP Business Objects Platform
1 -
SAP Business Technology
2 -
SAP Business Technology Platform (XP)
1 -
sap bw
2 -
SAP CAP
3 -
SAP CDC
1 -
SAP CDP
1 -
SAP CDS VIEW
1 -
SAP Certification
1 -
SAP Cloud ALM
5 -
SAP Cloud Application Programming Model
2 -
SAP Cloud Integration
3 -
SAP Cloud Integration for Data Services
1 -
SAP cloud platform
10 -
SAP Companion
1 -
SAP CPI
3 -
SAP CPI (Cloud Platform Integration)
3 -
SAP CPI Discover tab
1 -
sap credential store
1 -
SAP Customer Data Cloud
1 -
SAP Customer Data Platform
1 -
SAP Data Intelligence
1 -
SAP Data Migration in Retail Industry
1 -
SAP Data Services
1 -
SAP DATABASE
1 -
SAP Dataspher to Non SAP BI tools
1 -
SAP Datasphere
12 -
SAP DRC
1 -
SAP EWM
1 -
SAP Fiori
4 -
SAP Fiori App Embedding
1 -
Sap Fiori Extension Project Using BAS
1 -
SAP GRC
1 -
SAP HANA
1 -
SAP HANA Dev tools
1 -
SAP HANA PAL
1 -
SAP HANA Vector
1 -
SAP HCM (Human Capital Management)
1 -
SAP HR Solutions
1 -
SAP IDM
1 -
SAP Integration Suite
11 -
SAP Integrations
4 -
SAP iRPA
2 -
SAP LAGGING AND SLOW
1 -
SAP learning
1 -
SAP Learning Class
2 -
SAP Learning Hub
1 -
SAP Master Data
1 -
SAP MDG
1 -
SAP mentor
1 -
SAP Mentors
1 -
SAP Odata
3 -
SAP on Azure
3 -
SAP PAL
1 -
SAP PartnerEdge
1 -
sap partners
1 -
SAP Password Reset
1 -
SAP PO Migration
1 -
SAP PO to CPI Migration
1 -
SAP Prepackaged Content
1 -
sap print
1 -
SAP Process Automation
2 -
SAP Process Integration
3 -
SAP Process Orchestration
2 -
SAP Router
1 -
SAP S4HANA
2 -
SAP S4HANA Cloud
3 -
SAP S4HANA Cloud for Finance
1 -
SAP S4HANA Cloud private edition
1 -
SAP Sandbox
1 -
SAP Sapphire
1 -
SAP STMS
1 -
SAP successfactors
3 -
SAP SuccessFactors HXM Core
1 -
SAP Time
1 -
SAP TM
2 -
SAP Trading Partner Management
1 -
SAP UI5
1 -
SAP Upgrade
1 -
SAP Utilities
1 -
SAP-GUI
9 -
SAP-Login-PowerShell
1 -
SAP_COM_0276
1 -
SAPBTP
1 -
SAPCPI
1 -
SAPEWM
1 -
sapfirstguidance
4 -
SAPHANAService
1 -
SAPIQ
2 -
sapmentors
1 -
saponaws
2 -
saprouter
1 -
SAPRouter installation
1 -
SAPS4HANA
1 -
SAPUI5
6 -
SAPUI5 Extensibility
1 -
schedule
1 -
Script Operator
1 -
Secure Login Client Setup
9 -
security
11 -
Selenium Testing
1 -
Self Transformation
1 -
Self-Transformation
1 -
SEN
1 -
SEN Manager
1 -
Sender
1 -
service
2 -
SET_CELL_TYPE
1 -
SET_CELL_TYPE_COLUMN
1 -
SFTP scenario
2 -
Simplex
1 -
Single Sign On
9 -
Singlesource
1 -
SKLearn
1 -
Skybuffer AI
1 -
Slow loading
1 -
SOAP
3 -
SOAP Web Service
2 -
Software Development
1 -
SOLMAN
1 -
solman 7.2
2 -
Solution Manager
3 -
sp_dumpdb
1 -
sp_dumptrans
1 -
SQL
2 -
sql script
1 -
SSL
10 -
SSO
9 -
Story2
1 -
Substring function
1 -
SuccessFactors
1 -
SuccessFactors Platform
1 -
SuccessFactors Time Tracking
1 -
Sybase
1 -
Syniti RDG
1 -
Synthetic User Monitoring
1 -
system copy method
1 -
System owner
1 -
Table splitting
1 -
Tax Integration
1 -
Technical article
1 -
Technical articles
1 -
Technical_catalog
1 -
Technology Architecture
1 -
Technology Updates
15 -
Technology Updates
1 -
Technology_Updates
1 -
terraform
1 -
Testing
1 -
Threats
2 -
Time Collectors
1 -
Time Off
2 -
Time Sheet
1 -
Time Sheet SAP SuccessFactors Time Tracking
1 -
Tips and tricks
2 -
toggle button
1 -
Tools
1 -
Trainings & Certifications
2 -
Transformation Flow
1 -
Transport in SAP BODS
1 -
Transport Management
1 -
TypeScript
3 -
ui designer
1 -
unbind
1 -
Unified Customer Profile
1 -
UPB
1 -
UploadSetTable
1 -
Use of Parameters for Data Copy in PaPM
1 -
User Unlock
1 -
VA02
1 -
Validations
1 -
Vector Database
2 -
Vector Engine
1 -
Vectorization
1 -
Visual Studio Code
1 -
VSCode
2 -
VSCode extenions
1 -
Vulnerabilities
1 -
Web SDK
1 -
Web Service Configuration
1 -
Webhook
1 -
where used
1 -
work zone
1 -
Workflow Management
2 -
workload
1 -
xml
1 -
xml to csv
1 -
xsa
1 -
XSA Refresh
1
- « Previous
- Next »
Related Content
- Filter unavailable. Incorrect operation of a story in SAP Analytics Cloud in Technology Q&A
- New SAP Analytics Cloud Performance Workshop in Technology Blogs by SAP
- What's the major difference between odata and S/4hana Conection in SAP Analytics cloud? in Technology Q&A
- Top 9 takeaways #SAPSapphire 2024 in Technology Blogs by SAP
- SAP Analytics Cloud Live data connection to SAP SuccessFactors in Technology Blogs by SAP
Top kudoed authors
| User | Count |
|---|---|
| 5 | |
| 4 | |
| 4 | |
| 3 | |
| 3 | |
| 3 | |
| 3 | |
| 3 | |
| 3 | |
| 2 |