
- SAP Community
- Products and Technology
- Technology
- Technology Blogs by Members
- Building an Analytical List Page with CAP OData V4
Technology Blogs by Members
Explore a vibrant mix of technical expertise, industry insights, and tech buzz in member blogs covering SAP products, technology, and events. Get in the mix!
Turn on suggestions
Auto-suggest helps you quickly narrow down your search results by suggesting possible matches as you type.
Showing results for
MioYasutake
Active Contributor
Options
- Subscribe to RSS Feed
- Mark as New
- Mark as Read
- Bookmark
- Subscribe
- Printer Friendly Page
- Report Inappropriate Content
06-12-2023
10:28 PM
Introduction
In this blog post, I am going to demonstrate how to annotate CAP service to enable the display of an Analytical List Page (ALP). I discovered this solution in deepak_singh99's GitHub repository (currently not available), so I want to give credit to him.
Scenario
To build a very basic ALP app on top of CAP OData V4 service as shown below. The code is available at GitHub.
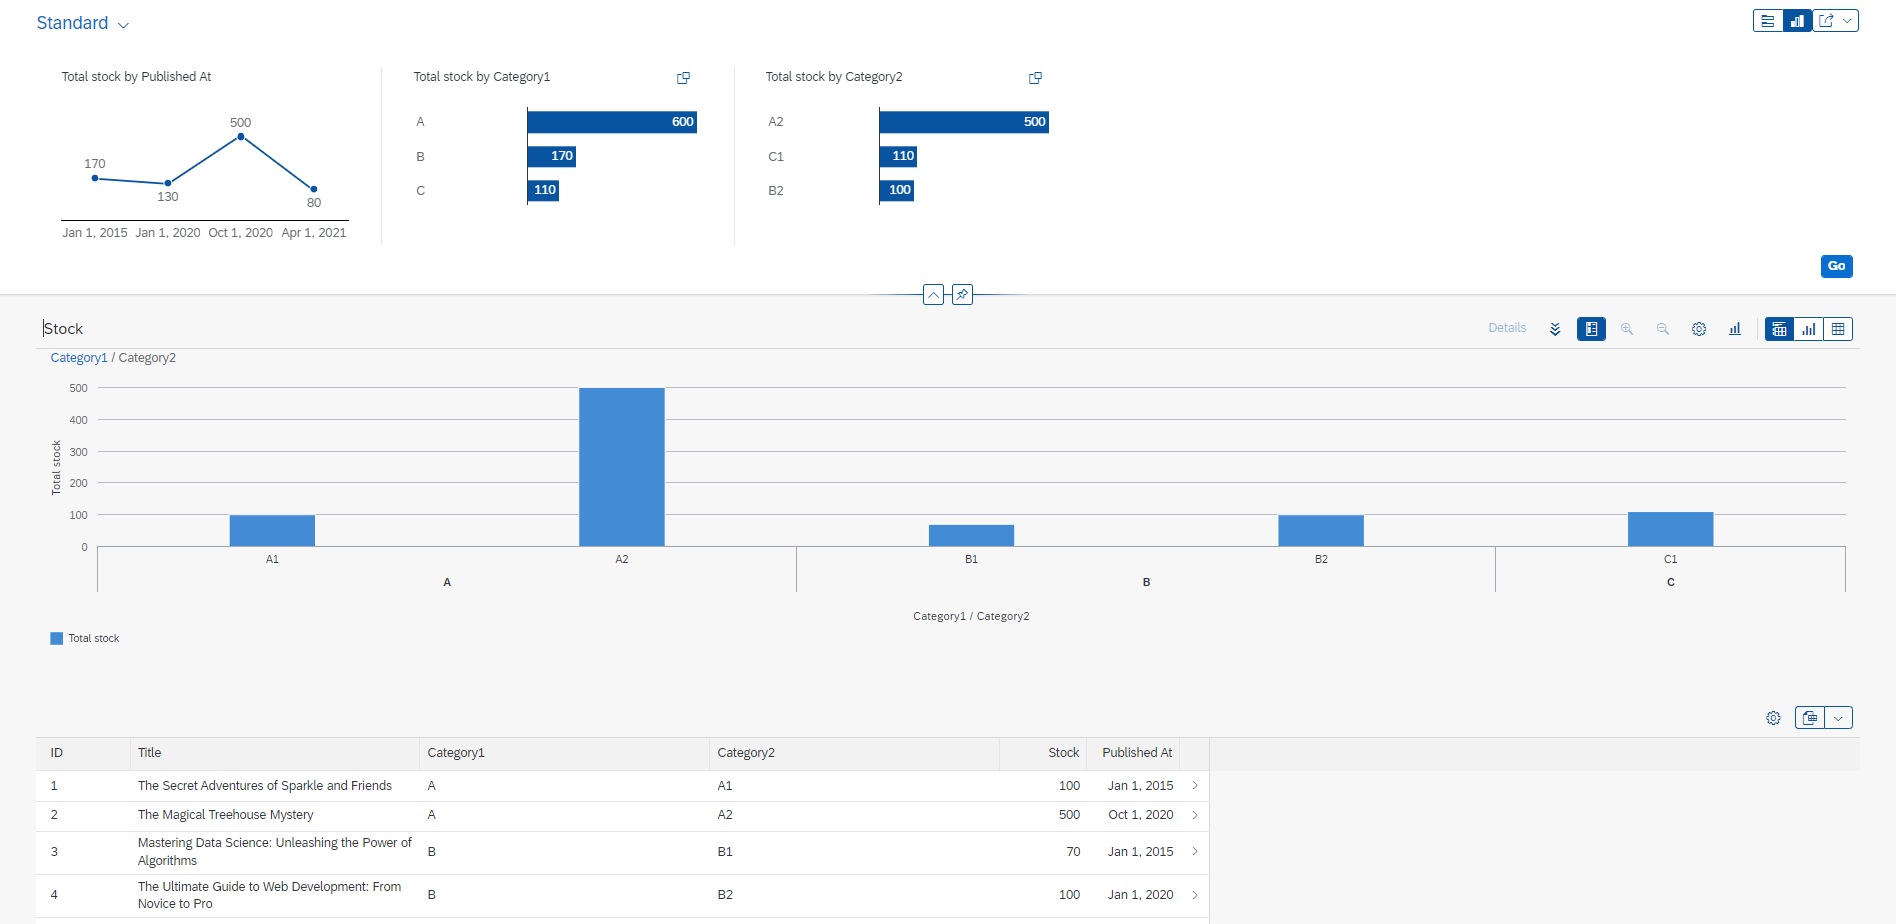
Analytical List Page
Steps
- Create a data model
- Add annotations
- Create ALP
1. Create a data model
I have created a very basic data model based on a Books entity generated by `cds add samples` command.
namespace my.bookshop;


entity Books {

  key ID : Integer @title: 'ID';

  title  : String @title: 'Title';

  stock  : Integer @title: 'Stock';

  category1: String @title: 'Category1';

  category2: String @title: 'Category2';

  publishedAt: Date @title: 'Published At';

}
The data model is exposed to the service as is.
using my.bookshop as my from '../db/data-model';


service CatalogService {

    @readonly entity BooksAnalytics as projection on my.Books;

}
2. Add annotations
I will explain the annotations added by dividing them into four blocks for clarity.
The first block focuses on enabling aggregate functions. These annotations are crucial for Fiori tools to properly recognize and support the Analytical List Page (ALP). Without these annotations, Fiori tools may raise error indicating the absence of a suitable entity for ALP.
annotate CatalogService.BooksAnalytics with @(

  Aggregation.ApplySupported: {

    Transformations: [

      'aggregate',

      'topcount',

      'bottomcount',

      'identity',

      'concat',

      'groupby',

      'filter',

      'expand',

      'search'

    ],

    GroupableProperties: [

      ID,

      category1,

      category2,

      title,

      publishedAt

    ],

    AggregatableProperties: [{

      $Type : 'Aggregation.AggregatablePropertyType',

      Property: stock

    }]

  },

  Analytics.AggregatedProperty #totalStock: {

    $Type : 'Analytics.AggregatedPropertyType',

    AggregatableProperty : stock,

    AggregationMethod : 'sum',

    Name : 'totalStock',

    ![@Common.Label]: 'Total stock'

  },

);
The second block is for displaying a chart in the middle of the ALP. One point that was new to me was the use of DynamicMeasure. With OData V2, you may be familiar with "normal" Measure annotations. However, in the context of OData V4, normal Measure somehow does not work, so you need to use DynamicMeasure, which references the @analytics.AggregatedProparety defined in the first block.
annotate CatalogService.BooksAnalytics with @(

  UI.Chart: {

    $Type : 'UI.ChartDefinitionType',

    Title: 'Stock',

    ChartType : #Column,

    Dimensions: [

      category1,

      category2

    ],

    DimensionAttributes: [{

      $Type : 'UI.ChartDimensionAttributeType',

      Dimension: category1,

      Role: #Category

    },{

      $Type : 'UI.ChartDimensionAttributeType',

      Dimension: category2,

      Role: #Category2

    }],

    DynamicMeasures: [

      ![@Analytics.AggregatedProperty#totalStock]

    ],

    MeasureAttributes: [{

      $Type: 'UI.ChartMeasureAttributeType',

      DynamicMeasure: ![@Analytics.AggregatedProperty#totalStock],

      Role: #Axis1

    }]

  },

  UI.PresentationVariant: {

    $Type : 'UI.PresentationVariantType',

    Visualizations : [

        '@UI.Chart',

    ],

  }

);
The third block focuses on displaying visual filters. To achieve this, you will need three annotation blocks: chart, presentation variant and value list. The chart annotation block is similar to the one in the second block. However, please note that OData V4 currently only supports bar and line chart types for visual filters, whereas OData V2 also supports donut charts.
* You can also add these annotations with the guided development feature of Fiori tools, which will be much easier.
annotate CatalogService.BooksAnalytics with @(

  UI.Chart #category1: {

    $Type : 'UI.ChartDefinitionType',

    ChartType: #Bar,

    Dimensions: [

      category1

    ],

    DynamicMeasures: [

      ![@Analytics.AggregatedProperty#totalStock]

    ]

  },

  UI.PresentationVariant #prevCategory1: {

    $Type : 'UI.PresentationVariantType',

    Visualizations : [

        '@UI.Chart#category1',

    ],

  }

){

  category1 @Common.ValueList #vlCategory1: {

    $Type : 'Common.ValueListType',

    CollectionPath : 'BooksAnalytics',

    Parameters: [{

      $Type : 'Common.ValueListParameterInOut',

      ValueListProperty : 'category1',

      LocalDataProperty: category1

    }],

    PresentationVariantQualifier: 'prevCategory1'

  }

}
The fourth block consists of SelectionFields and LineItem annotations that you may already be familiar with.
annotate CatalogService.BooksAnalytics with@(

    UI: {

        SelectionFields  : [

            category1,

            category2,

            publishedAt

        ],

        LineItem: [

            {  $Type : 'UI.DataField', Value : ID, },

            {  $Type : 'UI.DataField', Value : title, },

            {  $Type : 'UI.DataField', Value : category1, },

            {  $Type : 'UI.DataField', Value : category2, },

            {  $Type : 'UI.DataField', Value : stock, },

            {  $Type : 'UI.DataField', Value : publishedAt, },

        ],

    }

);
3. Create ALP
Let's proceed with creating an ALP with using the template.

Floorplan selection
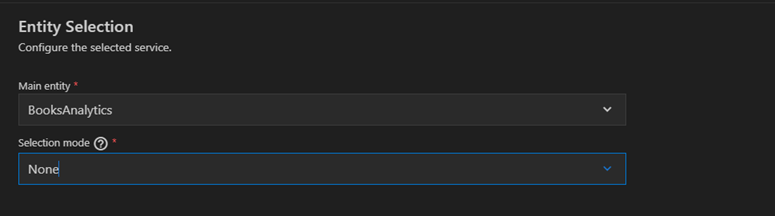
Entity Selection
To configure ALP, you need to make some settings in the "options"."settings" seciton of the manifest.json file. The "views" section is used to display the main chart and table. This section is included by default when generating the app using the "Analytical List Page" template. If you wish to use different annotations than the default ones (without qualifier), you need to make the necessary adjustment here.
The "@com.sap.vocabularies.UI.v1.SelectionFields" section in the "controlConfiguration" is used to show the visual filters. It's important to note that the filterFields names must match the property names of the entity used.
"options": {

                        "settings": {

                            "entitySet": "BooksAnalytics",

                            ...,

                            "controlConfiguration": {

                                "@com.sap.vocabularies.UI.v1.LineItem": {

                                    "tableSettings": {

                                        "type": "ResponsiveTable",

                                        "selectionMode": "None"

                                    }

                                },

                                "@com.sap.vocabularies.UI.v1.SelectionFields": {

                                    "layout": "CompactVisual",

                                    "initialLayout": "Visual",

                                    "filterFields": {

                                        "category1": {

                                            "visualFilter": {

                                                "valueList": "com.sap.vocabularies.Common.v1.ValueList#vlCategory1"

                                            }

                                        },

                                        "category2": {

                                            "visualFilter": {

                                                "valueList": "com.sap.vocabularies.Common.v1.ValueList#vlCategory2"

                                            }

                                        },

                                        "publishedAt": {

                                            "visualFilter": {

                                                "valueList": "com.sap.vocabularies.Common.v1.ValueList#vlPublishedAt"

                                            }

                                        }

                                    }

                                }

                            },

                            "views": {

                                "paths": [

                                    {

                                        "primary": [{"annotationPath": "com.sap.vocabularies.UI.v1.PresentationVariant"}],

                                        "secondary": [{"annotationPath": "com.sap.vocabularies.UI.v1.LineItem"}],

                                        "defaultPath": "both"

                                    }

                                ]

                            }

                        }

                    }
A note about the table type
By default, the table type for the Analytical List Page is set to "AnalyticalTable". However, with this setting, measures are not displayed in the table. You can observe that "Stock" column in the below image is empty.

AnalyticalTable does not show measures
From my investigation, AnalyticalTable requires simple aggregation annotation as shown below:
annotate CatalogService.BooksAnalytics with @(

  Aggregation.ApplySupported

);
However, you cannot display charts with this simple annotation. To work around this issue, I had to use ResponsiveTable instead of AnalyticalTable. If anyone knows the how we can use AnalyticalTable, please let me know in the comment section.
Closing
By utilizing the mentioned settings and configurations, you can successfully create an Analytical List Page (ALP) on top of CAP OData V4 service. I hope this article has provided valuable insights into the analytical capabilities of CAP and OData V4. Thanks for reading!
References
- SAP Managed Tags:
- SAP Business Application Studio,
- SAP Fiori Elements,
- SAP Cloud Application Programming Model
13 Comments
You must be a registered user to add a comment. If you've already registered, sign in. Otherwise, register and sign in.
Labels in this area
-
"automatische backups"
1 -
"regelmäßige sicherung"
1 -
"TypeScript" "Development" "FeedBack"
1 -
505 Technology Updates 53
1 -
ABAP
16 -
ABAP API
1 -
ABAP CDS Views
2 -
ABAP CDS Views - BW Extraction
1 -
ABAP CDS Views - CDC (Change Data Capture)
1 -
ABAP class
2 -
ABAP Cloud
3 -
ABAP Development
5 -
ABAP in Eclipse
1 -
ABAP Platform Trial
1 -
ABAP Programming
2 -
abap technical
1 -
abapGit
1 -
absl
2 -
access data from SAP Datasphere directly from Snowflake
1 -
Access data from SAP datasphere to Qliksense
1 -
Accrual
1 -
action
1 -
adapter modules
1 -
Addon
1 -
Adobe Document Services
1 -
ADS
1 -
ADS Config
1 -
ADS with ABAP
1 -
ADS with Java
1 -
ADT
2 -
Advance Shipping and Receiving
1 -
Advanced Event Mesh
3 -
Advanced formula
1 -
AEM
1 -
AI
8 -
AI Launchpad
1 -
AI Projects
1 -
AIML
10 -
Alert in Sap analytical cloud
1 -
Amazon S3
1 -
Analytic Models
1 -
Analytical Dataset
1 -
Analytical Model
1 -
Analytics
1 -
Analyze Workload Data
1 -
annotations
1 -
API
1 -
API and Integration
4 -
API Call
2 -
API security
1 -
Application Architecture
1 -
Application Development
5 -
Application Development for SAP HANA Cloud
3 -
Applications and Business Processes (AP)
1 -
Artificial Intelligence
1 -
Artificial Intelligence (AI)
5 -
Artificial Intelligence (AI) 1 Business Trends 363 Business Trends 8 Digital Transformation with Cloud ERP (DT) 1 Event Information 462 Event Information 15 Expert Insights 114 Expert Insights 76 Life at SAP 418 Life at SAP 1 Product Updates 4
1 -
Artificial Intelligence (AI) blockchain Data & Analytics
1 -
Artificial Intelligence (AI) blockchain Data & Analytics Intelligent Enterprise
1 -
Artificial Intelligence (AI) blockchain Data & Analytics Intelligent Enterprise Oil Gas IoT Exploration Production
1 -
Artificial Intelligence (AI) blockchain Data & Analytics Intelligent Enterprise sustainability responsibility esg social compliance cybersecurity risk
1 -
AS Java
1 -
ASE
1 -
ASR
2 -
ASUG
1 -
Attachments
1 -
Authentication
1 -
Authorisations
1 -
Automating Processes
1 -
Automation
2 -
aws
2 -
Azure
2 -
Azure AI Studio
1 -
Azure API Center
1 -
Azure API Management
1 -
B2B Integration
1 -
Background job
1 -
Backorder Processing
1 -
Backpropagation
1 -
Backup
1 -
Backup and Recovery
1 -
Backup schedule
1 -
BADI_MATERIAL_CHECK error message
1 -
Bank
1 -
Bank Communication Management
1 -
BAS
1 -
basis
2 -
Basis Monitoring & Tcodes with Key notes
2 -
Batch Management
1 -
BDC
1 -
Best Practice
1 -
BI
1 -
bitcoin
1 -
Blockchain
3 -
bodl
1 -
BOP in aATP
1 -
BOP Segments
1 -
BOP Strategies
1 -
BOP Variant
1 -
BPC
1 -
BPC LIVE
1 -
BTP
14 -
BTP AI Launchpad
1 -
BTP Destination
2 -
Business AI
1 -
Business and IT Integration
1 -
Business application stu
1 -
Business Application Studio
1 -
Business Architecture
1 -
Business Communication Services
1 -
Business Continuity
2 -
Business Data Fabric
3 -
Business Fabric
1 -
Business Partner
13 -
Business Partner Master Data
11 -
Business Technology Platform
2 -
Business Trends
4 -
BW4HANA
1 -
CA
1 -
calculation view
1 -
CAP
4 -
Capgemini
1 -
CAPM
1 -
Catalyst for Efficiency: Revolutionizing SAP Integration Suite with Artificial Intelligence (AI) and
1 -
CCMS
2 -
CDQ
13 -
CDS
2 -
Cental Finance
1 -
Certificates
1 -
CFL
1 -
Change Management
1 -
chatbot
1 -
chatgpt
3 -
CICD
1 -
CL_SALV_TABLE
2 -
Class Runner
1 -
Classrunner
1 -
Cloud ALM Monitoring
1 -
Cloud ALM Operations
1 -
cloud connector
1 -
Cloud Extensibility
1 -
Cloud Foundry
4 -
Cloud Integration
6 -
Cloud Platform Integration
2 -
cloudalm
1 -
communication
1 -
Compensation Information Management
1 -
Compensation Management
1 -
Compliance
1 -
Compound Employee API
1 -
Configuration
1 -
Connectors
1 -
Consolidation
1 -
Consolidation Extension for SAP Analytics Cloud
3 -
Control Indicators.
1 -
Controller-Service-Repository pattern
1 -
Conversion
1 -
Cosine similarity
1 -
CPI
1 -
cryptocurrency
1 -
CSI
1 -
ctms
1 -
Custom chatbot
3 -
Custom Destination Service
1 -
custom fields
1 -
Custom Headers
1 -
Customer Experience
1 -
Customer Journey
1 -
Customizing
1 -
cyber security
4 -
cybersecurity
1 -
Data
1 -
Data & Analytics
1 -
Data Aging
1 -
Data Analytics
2 -
Data and Analytics (DA)
1 -
Data Archiving
1 -
Data Back-up
1 -
Data Flow
1 -
Data Governance
5 -
Data Integration
2 -
Data Quality
13 -
Data Quality Management
13 -
Data Synchronization
1 -
data transfer
1 -
Data Unleashed
1 -
Data Value
9 -
Database and Data Management
1 -
database tables
1 -
Databricks
1 -
Dataframe
1 -
Datasphere
3 -
datenbanksicherung
1 -
dba cockpit
1 -
dbacockpit
1 -
Debugging
2 -
Defender
1 -
Delimiting Pay Components
1 -
Delta Integrations
1 -
Destination
3 -
Destination Service
1 -
Developer extensibility
1 -
Developing with SAP Integration Suite
1 -
Devops
1 -
digital transformation
1 -
Disaster Recovery
1 -
Documentation
1 -
Dot Product
1 -
DQM
1 -
dump database
1 -
dump transaction
1 -
e-Invoice
1 -
E4H Conversion
1 -
Eclipse ADT ABAP Development Tools
2 -
edoc
1 -
edocument
1 -
ELA
1 -
Embedded Consolidation
1 -
Embedding
1 -
Embeddings
1 -
Employee Central
1 -
Employee Central Payroll
1 -
Employee Central Time Off
1 -
Employee Information
1 -
Employee Rehires
1 -
Enable Now
1 -
Enable now manager
1 -
endpoint
1 -
Enhancement Request
1 -
Enterprise Architecture
1 -
Entra
1 -
ESLint
1 -
ETL Business Analytics with SAP Signavio
1 -
Euclidean distance
1 -
Event Dates
1 -
Event Driven Architecture
1 -
Event Mesh
2 -
Event Reason
1 -
EventBasedIntegration
1 -
EWM
1 -
EWM Outbound configuration
1 -
EWM-TM-Integration
1 -
Existing Event Changes
1 -
Expand
1 -
Expert
2 -
Expert Insights
2 -
Exploits
1 -
Fiori
16 -
Fiori Elements
2 -
Fiori SAPUI5
13 -
first-guidance
1 -
Flask
2 -
FTC
1 -
Full Stack
9 -
Funds Management
1 -
gCTS
1 -
GenAI hub
1 -
General
2 -
Generative AI
1 -
Getting Started
1 -
GitHub
11 -
Google cloud
1 -
Grants Management
1 -
groovy
2 -
GTP
1 -
HANA
6 -
HANA Cloud
2 -
Hana Cloud Database Integration
2 -
HANA DB
2 -
Hana Vector Engine
1 -
HANA XS Advanced
1 -
Historical Events
1 -
home labs
1 -
HowTo
1 -
HR Data Management
1 -
html5
9 -
HTML5 Application
1 -
Identity cards validation
1 -
idm
1 -
Implementation
1 -
Infuse AI
1 -
input parameter
1 -
instant payments
1 -
Integration
3 -
Integration Advisor
1 -
Integration Architecture
1 -
Integration Center
1 -
Integration Suite
1 -
intelligent enterprise
1 -
Internal Table
1 -
iot
1 -
Java
1 -
JMS Receiver channel ping issue
1 -
job
1 -
Job Information Changes
1 -
Job-Related Events
1 -
Job_Event_Information
1 -
joule
4 -
Journal Entries
1 -
Just Ask
1 -
Kerberos for ABAP
10 -
Kerberos for JAVA
9 -
KNN
1 -
Launch Wizard
1 -
Learning Content
2 -
Life at SAP
5 -
lightning
1 -
Linear Regression SAP HANA Cloud
1 -
Loading Indicator
1 -
local tax regulations
1 -
LP
1 -
Machine Learning
4 -
Marketing
1 -
Master Data
3 -
Master Data Management
15 -
Maxdb
2 -
MDG
1 -
MDGM
1 -
MDM
1 -
Message box.
1 -
Messages on RF Device
1 -
Microservices Architecture
1 -
Microsoft
1 -
Microsoft Universal Print
1 -
Middleware Solutions
1 -
Migration
5 -
ML Model Development
1 -
MLFlow
1 -
Modeling in SAP HANA Cloud
9 -
Monitoring
3 -
MPL
1 -
MTA
1 -
Multi-factor-authentication
1 -
Multi-Record Scenarios
1 -
Multilayer Perceptron
1 -
Multiple Event Triggers
1 -
Myself Transformation
1 -
Neo
1 -
Neural Networks
1 -
New Event Creation
1 -
New Feature
1 -
Newcomer
1 -
NodeJS
3 -
ODATA
2 -
OData APIs
1 -
odatav2
1 -
ODATAV4
1 -
ODBC
1 -
ODBC Connection
1 -
Onpremise
1 -
open source
2 -
OpenAI API
1 -
Oracle
1 -
PaPM
1 -
PaPM Dynamic Data Copy through Writer function
1 -
PaPM Remote Call
1 -
Partner Built Foundation Model
1 -
PAS-C01
1 -
Pay Component Management
1 -
PGP
1 -
Pickle
1 -
PLANNING ARCHITECTURE
1 -
Popup in Sap analytical cloud
1 -
PostgrSQL
1 -
POSTMAN
1 -
Prettier
1 -
Process Automation
2 -
Product Updates
6 -
PSM
1 -
Public Cloud
1 -
Python
5 -
python library - Document information extraction service
1 -
Qlik
1 -
Qualtrics
1 -
RAP
3 -
RAP BO
2 -
React
1 -
Record Deletion
1 -
Recovery
1 -
recurring payments
1 -
redeply
1 -
Release
1 -
Remote Consumption Model
1 -
Replication Flows
1 -
report painter
1 -
research
1 -
Resilience
1 -
REST
1 -
REST API
1 -
Retagging Required
1 -
Risk
1 -
rolandkramer
2 -
Rolling Kernel Switch
1 -
route
1 -
rules
1 -
S4 HANA
1 -
S4 HANA Cloud
1 -
S4 HANA On-Premise
1 -
S4HANA
4 -
S4HANA Cloud
1 -
S4HANA_OP_2023
2 -
SAC
11 -
SAC PLANNING
10 -
SAP
4 -
SAP ABAP
1 -
SAP Advanced Event Mesh
1 -
SAP AI Core
10 -
SAP AI Launchpad
9 -
SAP Analytic Cloud
1 -
SAP Analytic Cloud Compass
1 -
Sap Analytical Cloud
1 -
SAP Analytics Cloud
5 -
SAP Analytics Cloud for Consolidation
3 -
SAP Analytics cloud planning
1 -
SAP Analytics Cloud Story
1 -
SAP analytics clouds
1 -
SAP API Management
1 -
SAP Application Logging Service
1 -
SAP BAS
1 -
SAP Basis
6 -
SAP BO FC migration
1 -
SAP BODS
1 -
SAP BODS certification.
1 -
SAP BODS migration
1 -
SAP BPC migration
1 -
SAP BTP
25 -
SAP BTP Build Work Zone
2 -
SAP BTP Cloud Foundry
8 -
SAP BTP Costing
1 -
SAP BTP CTMS
1 -
SAP BTP Generative AI
1 -
SAP BTP Innovation
1 -
SAP BTP Migration Tool
1 -
SAP BTP SDK IOS
1 -
SAP BTPEA
1 -
SAP Build
12 -
SAP Build App
1 -
SAP Build apps
1 -
SAP Build CodeJam
1 -
SAP Build Process Automation
3 -
SAP Build work zone
11 -
SAP Business Objects Platform
1 -
SAP Business Technology
2 -
SAP Business Technology Platform (XP)
1 -
sap bw
1 -
SAP CAP
2 -
SAP CDC
1 -
SAP CDP
1 -
SAP CDS VIEW
1 -
SAP Certification
1 -
SAP Cloud ALM
4 -
SAP Cloud Application Programming Model
1 -
SAP Cloud Integration
1 -
SAP Cloud Integration for Data Services
1 -
SAP cloud platform
9 -
SAP Companion
1 -
SAP CPI
3 -
SAP CPI (Cloud Platform Integration)
2 -
SAP CPI Discover tab
1 -
sap credential store
1 -
SAP Customer Data Cloud
1 -
SAP Customer Data Platform
1 -
SAP Data Intelligence
1 -
SAP Data Migration in Retail Industry
1 -
SAP Data Services
1 -
SAP DATABASE
1 -
SAP Dataspher to Non SAP BI tools
1 -
SAP Datasphere
9 -
SAP DRC
1 -
SAP EWM
1 -
SAP Fiori
3 -
SAP Fiori App Embedding
1 -
Sap Fiori Extension Project Using BAS
1 -
SAP GRC
1 -
SAP HANA
1 -
SAP HANA PAL
1 -
SAP HANA Vector
1 -
SAP HCM (Human Capital Management)
1 -
SAP HR Solutions
1 -
SAP IDM
1 -
SAP Integration Suite
10 -
SAP Integrations
4 -
SAP iRPA
2 -
SAP LAGGING AND SLOW
1 -
SAP Learning Class
1 -
SAP Learning Hub
1 -
SAP Master Data
1 -
SAP Odata
2 -
SAP on Azure
2 -
SAP PAL
1 -
SAP PartnerEdge
1 -
sap partners
1 -
SAP Password Reset
1 -
SAP PO Migration
1 -
SAP Prepackaged Content
1 -
sap print
1 -
SAP Process Automation
2 -
SAP Process Integration
2 -
SAP Process Orchestration
1 -
SAP Router
1 -
SAP S4HANA
2 -
SAP S4HANA Cloud
2 -
SAP S4HANA Cloud for Finance
1 -
SAP S4HANA Cloud private edition
1 -
SAP Sandbox
1 -
SAP STMS
1 -
SAP successfactors
3 -
SAP SuccessFactors HXM Core
1 -
SAP Time
1 -
SAP TM
2 -
SAP Trading Partner Management
1 -
SAP UI5
1 -
SAP Upgrade
1 -
SAP Utilities
1 -
SAP-GUI
9 -
SAP_COM_0276
1 -
SAPBTP
1 -
SAPCPI
1 -
SAPEWM
1 -
sapfirstguidance
3 -
SAPHANAService
1 -
SAPIQ
2 -
sapmentors
1 -
saponaws
2 -
saprouter
1 -
SAPRouter installation
1 -
SAPS4HANA
1 -
SAPUI5
5 -
schedule
1 -
Script Operator
1 -
Secure Login Client Setup
9 -
security
10 -
Selenium Testing
1 -
Self Transformation
1 -
Self-Transformation
1 -
SEN
1 -
SEN Manager
1 -
Sender
1 -
service
2 -
SET_CELL_TYPE
1 -
SET_CELL_TYPE_COLUMN
1 -
SFTP scenario
2 -
Simplex
1 -
Single Sign On
9 -
Singlesource
1 -
SKLearn
1 -
Slow loading
1 -
SOAP
2 -
Software Development
1 -
SOLMAN
1 -
solman 7.2
2 -
Solution Manager
3 -
sp_dumpdb
1 -
sp_dumptrans
1 -
SQL
1 -
sql script
1 -
SSL
9 -
SSO
9 -
Story2
1 -
Substring function
1 -
SuccessFactors
1 -
SuccessFactors Platform
1 -
SuccessFactors Time Tracking
1 -
Sybase
1 -
Synthetic User Monitoring
1 -
system copy method
1 -
System owner
1 -
Table splitting
1 -
Tax Integration
1 -
Technical article
1 -
Technical articles
1 -
Technology Updates
15 -
Technology Updates
1 -
Technology_Updates
1 -
terraform
1 -
Testing
1 -
Threats
2 -
Time Collectors
1 -
Time Off
2 -
Time Sheet
1 -
Time Sheet SAP SuccessFactors Time Tracking
1 -
Tips and tricks
2 -
toggle button
1 -
Tools
1 -
Trainings & Certifications
1 -
Transformation Flow
1 -
Transport in SAP BODS
1 -
Transport Management
1 -
TypeScript
3 -
ui designer
1 -
unbind
1 -
Unified Customer Profile
1 -
UPB
1 -
Use of Parameters for Data Copy in PaPM
1 -
User Unlock
1 -
VA02
1 -
Validations
1 -
Vector Database
2 -
Vector Engine
1 -
Vectorization
1 -
Visual Studio Code
1 -
VSCode
2 -
VSCode extenions
1 -
Vulnerabilities
1 -
Web SDK
1 -
Webhook
1 -
work zone
1 -
workload
1 -
xsa
1 -
XSA Refresh
1
- « Previous
- Next »
Related Content
- Analytical queries in BTP ABAP in Technology Q&A
- spring based odata deployment error in BTP cloud foundry with security configuration in Technology Q&A
- SAP BTP FAQs - Part 2 (Application Development, Programming Models and Multitenancy) in Technology Blogs by SAP
- Question about sap fiori elements list report using odata v2 and odata v4 in Technology Q&A
- Help Needed to Resolve Visual Filter Configuration Issue in SAP Fiori Elements ALP in Technology Q&A
Top kudoed authors
| User | Count |
|---|---|
| 53 | |
| 5 | |
| 4 | |
| 4 | |
| 4 | |
| 4 | |
| 3 | |
| 3 | |
| 3 | |
| 3 |