
- SAP Community
- Products and Technology
- Technology
- Technology Blogs by Members
- TechWomen Emerging Leader Countries visualised usi...
Technology Blogs by Members
Explore a vibrant mix of technical expertise, industry insights, and tech buzz in member blogs covering SAP products, technology, and events. Get in the mix!
Turn on suggestions
Auto-suggest helps you quickly narrow down your search results by suggesting possible matches as you type.
Showing results for
Former Member
Options
- Subscribe to RSS Feed
- Mark as New
- Mark as Read
- Bookmark
- Subscribe
- Printer Friendly Page
- Report Inappropriate Content
06-27-2013
7:28 AM
“If we’re going to out-innovate and out-educate the rest of the world, we’ve got to open doors for everyone. We need all hands on deck, and that means clearing hurdles for women and girls as they navigate careers in science, technology, engineering, and math.”
-- First Lady Michelle Obama, September 26, 2011
Improving the participation of women in the Science Technology Engineering and Mathematics(STEM) sectors is a focus area for most governments all over the world. There is unfortunately still the cultural belief that STEM sectors are male domains which acts as a barrier to girls’ and women’s participation in these fields. A recent article by Wendy Tan White, confirms that even in the Tech Industry, girls still view the sector as 'Geeky and not for girls'.
The question of what practical steps need to be taken to bring about this improvement still remains to be answered by many. One of the ways we as young women can play a role is through sharing our experiences (in an appealing and fun manner) and encouraging other young women to take up STEM careers as it truly offers diverse career opportunities.
I was blessed this year to have been selected as an Emerging Leader for the TechWomen programme. TechWomen is an initiative of the U.S. Department of Bureau of Educational and Cultural Affairs. I believe that my selection came as a direct result of my involvement in the SAP Community, specifically the SAP Mentors Programme! The TechWomen Programme was developed in response to President Obama’s efforts to strengthen relations between the United States and the Middle East and Africa. Former Secretary of State Hillary Rodham Clinton first announced the TechWomen initiative on April 28, 2010 during President Obama’s Entrepreneurship Summit. This programme empowers, connects, and supports the next generation of women leaders in science, technology, engineering, and mathematics (STEM) from Africa and the Middle East by providing them the access and opportunity needed to advance their careers, pursue their dreams, and inspire women and girls in their communities. From the 1st of October, the Emerging Leaders will spend 5 weeks in San Fransisco and Washington. For more info on the Programme visit the TechWomen website.
The program selected 78 women from 16 countries. See the graphic below.

I’m a visual person so I wanted to see what 16 countries were represented by fellow Emerging Leaders. What better way to represent this data than using SAP Lumira as I had recently installed the personal edition of SAP Lumira (which I bought when during the #BI2013 special…sorry if you missed it…thanks james.fisher for the heads up!).I decided to extract this data from the contact list that Lexi Curtice(TechWomen Program Coordinator) posted on the Techwomen Facebook group. The document was in PDF and I used the text import functionality to paste it into Excel. I obviously had to filter out some of the info, i.e. the leaders names and contact details.
I then imported this data into SAP Lumira as an MS Excel datasource.
When I looked at the imported data, I could see that some of the member countries’ names were cut off, i.e. Palestinian Territories, Sierra Leone, South Africa.
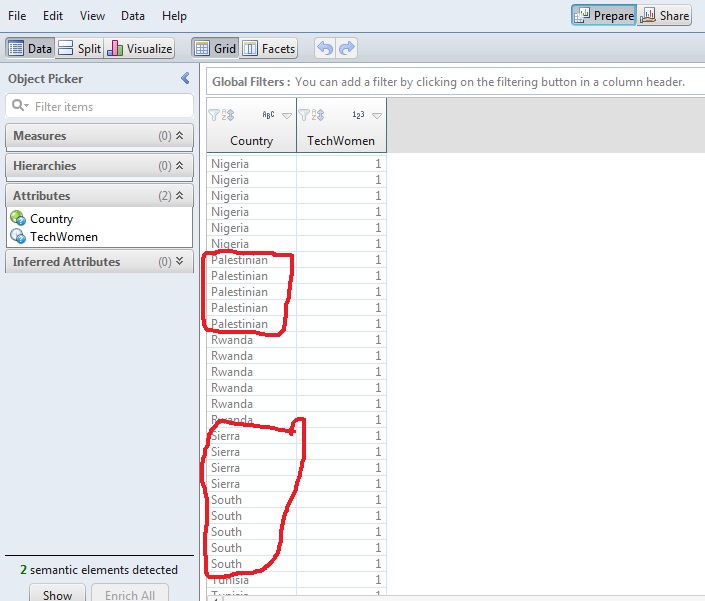
I had heard of the data cleansing/manipulation capabilities of the tool…but where do I find this?
I remembered this from one of tammy.powlas' blogpost. I found quite a few nifty manipulation options, i.e. splitting a column, converting the text lower case. I found the “Find and Replace” option, which is what I needed. I could now replace the three member country names to the correct ones.
 I was now ready for the exciting part, deciding which visualisation option to use! I first had to set my count column as a measure by right-clicking on the column name (in the Attributes) and selecting “Create a Measure”. I selected Tag Cloud from the visualisation option. I could now see the list of countries.
 The next option is the Heat Map.

Another really cool chart that I played around with is the Radar Chart.

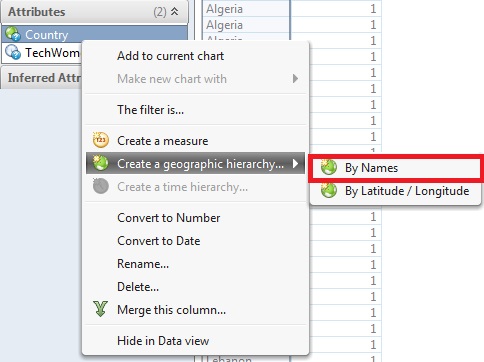
The last chart that I explored is the Geographic Bubble Chart. I used the Country Attribute hoping that I could just right click and create a geographic hierarchy by Names (seemed easy enough)This seemed to work for only 15 of the 16 countries, there was one country that remained unresolved.
This meant that I was now forced to use Latitude/Longitude option. I had never used this option before and felt I needed to find instructions. I managed to find the official tutorials. I used the Enhancing GeoMaps with Latitude Longitude tutorial(lasted 2min.36sec). I found a listing of the longitude and latitude values from this website. I change my initial datasource(my MS Excel Spreadsheet) to include these two columns, for longitude and latitude. I was a bit concerned about whether I would need to redo all my charts, but was glad to see that the system was intuitive enough to pick up my new columns. I went to the Data option on the toolbar > Clicked on Edit Datasource. The two columns appeared (deselected/greyed out) I selected them and my datasources was now updated….BEAUTY :cool:

I could see my two new columns have been added to the Attributes and I could create the geographic hierarchy by Latitude/Longitude. I then dragged in the measure, including the country from the CustomGeo hierarchy into the dimensions. The Bubbles appeared, but with no labels. I selected the labels from the drop down(right next to global filters)
I really had fun creating the various visualisations and an hour I had all my samples. The part that took the longest was capturing screenshots and documenting all my steps. If you are someone who loves visualising data, give SAP Lumira a try! (Contrary to popular belief, I don’t work for SAP…so I have no sales interests here!)It fortunately has a FREE Personal Edition that you can test drive...YES, you that's right, it's FREE!
I did try to replicate my steps in the SAP Lumira Cloud version but was disappointed in getting a blank screen when trying to import my data. Perhaps I’m doing something wrong or it might be my old Windows laptop…I will investigate and write another blogpost regarding this. Once I can upload my dataset onto LumiraCloud, I'll definitely create a follow up blog post on how I can view this visualisation on an iPad using Mobile BI ver5..(check out andrew.fox's blogpost )
I was quite impressed with the geographical bubble chart and I sent it to the rest of the TechWomen Emerging Leaders and I received some really great feedback.

I can honestly say that from interacting with this amazing group of women I have no doubt that San Fransisco will be electrified when all 78 of us arrive in October! Watch this space for more blog posts to come regarding the TechWomen Programme. Women in Tech Rock-On!!!!
- SAP Managed Tags:
- SAP Lumira
19 Comments
You must be a registered user to add a comment. If you've already registered, sign in. Otherwise, register and sign in.
Labels in this area
-
"automatische backups"
1 -
"regelmäßige sicherung"
1 -
"TypeScript" "Development" "FeedBack"
1 -
505 Technology Updates 53
1 -
ABAP
14 -
ABAP API
1 -
ABAP CDS Views
2 -
ABAP CDS Views - BW Extraction
1 -
ABAP CDS Views - CDC (Change Data Capture)
1 -
ABAP class
2 -
ABAP Cloud
3 -
ABAP Development
5 -
ABAP in Eclipse
1 -
ABAP Platform Trial
1 -
ABAP Programming
2 -
abap technical
1 -
abapGit
1 -
absl
2 -
access data from SAP Datasphere directly from Snowflake
1 -
Access data from SAP datasphere to Qliksense
1 -
Accrual
1 -
action
1 -
adapter modules
1 -
Addon
1 -
Adobe Document Services
1 -
ADS
1 -
ADS Config
1 -
ADS with ABAP
1 -
ADS with Java
1 -
ADT
2 -
Advance Shipping and Receiving
1 -
Advanced Event Mesh
3 -
Advanced formula
1 -
AEM
1 -
AI
8 -
AI Launchpad
1 -
AI Projects
1 -
AIML
9 -
Alert in Sap analytical cloud
1 -
Amazon S3
1 -
Analytical Dataset
1 -
Analytical Model
1 -
Analytics
1 -
Analyze Workload Data
1 -
annotations
1 -
API
1 -
API and Integration
3 -
API Call
2 -
API security
1 -
Application Architecture
1 -
Application Development
5 -
Application Development for SAP HANA Cloud
3 -
Applications and Business Processes (AP)
1 -
Artificial Intelligence
1 -
Artificial Intelligence (AI)
5 -
Artificial Intelligence (AI) 1 Business Trends 363 Business Trends 8 Digital Transformation with Cloud ERP (DT) 1 Event Information 462 Event Information 15 Expert Insights 114 Expert Insights 76 Life at SAP 418 Life at SAP 1 Product Updates 4
1 -
Artificial Intelligence (AI) blockchain Data & Analytics
1 -
Artificial Intelligence (AI) blockchain Data & Analytics Intelligent Enterprise
1 -
Artificial Intelligence (AI) blockchain Data & Analytics Intelligent Enterprise Oil Gas IoT Exploration Production
1 -
Artificial Intelligence (AI) blockchain Data & Analytics Intelligent Enterprise sustainability responsibility esg social compliance cybersecurity risk
1 -
ASE
1 -
ASR
2 -
ASUG
1 -
Attachments
1 -
Authorisations
1 -
Automating Processes
1 -
Automation
2 -
aws
2 -
Azure
1 -
Azure AI Studio
1 -
Azure API Center
1 -
Azure API Management
1 -
B2B Integration
1 -
Backorder Processing
1 -
Backpropagation
1 -
Backup
1 -
Backup and Recovery
1 -
Backup schedule
1 -
BADI_MATERIAL_CHECK error message
1 -
Bank
1 -
Bank Communication Management
1 -
BAS
1 -
basis
2 -
Basis Monitoring & Tcodes with Key notes
2 -
Batch Management
1 -
BDC
1 -
Best Practice
1 -
bitcoin
1 -
Blockchain
3 -
bodl
1 -
BOP in aATP
1 -
BOP Segments
1 -
BOP Strategies
1 -
BOP Variant
1 -
BPC
1 -
BPC LIVE
1 -
BTP
13 -
BTP AI Launchpad
1 -
BTP Destination
2 -
Business AI
1 -
Business and IT Integration
1 -
Business application stu
1 -
Business Application Studio
1 -
Business Architecture
1 -
Business Communication Services
1 -
Business Continuity
2 -
Business Data Fabric
3 -
Business Fabric
1 -
Business Partner
12 -
Business Partner Master Data
10 -
Business Technology Platform
2 -
Business Trends
4 -
BW4HANA
1 -
CA
1 -
calculation view
1 -
CAP
4 -
Capgemini
1 -
CAPM
1 -
Catalyst for Efficiency: Revolutionizing SAP Integration Suite with Artificial Intelligence (AI) and
1 -
CCMS
2 -
CDQ
12 -
CDS
2 -
Cental Finance
1 -
Certificates
1 -
CFL
1 -
Change Management
1 -
chatbot
1 -
chatgpt
3 -
CL_SALV_TABLE
2 -
Class Runner
1 -
Classrunner
1 -
Cloud ALM Monitoring
1 -
Cloud ALM Operations
1 -
cloud connector
1 -
Cloud Extensibility
1 -
Cloud Foundry
4 -
Cloud Integration
6 -
Cloud Platform Integration
2 -
cloudalm
1 -
communication
1 -
Compensation Information Management
1 -
Compensation Management
1 -
Compliance
1 -
Compound Employee API
1 -
Configuration
1 -
Connectors
1 -
Consolidation Extension for SAP Analytics Cloud
2 -
Control Indicators.
1 -
Controller-Service-Repository pattern
1 -
Conversion
1 -
Cosine similarity
1 -
cryptocurrency
1 -
CSI
1 -
ctms
1 -
Custom chatbot
3 -
Custom Destination Service
1 -
custom fields
1 -
Customer Experience
1 -
Customer Journey
1 -
Customizing
1 -
cyber security
4 -
cybersecurity
1 -
Data
1 -
Data & Analytics
1 -
Data Aging
1 -
Data Analytics
2 -
Data and Analytics (DA)
1 -
Data Archiving
1 -
Data Back-up
1 -
Data Flow
1 -
Data Governance
5 -
Data Integration
2 -
Data Quality
12 -
Data Quality Management
12 -
Data Synchronization
1 -
data transfer
1 -
Data Unleashed
1 -
Data Value
8 -
database tables
1 -
Dataframe
1 -
Datasphere
3 -
datenbanksicherung
1 -
dba cockpit
1 -
dbacockpit
1 -
Debugging
2 -
Defender
1 -
Delimiting Pay Components
1 -
Delta Integrations
1 -
Destination
3 -
Destination Service
1 -
Developer extensibility
1 -
Developing with SAP Integration Suite
1 -
Devops
1 -
digital transformation
1 -
Disaster Recovery
1 -
Documentation
1 -
Dot Product
1 -
DQM
1 -
dump database
1 -
dump transaction
1 -
e-Invoice
1 -
E4H Conversion
1 -
Eclipse ADT ABAP Development Tools
2 -
edoc
1 -
edocument
1 -
ELA
1 -
Embedded Consolidation
1 -
Embedding
1 -
Embeddings
1 -
Employee Central
1 -
Employee Central Payroll
1 -
Employee Central Time Off
1 -
Employee Information
1 -
Employee Rehires
1 -
Enable Now
1 -
Enable now manager
1 -
endpoint
1 -
Enhancement Request
1 -
Enterprise Architecture
1 -
ESLint
1 -
ETL Business Analytics with SAP Signavio
1 -
Euclidean distance
1 -
Event Dates
1 -
Event Driven Architecture
1 -
Event Mesh
2 -
Event Reason
1 -
EventBasedIntegration
1 -
EWM
1 -
EWM Outbound configuration
1 -
EWM-TM-Integration
1 -
Existing Event Changes
1 -
Expand
1 -
Expert
2 -
Expert Insights
2 -
Exploits
1 -
Fiori
15 -
Fiori Elements
2 -
Fiori SAPUI5
12 -
first-guidance
1 -
Flask
1 -
FTC
1 -
Full Stack
8 -
Funds Management
1 -
gCTS
1 -
GenAI hub
1 -
General
2 -
Generative AI
1 -
Getting Started
1 -
GitHub
9 -
Google cloud
1 -
Grants Management
1 -
groovy
1 -
GTP
1 -
HANA
6 -
HANA Cloud
2 -
Hana Cloud Database Integration
2 -
HANA DB
2 -
Hana Vector Engine
1 -
HANA XS Advanced
1 -
Historical Events
1 -
home labs
1 -
HowTo
1 -
HR Data Management
1 -
html5
8 -
HTML5 Application
1 -
Identity cards validation
1 -
idm
1 -
Implementation
1 -
Infuse AI
1 -
input parameter
1 -
instant payments
1 -
Integration
3 -
Integration Advisor
1 -
Integration Architecture
1 -
Integration Center
1 -
Integration Suite
1 -
intelligent enterprise
1 -
iot
1 -
Java
1 -
job
1 -
Job Information Changes
1 -
Job-Related Events
1 -
Job_Event_Information
1 -
joule
4 -
Journal Entries
1 -
Just Ask
1 -
Kerberos for ABAP
8 -
Kerberos for JAVA
8 -
KNN
1 -
Launch Wizard
1 -
Learning Content
2 -
Life at SAP
5 -
lightning
1 -
Linear Regression SAP HANA Cloud
1 -
Loading Indicator
1 -
local tax regulations
1 -
LP
1 -
Machine Learning
4 -
Marketing
1 -
Master Data
3 -
Master Data Management
14 -
Maxdb
2 -
MDG
1 -
MDGM
1 -
MDM
1 -
Message box.
1 -
Messages on RF Device
1 -
Microservices Architecture
1 -
Microsoft Universal Print
1 -
Middleware Solutions
1 -
Migration
5 -
ML Model Development
1 -
Modeling in SAP HANA Cloud
8 -
Monitoring
3 -
MTA
1 -
Multi-Record Scenarios
1 -
Multilayer Perceptron
1 -
Multiple Event Triggers
1 -
Myself Transformation
1 -
Neo
1 -
Neural Networks
1 -
New Event Creation
1 -
New Feature
1 -
Newcomer
1 -
NodeJS
3 -
ODATA
2 -
OData APIs
1 -
odatav2
1 -
ODATAV4
1 -
ODBC
1 -
ODBC Connection
1 -
Onpremise
1 -
open source
2 -
OpenAI API
1 -
Oracle
1 -
PaPM
1 -
PaPM Dynamic Data Copy through Writer function
1 -
PaPM Remote Call
1 -
Partner Built Foundation Model
1 -
PAS-C01
1 -
Pay Component Management
1 -
PGP
1 -
Pickle
1 -
PLANNING ARCHITECTURE
1 -
Popup in Sap analytical cloud
1 -
PostgrSQL
1 -
POSTMAN
1 -
Prettier
1 -
Process Automation
2 -
Product Updates
6 -
PSM
1 -
Public Cloud
1 -
Python
4 -
python library - Document information extraction service
1 -
Qlik
1 -
Qualtrics
1 -
RAP
3 -
RAP BO
2 -
Record Deletion
1 -
Recovery
1 -
recurring payments
1 -
redeply
1 -
Release
1 -
Remote Consumption Model
1 -
Replication Flows
1 -
research
1 -
Resilience
1 -
REST
1 -
REST API
1 -
Retagging Required
1 -
Risk
1 -
rolandkramer
1 -
Rolling Kernel Switch
1 -
route
1 -
rules
1 -
S4 HANA
1 -
S4 HANA Cloud
1 -
S4 HANA On-Premise
1 -
S4HANA
4 -
S4HANA Cloud
1 -
S4HANA_OP_2023
2 -
SAC
10 -
SAC PLANNING
9 -
SAP
4 -
SAP ABAP
1 -
SAP Advanced Event Mesh
1 -
SAP AI Core
9 -
SAP AI Launchpad
8 -
SAP Analytic Cloud Compass
1 -
Sap Analytical Cloud
1 -
SAP Analytics Cloud
4 -
SAP Analytics Cloud for Consolidation
3 -
SAP Analytics Cloud Story
1 -
SAP analytics clouds
1 -
SAP API Management
1 -
SAP BAS
1 -
SAP Basis
6 -
SAP BODS
1 -
SAP BODS certification.
1 -
SAP BTP
22 -
SAP BTP Build Work Zone
2 -
SAP BTP Cloud Foundry
6 -
SAP BTP Costing
1 -
SAP BTP CTMS
1 -
SAP BTP Generative AI
1 -
SAP BTP Innovation
1 -
SAP BTP Migration Tool
1 -
SAP BTP SDK IOS
1 -
SAP BTPEA
1 -
SAP Build
11 -
SAP Build App
1 -
SAP Build apps
1 -
SAP Build CodeJam
1 -
SAP Build Process Automation
3 -
SAP Build work zone
10 -
SAP Business Objects Platform
1 -
SAP Business Technology
2 -
SAP Business Technology Platform (XP)
1 -
sap bw
1 -
SAP CAP
2 -
SAP CDC
1 -
SAP CDP
1 -
SAP CDS VIEW
1 -
SAP Certification
1 -
SAP Cloud ALM
4 -
SAP Cloud Application Programming Model
1 -
SAP Cloud Integration for Data Services
1 -
SAP cloud platform
8 -
SAP Companion
1 -
SAP CPI
3 -
SAP CPI (Cloud Platform Integration)
2 -
SAP CPI Discover tab
1 -
sap credential store
1 -
SAP Customer Data Cloud
1 -
SAP Customer Data Platform
1 -
SAP Data Intelligence
1 -
SAP Data Migration in Retail Industry
1 -
SAP Data Services
1 -
SAP DATABASE
1 -
SAP Dataspher to Non SAP BI tools
1 -
SAP Datasphere
9 -
SAP DRC
1 -
SAP EWM
1 -
SAP Fiori
3 -
SAP Fiori App Embedding
1 -
Sap Fiori Extension Project Using BAS
1 -
SAP GRC
1 -
SAP HANA
1 -
SAP HANA PAL
1 -
SAP HANA Vector
1 -
SAP HCM (Human Capital Management)
1 -
SAP HR Solutions
1 -
SAP IDM
1 -
SAP Integration Suite
9 -
SAP Integrations
4 -
SAP iRPA
2 -
SAP LAGGING AND SLOW
1 -
SAP Learning Class
1 -
SAP Learning Hub
1 -
SAP Master Data
1 -
SAP Odata
2 -
SAP on Azure
2 -
SAP PAL
1 -
SAP PartnerEdge
1 -
sap partners
1 -
SAP Password Reset
1 -
SAP PO Migration
1 -
SAP Prepackaged Content
1 -
SAP Process Automation
2 -
SAP Process Integration
2 -
SAP Process Orchestration
1 -
SAP Router
1 -
SAP S4HANA
2 -
SAP S4HANA Cloud
1 -
SAP S4HANA Cloud for Finance
1 -
SAP S4HANA Cloud private edition
1 -
SAP Sandbox
1 -
SAP STMS
1 -
SAP successfactors
3 -
SAP SuccessFactors HXM Core
1 -
SAP Time
1 -
SAP TM
2 -
SAP Trading Partner Management
1 -
SAP UI5
1 -
SAP Upgrade
1 -
SAP Utilities
1 -
SAP-GUI
8 -
SAP_COM_0276
1 -
SAPBTP
1 -
SAPCPI
1 -
SAPEWM
1 -
sapfirstguidance
2 -
SAPHANAService
1 -
SAPIQ
1 -
sapmentors
1 -
saponaws
2 -
saprouter
1 -
SAPRouter installation
1 -
SAPS4HANA
1 -
SAPUI5
5 -
schedule
1 -
Script Operator
1 -
Secure Login Client Setup
8 -
security
9 -
Selenium Testing
1 -
Self Transformation
1 -
Self-Transformation
1 -
SEN
1 -
SEN Manager
1 -
service
1 -
SET_CELL_TYPE
1 -
SET_CELL_TYPE_COLUMN
1 -
SFTP scenario
2 -
Simplex
1 -
Single Sign On
8 -
Singlesource
1 -
SKLearn
1 -
Slow loading
1 -
soap
1 -
Software Development
1 -
SOLMAN
1 -
solman 7.2
2 -
Solution Manager
3 -
sp_dumpdb
1 -
sp_dumptrans
1 -
SQL
1 -
sql script
1 -
SSL
8 -
SSO
8 -
Substring function
1 -
SuccessFactors
1 -
SuccessFactors Platform
1 -
SuccessFactors Time Tracking
1 -
Sybase
1 -
system copy method
1 -
System owner
1 -
Table splitting
1 -
Tax Integration
1 -
Technical article
1 -
Technical articles
1 -
Technology Updates
15 -
Technology Updates
1 -
Technology_Updates
1 -
terraform
1 -
Threats
2 -
Time Collectors
1 -
Time Off
2 -
Time Sheet
1 -
Time Sheet SAP SuccessFactors Time Tracking
1 -
Tips and tricks
2 -
toggle button
1 -
Tools
1 -
Trainings & Certifications
1 -
Transformation Flow
1 -
Transport in SAP BODS
1 -
Transport Management
1 -
TypeScript
3 -
ui designer
1 -
unbind
1 -
Unified Customer Profile
1 -
UPB
1 -
Use of Parameters for Data Copy in PaPM
1 -
User Unlock
1 -
VA02
1 -
Validations
1 -
Vector Database
2 -
Vector Engine
1 -
Vectorization
1 -
Visual Studio Code
1 -
VSCode
2 -
VSCode extenions
1 -
Vulnerabilities
1 -
Web SDK
1 -
work zone
1 -
workload
1 -
xsa
1 -
XSA Refresh
1
- « Previous
- Next »
Top kudoed authors
| User | Count |
|---|---|
| 6 | |
| 5 | |
| 4 | |
| 4 | |
| 4 | |
| 3 | |
| 3 | |
| 3 | |
| 2 | |
| 2 |