
- SAP Community
- Products and Technology
- Technology
- Technology Blogs by SAP
- Anybody can do data science with SAP Analytics Clo...
Technology Blogs by SAP
Learn how to extend and personalize SAP applications. Follow the SAP technology blog for insights into SAP BTP, ABAP, SAP Analytics Cloud, SAP HANA, and more.
Turn on suggestions
Auto-suggest helps you quickly narrow down your search results by suggesting possible matches as you type.
Showing results for
Advisor
Options
- Subscribe to RSS Feed
- Mark as New
- Mark as Read
- Bookmark
- Subscribe
- Printer Friendly Page
- Report Inappropriate Content
02-11-2020
11:24 AM
This blog post is the first in an ongoing series of blog posts on “Anybody can do data science – with SAP Analytics Cloud”.
My statistics professor once told me, that if you torture data long enough it will confess to anything. In this blog post, I will attempt to bring “science” into this interrogation room and explain these confessions from the perspective of data science. Our tool of choice for the interrogation will be SAP Analytics Cloud’s Smart Predict. My hope is to rouse your curiosity and inspire you to start using Smart Predict to answer your own questions.
Have you ever stared at that bottle of wine on shelf and wondered how likely you are to enjoy it? Well, I have. I am not a connoisseur or a wine geek. Which is probably all the more why, I have often wondered if I could just plug some numbers into a model, and try to understand if I would like the wine or not.
As it turns out, I am not the only one to have pondered over this profoundly unsettling question. Researchers from the University of Minho in Portugal proposed the use of data mining approaches to predict human wine taste preferences, based on easily available analytical tests. Fortunately for us, this data set is publicly available and is referenced at the bottom of this page.
So how do you teach a machine to predict how likely you are to enjoy your wine? Machines, like humans, can learn from experience, that is of course if their experience is long enough. You give the machine a big enough data set with attributes of the wine like residual sugar, alcohol, acidity, pH, etc. You also point out to the machine whether these wines were considered excellent or poor (on a scale of 0 to 10). The machine then goes around crawling through the numbers to identify a pattern. It could of course, crawl around in different ways. Each “way” would result in a different “model”.
Now a connoisseur may point out that technical data may not define quality of wine, how it feels when it rolls around your tongue and all that jazz. Yet, it can still help you understand a particular wine, especially when comparing different vintages. With that argument out of way, let us launch straight into our interrogation room!
So what are the terms we will encounter during the interrogation? Let us understand some terms, so we can ask the right questions.

 .
. 


 .
. 

 .
.  .
.  .
.
 .
. 
 .
. 


 .
. 

Follow on to Part 2 of this blog post to understand the results and how to apply the model to get predictions!
My statistics professor once told me, that if you torture data long enough it will confess to anything. In this blog post, I will attempt to bring “science” into this interrogation room and explain these confessions from the perspective of data science. Our tool of choice for the interrogation will be SAP Analytics Cloud’s Smart Predict. My hope is to rouse your curiosity and inspire you to start using Smart Predict to answer your own questions.
Part 1: Will I enjoy this wine?
Have you ever stared at that bottle of wine on shelf and wondered how likely you are to enjoy it? Well, I have. I am not a connoisseur or a wine geek. Which is probably all the more why, I have often wondered if I could just plug some numbers into a model, and try to understand if I would like the wine or not.
As it turns out, I am not the only one to have pondered over this profoundly unsettling question. Researchers from the University of Minho in Portugal proposed the use of data mining approaches to predict human wine taste preferences, based on easily available analytical tests. Fortunately for us, this data set is publicly available and is referenced at the bottom of this page.
So how do you teach a machine to predict how likely you are to enjoy your wine? Machines, like humans, can learn from experience, that is of course if their experience is long enough. You give the machine a big enough data set with attributes of the wine like residual sugar, alcohol, acidity, pH, etc. You also point out to the machine whether these wines were considered excellent or poor (on a scale of 0 to 10). The machine then goes around crawling through the numbers to identify a pattern. It could of course, crawl around in different ways. Each “way” would result in a different “model”.
Now a connoisseur may point out that technical data may not define quality of wine, how it feels when it rolls around your tongue and all that jazz. Yet, it can still help you understand a particular wine, especially when comparing different vintages. With that argument out of way, let us launch straight into our interrogation room!
Understanding the wine tech sheets
So what are the terms we will encounter during the interrogation? Let us understand some terms, so we can ask the right questions.
- Acidity: The acidity level tells us the concentration of acids present in wine. 2 g/l is very low acidity and the wine will taste flat and 10 g/l is high and very sour. Typically wines range between 4 and 8.
- pH: The pH level tells us how intense the acids taste. The relationship is inverse so the lower the pH number, the more intense the acids present in the wine will taste. The number is logarithmic, so a pH of 3 has 10 times more acidity than a pH of 4.
- Alcohol: This is the percentage of alcohol in wine. Most wines range from 10–15% alcohol although there are several specialty wines, such as Moscato d’Asti (very low) or Port (very high), at the extremities.
- Residual Sugar: This is the measure of sweetness in wine. Typically, wines with less than 10 g/L are considered dry. Many dry wines have none at all.
Teaching the machine to “learn”
- Loading the data: We have two datasets. These datasets correspond to red and white vinho Verde wine, which comes from the north of Portugal. We have 1599 red wines and 4898 white wines. We also have a bunch of descriptive attributes for each of these wines (like alcohol, acidity, sugar, etc.). To begin, we will load the data into SAC.
- Training the model: Along with the attributes that describe a wine, we have an indicator to its popularity in the column “quality”. We will train the machine to accept input variables (like alcohol, acidity, sugar, etc.) and identify patterns that correlate them to the output variable (quality). SAC will identify the model that is best at finding these patterns. You can think of this as a horse race between the models. The model that is right more often wins.
- Understanding the results: SAC will evaluate the quality of the model results and help you decide if the model is good. If you find the results convincing, you can move on to Step 4, the last step!
- Applying the model: Once trained, if we give the model attributes of a wine it has never encountered before, it should be able to “predict” what the quality of this new wine is, based on its learnings with the wines it trained with. Yes, sounds a lot like stereotyping, doesn’t it! Indeed, much of machine learning is objective, data driven stereotyping.
Step 1. Loading the data
- Before we load the dataset into SAC, we cut out a few records from the original dataset. We will use this to apply our model later (#3 above). I cut out 5 wines from the dataset for red and white wines, each to use later. I now have 4 datasets –
- 1594 red wines for training
- 5 red wines for prediction
- 4893 white wines for training
- 5 white wines for prediction
- Open SAP Analytics Cloud. I recommend making a folder in your files to save all your work to do with this problem statement in one place. In your home page, click on Browse >> Files. Create a new folder and name it appropriately.
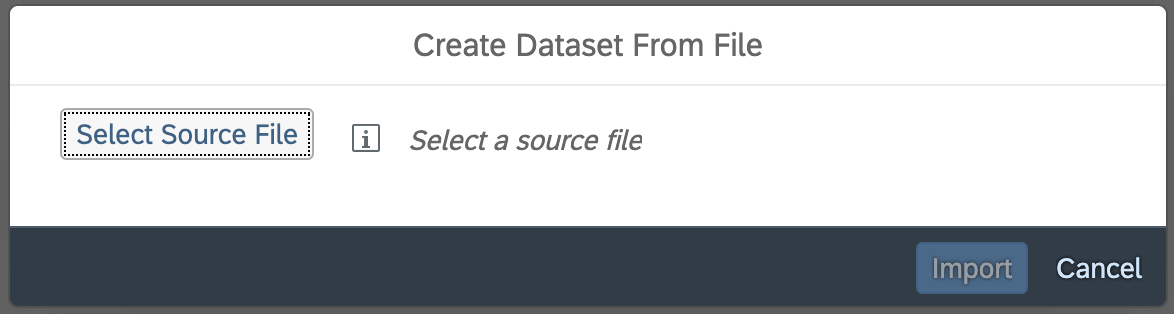
. - Inside your newly created folder, create a new dataset. You will be asked how you would like to begin – load data from a local file or from a data source. Since we have data in csv files, click on local data source. Select your source file. Load all 4 datasets. Your folder should look like the last screenshot.
. Step 2. Training the model
- Let us now build the predictive scenario. This is where our models to predict wine quality will be built and trained. On the main menu, click on Create >> Predictive Scenario.
- For this problem, our predicted entity is an integer between 0 to 10. So we will build a regression model. Select regression, give the scenario a suitable name and description.
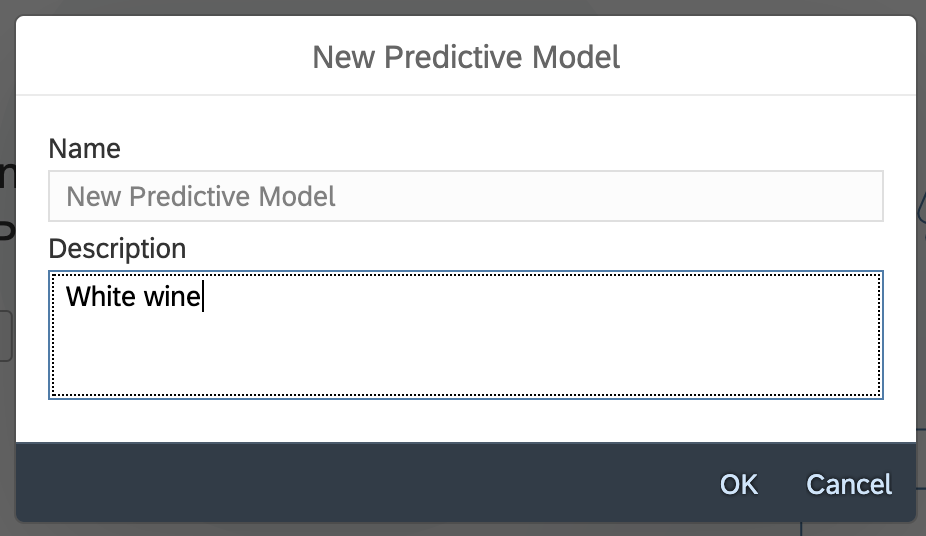
. . .- Click on create a predictive model. We will start with a model for white wine, so describe it as such.
. - We need to provide the dataset that we created earlier, so SAC can use it for training. Click on the dataset icon (highlighted in yellow) and select the dataset for white wine.
. - Click on Edit variable metadata (under the input dataset field) to understand how SAC has interpreted the dataset, what is the storage and type of each of the variables, what should SAC do with missing values, is the variable the key of the dataset, etc.
- We now need to define the variable we wish to predict (from the input dataset). In our case this is quality of the wine, so click on Target and select quality.
- If there are variables in the dataset, you would like to exclude from modelling, declare them here. I exclude free sulphur dioxide as I anticipate this will be closely related to total sulpur dioxide. You may choose to keep it and see if it improves your results.
. - Now that SAC knows what it needs to do, we can get started with training. Click on Train at the bottom of the form. You will be prompted to save changes first. Click yes to start training.
- SAC will take a while to train with the data set, and identify the best model for this problem statement. Voila! You now have results of your model!
Follow on to Part 2 of this blog post to understand the results and how to apply the model to get predictions!
Learn more about SAC
- Want to play around with SAP Analytics Cloud yourself? Download a trial version here.
- Locate the "?" symbol on the top of your SAC window to access the help documents, including guided playlists, knowledge base, browse community, etc.
Learn more about this problem
- Paper reference: P. Cortez, A. Cerdeira, F. Almeida, T. Matos and J. Reis. Modeling wine preferences by data mining from physicochemical properties.
In Decision Support Systems, Elsevier, 47(4):547-553, 2009. Available at: [Web Link] - Data: The UC Irvine Machine Learning Repository here.
- SAP Managed Tags:
- Machine Learning,
- SAP Analytics Cloud,
- SAP Analytics Cloud, augmented analytics
Labels:
7 Comments
You must be a registered user to add a comment. If you've already registered, sign in. Otherwise, register and sign in.
Labels in this area
-
ABAP CDS Views - CDC (Change Data Capture)
2 -
AI
1 -
Analyze Workload Data
1 -
BTP
1 -
Business and IT Integration
2 -
Business application stu
1 -
Business Technology Platform
1 -
Business Trends
1,658 -
Business Trends
118 -
CAP
1 -
cf
1 -
Cloud Foundry
1 -
Confluent
1 -
Customer COE Basics and Fundamentals
1 -
Customer COE Latest and Greatest
3 -
Customer Data Browser app
1 -
Data Analysis Tool
1 -
data migration
1 -
data transfer
1 -
Datasphere
2 -
Event Information
1,400 -
Event Information
76 -
Expert
1 -
Expert Insights
177 -
Expert Insights
361 -
General
1 -
Google cloud
1 -
Google Next'24
1 -
GraphQL
1 -
Kafka
1 -
Life at SAP
780 -
Life at SAP
15 -
Migrate your Data App
1 -
MTA
1 -
Network Performance Analysis
1 -
NodeJS
1 -
PDF
1 -
POC
1 -
Product Updates
4,574 -
Product Updates
400 -
Replication Flow
1 -
REST API
1 -
RisewithSAP
1 -
SAP BTP
1 -
SAP BTP Cloud Foundry
1 -
SAP Cloud ALM
1 -
SAP Cloud Application Programming Model
1 -
SAP Datasphere
2 -
SAP S4HANA Cloud
1 -
SAP S4HANA Migration Cockpit
1 -
Technology Updates
6,871 -
Technology Updates
495 -
Workload Fluctuations
1
Related Content
- SAP Fiori for SAP S/4HANA - Finding business process improvements with SAP Signavio in Technology Blogs by SAP
- SAP Datasphere – “The Next Big Step in Unified Analytics “ in Technology Blogs by SAP
- S/4HANA - ODATA API's - is it time for a "Safety Belt" ? in Technology Blogs by Members
- Integration Between SAP Datasphere and SAP Analytics Cloud - Blog 1 in Technology Blogs by Members
- SAP Data Analyst Certification in Technology Blogs by Members
Top kudoed authors
| User | Count |
|---|---|
| 13 | |
| 7 | |
| 7 | |
| 7 | |
| 6 | |
| 6 | |
| 6 | |
| 6 | |
| 6 | |
| 5 |