
- SAP Community
- Products and Technology
- Technology
- Technology Blogs by SAP
- Deep Dive: Footprint Calculation in SAP Sustainabi...
Technology Blogs by SAP
Learn how to extend and personalize SAP applications. Follow the SAP technology blog for insights into SAP BTP, ABAP, SAP Analytics Cloud, SAP HANA, and more.
Turn on suggestions
Auto-suggest helps you quickly narrow down your search results by suggesting possible matches as you type.
Showing results for
Product and Topic Expert
Options
- Subscribe to RSS Feed
- Mark as New
- Mark as Read
- Bookmark
- Subscribe
- Printer Friendly Page
- Report Inappropriate Content
06-15-2023
3:32 PM
This blog post continues my blog series on the main product capabilities of SAP Sustainability Footprint Management. This edition describes how you can calculate and monitor sustainability footprints after importing business data and mapping to emission factors. I’m covering:
If you are not yet familiar with the application, I recommend you start reading my blog post Introducing Carbon Accounting with SAP Sustainability Footprint Management here in the SAP Community first.
SAP Sustainability Footprint Management allows you to maintain various and individual inventory scopes to define the organizational boundaries of the footprint calculation. This includes the companies and plants that should be included and the considered value chain steps. The purpose is to define the sections of the value chain that are taken into consideration, for example, procurement or the entire production process. Further, this enables companies to start small and enhance the scope over time to a full-fledged emission calculation. The periodicity of the footprint calculation is always monthly. For more information, see Using the Manage Footprint Inventory Scopes Application.
The application uses energy flow models to link all energy-related elements with the resources replicated from the ERP system. The considered elements are:
All the elements can be fully modeled and be updated as needed. The models can be created by using a list display, as well as by using a graphical flow modeler, with drag and drop to add elements and to connect the sender to the receiver:
It is further also possible to import energy flow models via file upload. For detailed information, see the Help Portal: Using the Model Energy Flows Application.
The allocation functionality allows you to assign emission that can't be allocated directly to a specific product. This is required if there's no direct connection in forms of energy flows to the production process or if the required information isn't available in the ERP system. This includes emissions from facilities: A warehouse for example needs a cooling system, whose respective emissions need to be broken down to the products stored in this warehouse. Another example is emissions in chemical processes, which encompass GHG scope 1 & 2 emissions. Therefore, you can inform the system about the processing of those emissions and define allocation rules for assigning them to the manufactured products as well as to the relevant GHG scope and category. Currently this distribution is possible by defining fixed factors, further automation such as using material quantities is planned for future releases. For more information, check the Help Portal: Using the Manage Allocations Application.
This scenario is the ideal one, in which every resource has an assigned meter that provides the exact energy consumption. Here’s an example:
As you can see, the entire energy flow can be metered correctly. At the end of the month, we receive the energy bill from the energy provider from which we get the information that 500 m3 gas was consumed which corresponds to 1000 kg CO2e. Two installed meters measure the gas consumption of the oven (400 m3), as well as the cooling system (100 m3). Thus, the factor is 4:1, which leads to CO2e emissions of 800 kg for the oven and 200 kg for the cooling system. As the cooling system provides cooling water to two assembly resources, the consumed energy needs to be distributed further. Now we're considering the water consumption, which is metered as well, resulting in 75 l for the chocolate cake assembly and 25 l for the fruitcake assembly line. Similar to the gas consumption, we can derive a distribution factor of 3:1, resulting in the corresponding emissions you see in the picture. To allocate the emissions to the products manufactured on the respective production lines, resource data from the ERP system is used, such as service consumption rates and machine activity recordings. In the real world, energy consumption measured by meters may not match the energy bill due to meter inaccuracies or energy leaks. The application therefore uses the law of energy constant to ensure no CO2e is lost.
This scenario can be used in case there are no meters available to measure the energy consumption of the production line. Companies are also receiving energy bills and carbon emission details from their supplier but must calculate consumption rates based on technical data sheets for their machines. This setup is required only once unless production line changes. The benefits include recording actual work for resources, calculating real work times and CO2e distribution factors, and comparing actual and planned consumption rates. The following illustration provides an example:
Here the planned energy consumption for the chocolate assembly is 2 kWh and for the fruitcake assembly 1 kWh for 1 h of work. At the end of the defined period, we get the actual work numbers, and we see that the assembly resources were used for 200 h and 100 h. Those numbers are then used to derive the distribution factor, which is taken to calculate the CO2e emission by assembly resource. Based on those numbers we can then calculate the actual consumption rate of the assembly resources, as you can see in the picture.
More details can also be found in SAP Help: Calculation Scenarios.
SAP Sustainability Footprint Management aims to calculate a company's total carbon footprint over a specific period, attribute emissions to manufactured products and corporate overhead, and ultimately achieve a balanced emission level. Footprint calculations can be performed in two different ways:
The first option periodically calculates your company's total carbon footprint by including all emissions within the organization, such as those from energy flow models and purchased products. With the current release, the calculation considers GHG Protocol Scope 1 (owned/operated assets), Scope 2 (purchased energy), Scope 3.1 (purchased products/services), and Scope 3 (other manual emissions). Emission balancing ensures that incoming emissions equal outgoing emissions throughout all production stages.
For setting up the monthly calculation, you first need to select the footprint inventory scope, and the matching energy flow model and allocation rules. In a next step you need to provide the following input data:
When running the calculation, the application leverages the imported master and transactional activity data, the mapped emission factors for purchased products, as well as the energy flow model and allocation rules that have been set up previously, to calculate the footprints.
The second option provides quick insights into a plant's product footprints by uploading a Bill of Material (BOM)-like Excel file, excluding incoming emissions from energy flow models or other sources. The template can be downloaded in the application directly and the following information need to be provided:
For both calculation options, business logs are available that provide business messages, such as errors and warnings. More information on the calculation can be found in SAP Help: Using the Calculate Footprints Application.
All calculated footprints are stored and displayed in the footprint inventory table. By selecting a particular footprint, this can be monitored in an easy-to-read graphical format with drill-down possibilities into main emission drivers. Various levels of details create full transparency on the usage of input factors like purchased energy. The core tool to investigate the emission results for a period is a Sankey Diagram:
The overview shows the total footprint as well as the footprint per unit. The Sankey diagram displays all input and output factors. You can also click through the various levels of the chart to drill down and find out exactly where the highest carbon footprint emissions can be found. On the input side, you can see the incoming emissions for a product, resource, or allocation and the total sum of these emissions are assigned to the product, resource, or allocations on the output side. Further details are available that deliver more information on the data used in the calculation of the footprints, as well as the exact calculation formula. This way, a maximum of transparency and auditability is provided.
In this app, you can also publish the results to the connected SAP S/4HANA Cloud or SAP S/4HANA system. This is possible for all item types “Product”. For more information, see SAP Help: Using the Manage Footprint Results Application.
The calculation of inbound and outbound transport footprints, relating to GHG Protocol Scope 3.4 (upstream transportation), Scope 3.9 (downstream transportation), as well as Scope 1 (Direct emissions related to company-owned vehicles), is currently possible via uploading .csv files. Those files must contain information of start and end location, as well as the weight of the transport. If more detailed information is available, this can be entered as well. To calculate the footprint results, the application either uses configured client-specific transport routes, or an automated calculation logic based on the great circle distance to calculate the respective distances and hence emissions. As soon as the data is processed, it's automatically validated and detailed feedback is provided on issues within the data (e.g., incorrect postal codes). Those issues must or can be adjusted to successfully trigger the calculation, or to even improve the results. Valuable information is presented to review if calculations were successful, if the right data was drawn (e.g., number of parcels and shipments), or if the correct scenario was selected.
For calculating transport footprints without configuring and importing data, the Calculate Transport Footprints - Lite app allows you to perform fast calculations and assessments on the transport footprint of a single shipment. The impact of actions, for example switching the Transport Mode from Plane to Ship can be assessed and simulated. An input mask is provided to enter the data of the transport(s) that should be considered. The calculated results are visualized in a chart and table, the route is displayed on a world map.
More and detailed information can be found in SAP Help: Calculating Transport Footprints.
For enabling our customers to land and expand their footprint calculations we plan to deliver a Business scoping supporting different customer journeys, providing more flexibility in the managing of Footprint Inventory Scopes. For addressing detailed reporting needs as per common standards, we plan to provide further breakdowns of the calculated footprints, such as splitting the emissions into fossil and biogenic. We also plan to enable location and market-based energy calculation in production activities, as well as emission factor usage in the energy flow model.
To enable cradle-to-grave product footprint calculation, we plan to include the ability to calculate emissions related to product use and end-of-life treatment. Also non-product related Scope 3 emissions will be addressed further, we for example plan to incorporate the calculation of people transport footprint covering business travel and employee commutes.
The calculated transport footprints we plan to include in organizational footprint inventories, thus enabling the break-down on product level and including the respective emissions in the overall product footprint. For the calculation itself, we intend to leverage the master data and material flows that are already replicated from the connected ERP system. We also plan to publish APIs to connect to other sources for receiving data, as well as to provide a direct integration into SAP Transportation Management for automatically leveraging the transportation data that is available in this tool.
For an overview of all planned innovations and their benefit for you and your company, have a look into SAP Road Map Explorer.
- Managing Footprint Inventory Scopes
- Modeling Energy Flows
- Managing Allocations
- Calculation Scenarios
- Calculating Footprints
- Managing Footprint Results
- Calculating Freight Transport Footprints
- Outlook
If you are not yet familiar with the application, I recommend you start reading my blog post Introducing Carbon Accounting with SAP Sustainability Footprint Management here in the SAP Community first.
Managing Footprint Inventory Scopes
SAP Sustainability Footprint Management allows you to maintain various and individual inventory scopes to define the organizational boundaries of the footprint calculation. This includes the companies and plants that should be included and the considered value chain steps. The purpose is to define the sections of the value chain that are taken into consideration, for example, procurement or the entire production process. Further, this enables companies to start small and enhance the scope over time to a full-fledged emission calculation. The periodicity of the footprint calculation is always monthly. For more information, see Using the Manage Footprint Inventory Scopes Application.
Modeling Energy Flows
The application uses energy flow models to link all energy-related elements with the resources replicated from the ERP system. The considered elements are:
- Energy carriers, describing the type of used energy (such as electricity or gas)
- Energy sources, describing the use of energy in more detail (such as the specific energy provider)
- Resources, taken from the ERP source system (such as assembly lines or ovens)
- Infrastructure, including:
- Meters, for measuring the amount of consumed energy
- Process infrastructures, that aren't defined in ERP but needed for the calculation
- Facilities, to be included in the calculation (such as warehouses or silos)
All the elements can be fully modeled and be updated as needed. The models can be created by using a list display, as well as by using a graphical flow modeler, with drag and drop to add elements and to connect the sender to the receiver:

Energy Flow Model (new UI version - not yet released)
It is further also possible to import energy flow models via file upload. For detailed information, see the Help Portal: Using the Model Energy Flows Application.
Managing Allocations
The allocation functionality allows you to assign emission that can't be allocated directly to a specific product. This is required if there's no direct connection in forms of energy flows to the production process or if the required information isn't available in the ERP system. This includes emissions from facilities: A warehouse for example needs a cooling system, whose respective emissions need to be broken down to the products stored in this warehouse. Another example is emissions in chemical processes, which encompass GHG scope 1 & 2 emissions. Therefore, you can inform the system about the processing of those emissions and define allocation rules for assigning them to the manufactured products as well as to the relevant GHG scope and category. Currently this distribution is possible by defining fixed factors, further automation such as using material quantities is planned for future releases. For more information, check the Help Portal: Using the Manage Allocations Application.
Calculation Scenarios
Fully-Metered Calculation
This scenario is the ideal one, in which every resource has an assigned meter that provides the exact energy consumption. Here’s an example:

Fully-metered Calculation Scenario (example)
As you can see, the entire energy flow can be metered correctly. At the end of the month, we receive the energy bill from the energy provider from which we get the information that 500 m3 gas was consumed which corresponds to 1000 kg CO2e. Two installed meters measure the gas consumption of the oven (400 m3), as well as the cooling system (100 m3). Thus, the factor is 4:1, which leads to CO2e emissions of 800 kg for the oven and 200 kg for the cooling system. As the cooling system provides cooling water to two assembly resources, the consumed energy needs to be distributed further. Now we're considering the water consumption, which is metered as well, resulting in 75 l for the chocolate cake assembly and 25 l for the fruitcake assembly line. Similar to the gas consumption, we can derive a distribution factor of 3:1, resulting in the corresponding emissions you see in the picture. To allocate the emissions to the products manufactured on the respective production lines, resource data from the ERP system is used, such as service consumption rates and machine activity recordings. In the real world, energy consumption measured by meters may not match the energy bill due to meter inaccuracies or energy leaks. The application therefore uses the law of energy constant to ensure no CO2e is lost.
ERP-Based Calculation
This scenario can be used in case there are no meters available to measure the energy consumption of the production line. Companies are also receiving energy bills and carbon emission details from their supplier but must calculate consumption rates based on technical data sheets for their machines. This setup is required only once unless production line changes. The benefits include recording actual work for resources, calculating real work times and CO2e distribution factors, and comparing actual and planned consumption rates. The following illustration provides an example:
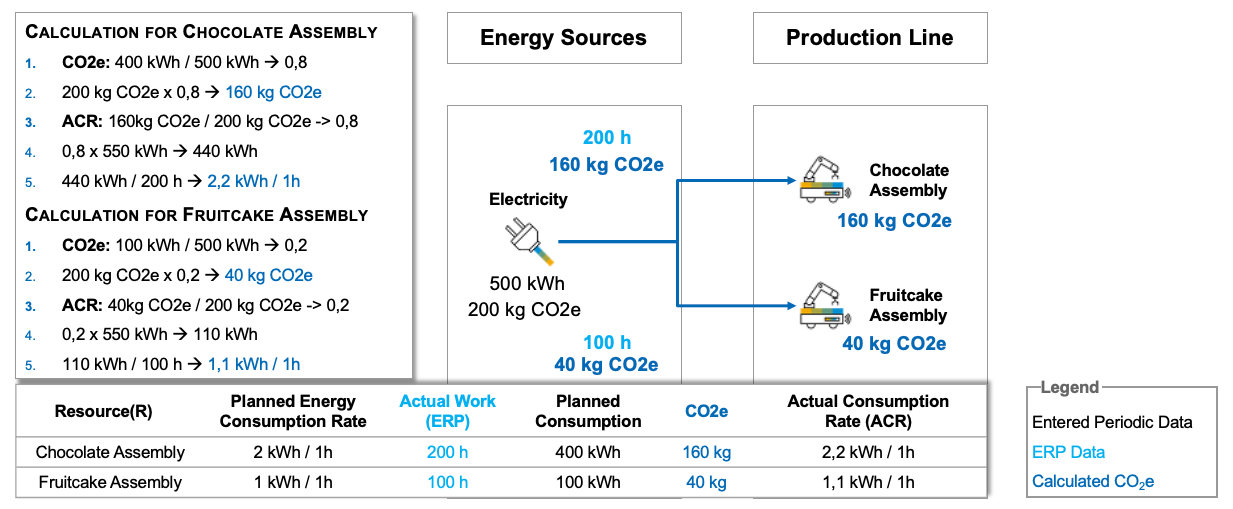
ERP-based Calculation Scenario (example)
Here the planned energy consumption for the chocolate assembly is 2 kWh and for the fruitcake assembly 1 kWh for 1 h of work. At the end of the defined period, we get the actual work numbers, and we see that the assembly resources were used for 200 h and 100 h. Those numbers are then used to derive the distribution factor, which is taken to calculate the CO2e emission by assembly resource. Based on those numbers we can then calculate the actual consumption rate of the assembly resources, as you can see in the picture.
More details can also be found in SAP Help: Calculation Scenarios.
Calculating Footprints
SAP Sustainability Footprint Management aims to calculate a company's total carbon footprint over a specific period, attribute emissions to manufactured products and corporate overhead, and ultimately achieve a balanced emission level. Footprint calculations can be performed in two different ways:
Calculating Organizational Footprint Inventory
The first option periodically calculates your company's total carbon footprint by including all emissions within the organization, such as those from energy flow models and purchased products. With the current release, the calculation considers GHG Protocol Scope 1 (owned/operated assets), Scope 2 (purchased energy), Scope 3.1 (purchased products/services), and Scope 3 (other manual emissions). Emission balancing ensures that incoming emissions equal outgoing emissions throughout all production stages.
For setting up the monthly calculation, you first need to select the footprint inventory scope, and the matching energy flow model and allocation rules. In a next step you need to provide the following input data:
- Energy Bills, for entering the consumed energy quantity and the respective emissions as provided by the utilities company
- Meter Readings, for entering the information from the meters in your production (possible via in-app editing or via Excel file upload)
- Manual Emissions, for entering the value for manual emissions
When running the calculation, the application leverages the imported master and transactional activity data, the mapped emission factors for purchased products, as well as the energy flow model and allocation rules that have been set up previously, to calculate the footprints.
Calculating Product Footprints
The second option provides quick insights into a plant's product footprints by uploading a Bill of Material (BOM)-like Excel file, excluding incoming emissions from energy flow models or other sources. The template can be downloaded in the application directly and the following information need to be provided:
- Material direction (in or out of production)
- Material role (raw, by, semi, or main product)
- Material Unit of Measure (e.g. kilogram or liter)
For both calculation options, business logs are available that provide business messages, such as errors and warnings. More information on the calculation can be found in SAP Help: Using the Calculate Footprints Application.
Managing Footprint Results
All calculated footprints are stored and displayed in the footprint inventory table. By selecting a particular footprint, this can be monitored in an easy-to-read graphical format with drill-down possibilities into main emission drivers. Various levels of details create full transparency on the usage of input factors like purchased energy. The core tool to investigate the emission results for a period is a Sankey Diagram:

Manage and Monitor Footprint Results (Sankey-Diagram)
The overview shows the total footprint as well as the footprint per unit. The Sankey diagram displays all input and output factors. You can also click through the various levels of the chart to drill down and find out exactly where the highest carbon footprint emissions can be found. On the input side, you can see the incoming emissions for a product, resource, or allocation and the total sum of these emissions are assigned to the product, resource, or allocations on the output side. Further details are available that deliver more information on the data used in the calculation of the footprints, as well as the exact calculation formula. This way, a maximum of transparency and auditability is provided.
In this app, you can also publish the results to the connected SAP S/4HANA Cloud or SAP S/4HANA system. This is possible for all item types “Product”. For more information, see SAP Help: Using the Manage Footprint Results Application.
Calculating Freight Transport Footprints
The calculation of inbound and outbound transport footprints, relating to GHG Protocol Scope 3.4 (upstream transportation), Scope 3.9 (downstream transportation), as well as Scope 1 (Direct emissions related to company-owned vehicles), is currently possible via uploading .csv files. Those files must contain information of start and end location, as well as the weight of the transport. If more detailed information is available, this can be entered as well. To calculate the footprint results, the application either uses configured client-specific transport routes, or an automated calculation logic based on the great circle distance to calculate the respective distances and hence emissions. As soon as the data is processed, it's automatically validated and detailed feedback is provided on issues within the data (e.g., incorrect postal codes). Those issues must or can be adjusted to successfully trigger the calculation, or to even improve the results. Valuable information is presented to review if calculations were successful, if the right data was drawn (e.g., number of parcels and shipments), or if the correct scenario was selected.
For calculating transport footprints without configuring and importing data, the Calculate Transport Footprints - Lite app allows you to perform fast calculations and assessments on the transport footprint of a single shipment. The impact of actions, for example switching the Transport Mode from Plane to Ship can be assessed and simulated. An input mask is provided to enter the data of the transport(s) that should be considered. The calculated results are visualized in a chart and table, the route is displayed on a world map.
![]()
Calculate Transport Footprints – Lite
More and detailed information can be found in SAP Help: Calculating Transport Footprints.
Outlook
For enabling our customers to land and expand their footprint calculations we plan to deliver a Business scoping supporting different customer journeys, providing more flexibility in the managing of Footprint Inventory Scopes. For addressing detailed reporting needs as per common standards, we plan to provide further breakdowns of the calculated footprints, such as splitting the emissions into fossil and biogenic. We also plan to enable location and market-based energy calculation in production activities, as well as emission factor usage in the energy flow model.
To enable cradle-to-grave product footprint calculation, we plan to include the ability to calculate emissions related to product use and end-of-life treatment. Also non-product related Scope 3 emissions will be addressed further, we for example plan to incorporate the calculation of people transport footprint covering business travel and employee commutes.
The calculated transport footprints we plan to include in organizational footprint inventories, thus enabling the break-down on product level and including the respective emissions in the overall product footprint. For the calculation itself, we intend to leverage the master data and material flows that are already replicated from the connected ERP system. We also plan to publish APIs to connect to other sources for receiving data, as well as to provide a direct integration into SAP Transportation Management for automatically leveraging the transportation data that is available in this tool.
For an overview of all planned innovations and their benefit for you and your company, have a look into SAP Road Map Explorer.
- SAP Managed Tags:
- SAP S/4HANA,
- Sustainability,
- SAP S/4HANA Cloud Public Edition,
- SAP Business Technology Platform
Labels:
11 Comments
You must be a registered user to add a comment. If you've already registered, sign in. Otherwise, register and sign in.
Labels in this area
-
ABAP CDS Views - CDC (Change Data Capture)
2 -
AI
1 -
Analyze Workload Data
1 -
BTP
1 -
Business and IT Integration
2 -
Business application stu
1 -
Business Technology Platform
1 -
Business Trends
1,658 -
Business Trends
110 -
CAP
1 -
cf
1 -
Cloud Foundry
1 -
Confluent
1 -
Customer COE Basics and Fundamentals
1 -
Customer COE Latest and Greatest
3 -
Customer Data Browser app
1 -
Data Analysis Tool
1 -
data migration
1 -
data transfer
1 -
Datasphere
2 -
Event Information
1,400 -
Event Information
74 -
Expert
1 -
Expert Insights
177 -
Expert Insights
348 -
General
1 -
Google cloud
1 -
Google Next'24
1 -
GraphQL
1 -
Kafka
1 -
Life at SAP
780 -
Life at SAP
14 -
Migrate your Data App
1 -
MTA
1 -
Network Performance Analysis
1 -
NodeJS
1 -
PDF
1 -
POC
1 -
Product Updates
4,575 -
Product Updates
391 -
Replication Flow
1 -
REST API
1 -
RisewithSAP
1 -
SAP BTP
1 -
SAP BTP Cloud Foundry
1 -
SAP Cloud ALM
1 -
SAP Cloud Application Programming Model
1 -
SAP Datasphere
2 -
SAP S4HANA Cloud
1 -
SAP S4HANA Migration Cockpit
1 -
Technology Updates
6,871 -
Technology Updates
482 -
Workload Fluctuations
1
Related Content
- Embracing Sustainability using the SAP Enterprise Architecture Framework in Technology Blogs by Members
- Digital Twins of an Organization: why worth it and why now in Technology Blogs by SAP
- Understanding Data Modeling Tools in SAP in Technology Blogs by SAP
- It has never been easier to print from SAP with Microsoft Universal Print in Technology Blogs by Members
- Partner-2-Partner Collaboration in Manufacturing in Technology Blogs by SAP
Top kudoed authors
| User | Count |
|---|---|
| 15 | |
| 11 | |
| 10 | |
| 9 | |
| 8 | |
| 8 | |
| 7 | |
| 7 | |
| 7 | |
| 7 |