

- SAP Community
- Products and Technology
- Technology
- Technology Blogs by SAP
- Display Snapshot Monitor Data
Technology Blogs by SAP
Learn how to extend and personalize SAP applications. Follow the SAP technology blog for insights into SAP BTP, ABAP, SAP Analytics Cloud, SAP HANA, and more.
Turn on suggestions
Auto-suggest helps you quickly narrow down your search results by suggesting possible matches as you type.
Showing results for
Product and Topic Expert
Options
- Subscribe to RSS Feed
- Mark as New
- Mark as Read
- Bookmark
- Subscribe
- Printer Friendly Page
- Report Inappropriate Content
05-11-2023
7:25 PM
With ST-PI Support Package 20 we have introduced a new transaction which allows to generate graphics to display the snapshot monitoring data collected by transaction /SDF/MON or /SDF/SMON.
see also SAP note 3210905 - Display Snapshot Monitor Data

The new program /SDF/SMON_DISPLAY will open an external modal window to display the data in a simple graphic using the external JavaScript charting library plotly.js (see https://plot.ly/javascript/ - (C)opyright 2012-2019, Plotly, Inc.).
The new transaction is compatible with SAPGUI, WebGUI and JavaGUI.
Prerequisites
In order to use the new transaction /SDF/SMON_DISPLAY (or report /SDF/SMON_DISPLAY) the following prerequisites must be fulfilled:
- The snapshot monitor /SDF/MON or /SDF/SMON must be scheduled.
- A SAPGUI version of release 7.70 or later is recommended with Edge based on chromium enabled. (See SAPGUI Options > Interaction Design > Control Settings)
- Additionally you must provide the URL to a plotly compatible library. Minimum version of the plotly Javascript library is v1.58.5 (basic bundle, minimized version recommended). You find detailed information about the available libraries at: https://github.com/plotly/plotly.js/#load-via-script-tag. The links to the latest plotly basic bundle can found at https://github.com/plotly/plotly.js/blob/master/dist/README.md#plotlyjs-basic.
Disclaimer: SAP is unable to guarantee that the libraries downloaded from external sources are safe to use. Theoretically such external download locations could be compromised.
If you do not trust an externally hosted library, you can download a library version of your choice, test this library and then host this library on a trusted server and use the URL to this trusted location. (we recommend using the minimized versions like plotly-basic-x.xx.x.min.js - more versions are available at https://cdnjs.com/libraries/plotly.js).You must maintain the URL to the plotly library in table /SDF/PLOTLYCONF for ID = PLOTLY_LIBRARY. (SE11 > Table: /SDF/PLOTLYCONF >Utilities > Table Content > Create Entries). Alternatively, you can add parameter /SDF/PLOTLY = cdn.plot.ly/plotly-basic-2.26.0.min.js in your user parameters (transaction SU3).
- If you choose an external library location the front end must have internet/network connection to access and download this library.
- As alternative you can host the plotly library on any of your SAP ABAP application servers as described in https://help.sap.com/doc/saphelp_nw73ehp1/7.31.19/en-US/48/3e1b4e252f72d0e10000000a42189c/content.ht...
You use profile parameter icm/HTTP/file_access_0 = PREFIX=/doc/, DOCROOT=/tmp/documents to point to an application server directory where you host the plotly.js file and then you can use URL http://<SERVER:PORT>/<PREFIX>/plotly.js
Program Parameters
Server
Application Server (leave empty for all servers)
Date/Time
Date and Time of the snapshot. extended monitoring data from /SDF/SMON will be automatically de-clustered if required.![]()
Last n minutes
Only select and display the last n minutes of data for the current day. If this option is selected, the input fields Date/Time are disabled and calculated automatically with each refresh.![]()
Round Time to n seconds
The timestamps from SDFMON will be rounded to the next multiple of the specified number of seconds (max. rounding to 3600 seconds)
Data Source
- Monitoring Data (Table /SDF/MON_HEADER)
- Extended Monitoring (Table /SDF/SMON_HEADER)
![]()
Measurements
Up to three different measurements can be specified.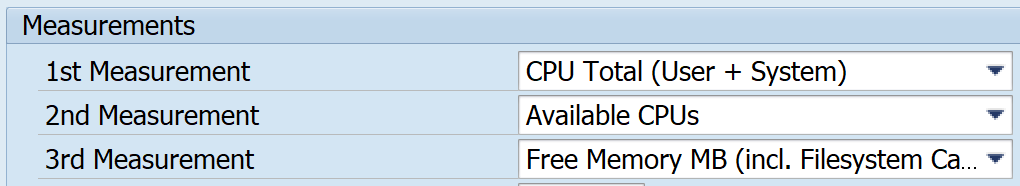
If the data is rounded to n seconds or if multiple application servers are selected one can specify how the data is aggregated - the following options are available:
- AVG Average
- SUM Total
- MAX Maximum Value
- MIN Minimum Value
- CNT Number of values (count)

Auto Refresh
The data selection and display will be repeated automatically every n seconds. This functionality is only available if the last n seconds are chosen.![]()
URL to plotly library (display only)
You must maintain the URL to the plotly library in table /SDF/PLOTLYCONF for ID = PLOTLY_LIBRARY.![]()
Graphics Options
The graphic options for a selected measurement are saved locally within the cache of the frontend PC. If you select that the CPU (User) should be displayed as a line chart with blue color, then those settings will be applied in each system as long as you do not clear the browser cache.
In order to select the graphic options, you need to hover the mouse over the graphic until a data point is highlighted as shown in the screenshot below or click on the legend if multiple series are available.

then just left-click and a modal popup will appear where you can configure the following settings.

Available Parameters/Options are:
- Description
- Axis (left/right)
- Color
- Size/Style (point size or line width) and Style (linear/steps/spline)
- Graphic Type (Scatter/Line, Bar, Area)
- Mode (Line, Marker, Line+Marker)
Axis
| Left | Right |
 |  |
Color
with the color selector you can select the color for the selected data series

Size/Style
Here we can define how the data points are connected. Available options are:
- Linear (points are connected with direct lines)
- Steps (a horizontal line is drawn through the data points)
- Spline (a round bezier/spline curve is drawn through the data points)
| Linear | Steps | Spline |
 |  |  |
Type
One can choose between three different chart types: Bar-Charts, Scatter/Line Charts and Area Charts:
| Bar | Scatter/Line | Area |
 |  |  |
Opacity
With Opacity one can influence how transparent the colors are drawn. The values are between 0 (invisible) to 1 (no transparency)
| Opacity = 0.10 | Opacity = 0.50 | Opacity = 0.90 |
 |  |  |
Mode
Here we can specify if we want to draw only a marker, a line or both, Marker and Lines
| Marker | Line | Marker + Line |
 |  |  |
Marker
Only available if a Mode Marker or Line+Marker is selected. Available options are:
- Circle
- Cross
- Diamond
- Square
| Circle | Cross | Diamond |
 |  |  |
Axis Scaling
Additionally, one can select if the axis scaling is linear or logarithmic.
Additional Interactive Options (available when cursor is above graph)
Additional functionality is available if you hover the mouse over the graphic (upper right).
 |
|
Conclusion
Hope you find this blog helpful. The intention of this blog is to give an overview of the transaction /SDF/SMON_DISPLAY which can directly display graphics for the data collected by the snapshot monitor /SDF/MON or /SDF/SMON.
- SAP Managed Tags:
- SAP NetWeaver Application Server
Labels:
4 Comments
You must be a registered user to add a comment. If you've already registered, sign in. Otherwise, register and sign in.
Labels in this area
-
ABAP CDS Views - CDC (Change Data Capture)
2 -
AI
1 -
Analyze Workload Data
1 -
BTP
1 -
Business and IT Integration
2 -
Business application stu
1 -
Business Technology Platform
1 -
Business Trends
1,658 -
Business Trends
105 -
CAP
1 -
cf
1 -
Cloud Foundry
1 -
Confluent
1 -
Customer COE Basics and Fundamentals
1 -
Customer COE Latest and Greatest
3 -
Customer Data Browser app
1 -
Data Analysis Tool
1 -
data migration
1 -
data transfer
1 -
Datasphere
2 -
Event Information
1,400 -
Event Information
70 -
Expert
1 -
Expert Insights
177 -
Expert Insights
338 -
General
1 -
Google cloud
1 -
Google Next'24
1 -
GraphQL
1 -
Kafka
1 -
Life at SAP
780 -
Life at SAP
14 -
Migrate your Data App
1 -
MTA
1 -
Network Performance Analysis
1 -
NodeJS
1 -
PDF
1 -
POC
1 -
Product Updates
4,575 -
Product Updates
380 -
Replication Flow
1 -
REST API
1 -
RisewithSAP
1 -
SAP BTP
1 -
SAP BTP Cloud Foundry
1 -
SAP Cloud ALM
1 -
SAP Cloud Application Programming Model
1 -
SAP Datasphere
2 -
SAP S4HANA Cloud
1 -
SAP S4HANA Migration Cockpit
1 -
Technology Updates
6,872 -
Technology Updates
470 -
Workload Fluctuations
1
Related Content
- PI/PO7.5 Background Job Processing Monitor -User roles in Technology Q&A
- What’s New in SAP Datasphere Version 2024.9 — Apr 23, 2024 in Technology Blogs by Members
- Dynamic BDC in Table Control in Technology Blogs by Members
- How to maintain/display 'Contact Information' tab in PO/PI message monitoring page? in Technology Q&A
- SAP Build Code - Speed up your development with Generative AI Assistant - Joule in Technology Blogs by SAP
Top kudoed authors
| User | Count |
|---|---|
| 17 | |
| 11 | |
| 7 | |
| 7 | |
| 7 | |
| 7 | |
| 6 | |
| 6 | |
| 6 | |
| 6 |