

- SAP Community
- Products and Technology
- Technology
- Technology Blogs by SAP
- From Insights to Action - the End-to-End Analytics...
Technology Blogs by SAP
Learn how to extend and personalize SAP applications. Follow the SAP technology blog for insights into SAP BTP, ABAP, SAP Analytics Cloud, SAP HANA, and more.
Turn on suggestions
Auto-suggest helps you quickly narrow down your search results by suggesting possible matches as you type.
Showing results for
Advisor
Options
- Subscribe to RSS Feed
- Mark as New
- Mark as Read
- Bookmark
- Subscribe
- Printer Friendly Page
- Report Inappropriate Content
12-14-2021
8:27 AM
"Analytics" is often associated by people with "Creating Charts" or "Counting Measures and KPIs". Though these associations are not wrong, they do not capture one central purpose of Analytics:
Analytics is the process of deriving insights from data in order to run better business.
Hence, Analytics shall not be regarded as an own isolated discipline, but rather as a integral part of the business solution as a whole. Analytics has a clear target. Its goal is to serve the business applications. The job is to provide the right information in the right context in the right point in time. Having a good Analytics in place translates directly into a competitive advantage in business.
However, the Analytics domain has many obstacles. And it's important to understand them, so that we can provide the right tools to resolve. Gaining true business knowledge is not intuitive but rather an "art", where data has to be continuously enriched, shaped and combined with other data in order make sense out of it. For that it needs to be approached in a systematic way before one can utilize the results in the business processes and decision taking.
In this blog and the embedded video below I want to take you with me into the Analytics journey, describing the major phases and depicting how data evolve over time.
Hope you are enjoying with me this journey. Let's Go 🙂
When talking to different customers and partners, the pain that resides in the Analytics domain are all similar and repetitive. The following statement summarizes for me today's major customers problem:
Eventually what customers want is to take smart business decision and make their company running more successful.
One can say: "We have so many data about our customers and the market. We should be able take some advantage out of it.". However, owning data itself is not sufficient. There are various obstacles which hinder customer to achieve this goal. The key challenge is to translate this data into true business knowledge and insights and provide them in such a way, which help the end user to take conscious decisions.
In the following I want to laydown the major phases of data processing in Analytics. Each of them comprises of different challenges, which require different ways and technics to be resolved.
The first phase is about ingesting and consolidating data into one central place. At the first glance this task might sound trivial: just bring the data into same data storage! However, data are distributed across different system landscape. That require different access points and authorizations. Data are stored in different formats (structured, semi-structured, unstructured) and might have mismatching data types. How to store and replicate big volume how data and keep them up-to-date for consumption? etc.
Some might separate the following items into another phase of "Data Preparation". However I wanted simplify and keep them in this first stage:
At this stage data are pretty much in their raw and origin format of their origin system. The main result of this stage is: data that is consolidated and prepared for further processing. These tasks has been typically addressed by big data warehousing vendors and formed an own "industry" for data management.
The consolidated raw data have to be further processed before they can be consumed and analyzed. For that, the next discipline is data modeling, which is about organizing and describing data and enrich them with business semantics and relationships.
Ideally, the data is modeled in such a way, that it reflects and captures the mechanics and semantics of the real business domain. The models embrace the business logic and complexity.
In this context it is helpful, if data is organized and grouped into business domain entities, such as Sales, Product, Customer, etc. That gives the opportunity to streamline and standardize Business Domain Models, which:
Of course, the standardization does not come for free, but require alignments and governance across the organization.
Besides describing the Business Domain Model, one shall not forget to specify also their relationship to each other. Relationships capture how the models interplay with each other and for that they preserve important relevant semantics and business logic, e.g. a "Sales to Time" - Relationship allows to map and aggregate the sales revenue into the corresponding time slices (such as Month, Quarter or Year) and visualize it as a history line chart. Another example is the "Product to Product Text" - relationship, which encapsulates the logic to represent master data in the language of choice at runtime.

The semantics of relationships vary from case to case and are multifold. They need to be resolved individually and can serve different purposes. Eventually rich semantical models open doors for new application and scenarios in the product, e.g.
The result of this phase shall be:
We will see the the later phases, that the relationship semantics will become one major pillar to arrive richer analytical models.
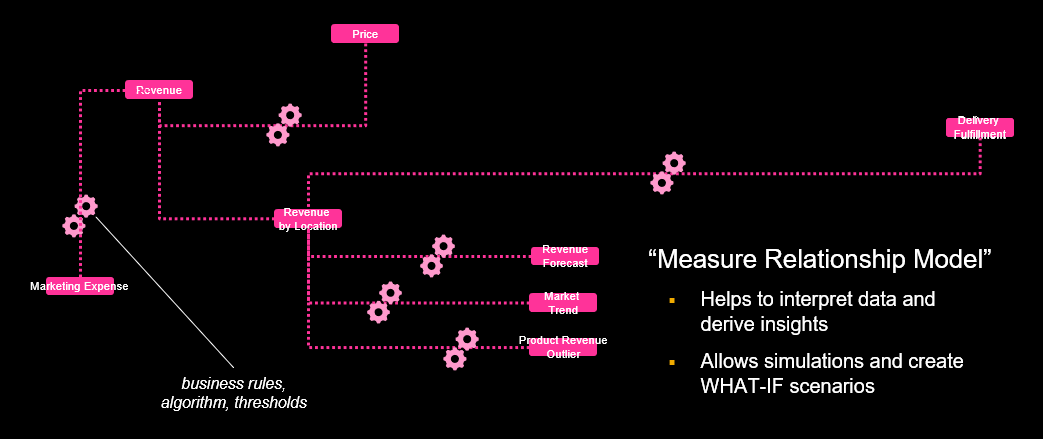
This phase of the Analytics journey is focusing on supporting user to interpret and understand data and to derive insights.
Getting the numbers such "Total Revenue in 2021" is okay, however, this is not the end of the journey yet. One interviewed customer said "In fact my job as an business analyst has just started". With this KPI customers can describe what happened in the past. But they will fail to derive concrete business decision and strategy to improve in the future.
What he needs is to dive one level deeper to understand the root causes and key drivers for the figures and get a holistic view on them.
For instance, to understand better the KPI "Total Revenue in 2021", we might have to analyze also the revenue forecast, determine the pattern for customer churns, calculate the potential success rate of an important deal, derive correlations between purchasing behavior and marketing spend. Or sometimes we just require to acquire external data from market or from the competitors.
Hence, we are collecting additional insights of the very same business context in order to sharpen and/or generate new insights.
Using the classic analytical tools are no longer sufficient. Instead we require new technics from data mining and machine learning domain. We need new categories of tools to enable customers to run simulations or what-if scenarios.
Eventually, we need to enhance our semantic model by describing the relationships and correlations between the measures.
Let us summarize the main targets of this phase:
While in the first two phases we were rather processing data that has been produced in the past in the history (backward looking analysis), in this phase we need to go one step further and create also new dataset and semantics (forwards looking analysis).
The last phase of the journey is about translating insights into action. That means using the gained information to make concrete business decisions and drive business processes.
For that we have to extend our existing model by telling which facts and/or combination of insights triggers which specific business action. Let's take the example of a smart fridge: one can set a program to order new bottles of milk (action) when only 1 bottle is left:
There are three main components in this model:
Of course, this is a very simple example to explain the interplay the between gained insights and action. In the business world there are many more dependencies and intercorrelations of facts which needs to be determined before a concrete business action can be recommended.
Hence, the quality of such as recommendation system is highly dependent on the modeling quality of the identified combination of insights plus their thresholds, mapped against the business transaction.
The system has to be improved over time through continuous optimization and learning from historic data, and at same time it is required to discover new correlations between insights and actions. When applying that right we will have a system, which not only can recommend a decision / action to take, but also explain the reasoning behind. That will help to user and increase the confidence in the decision taking process.
Furthermore, to go one step further, the system could break down a recommendation into risk categories, such as "pessimistic", "optimistic" and "neutral". Each of them has a certain probability of success rate and confidence. With that the business user has to decide which risk he is willing to take and make up a strategy.
Here is an example to illustrate such a "Decision Board" :
Another improvement the integration of system simulations, which allow users to run different What-If scenarios by changing some of the parameters and thresholds of the model. With that user can emulate different actions and let the system calculate the result for that specific configuration.
These are just a few proposals to improve the decision taking process and make it easier for business users. And there is for sure enough room to work on a decision system support.
The entire domain of recommendation system lays down the foundation for process automation. With predefined rules the system can push and trigger different business transactions and processes without human interaction. Hence, only on preconfigured cases users will be conducted for further processing. Eventually, that will make the business running more efficient and save costs.
The goals of this phase are:
I hope I could give you an overview on the end-to-end Analytics journey and get a better understanding on the various phases and disciplines. Each phase has its own challenges and need their own treatments and solutions.
Important is that the phases are sequential ordered and can not be skipped. Moreover, they depend and pre-requisite on each other. And you have to resolve them in the entirety to resolve the customers problem in today's data management and analytics domain.
The Analytics journey can be viewed also as an evolution, where data matures step by step from raw data up to true business insights. With each phase the data is enhanced with additional semantics and business logic. That opens up doors for new kind of innovative applications.
Nonetheless, the journey must end by closing the loop between Analytics and the Business Transactional Domain. We have to translate the analytical insights into business process transactions. While as of today, both domains are still regarded as separate worlds, we want to see in the future more solutions (such as recommendation systems, simulations, data driven process automation) on how both domains interplay hand in hand with each other.
Analytics is the process of deriving insights from data in order to run better business.
Hence, Analytics shall not be regarded as an own isolated discipline, but rather as a integral part of the business solution as a whole. Analytics has a clear target. Its goal is to serve the business applications. The job is to provide the right information in the right context in the right point in time. Having a good Analytics in place translates directly into a competitive advantage in business.
However, the Analytics domain has many obstacles. And it's important to understand them, so that we can provide the right tools to resolve. Gaining true business knowledge is not intuitive but rather an "art", where data has to be continuously enriched, shaped and combined with other data in order make sense out of it. For that it needs to be approached in a systematic way before one can utilize the results in the business processes and decision taking.
In this blog and the embedded video below I want to take you with me into the Analytics journey, describing the major phases and depicting how data evolve over time.
Hope you are enjoying with me this journey. Let's Go 🙂
Today's customers problems in Analytics
When talking to different customers and partners, the pain that resides in the Analytics domain are all similar and repetitive. The following statement summarizes for me today's major customers problem:
“In the age of big data, Business Users suffer from
dealing with big volume of data,
in various format,
scattered across multiple sources.
Instead of spending time analyzing data,
users spend more time on organizing, consolidating,
and keeping the data up-to-date.
The challenges in data analysis,
and deriving informed business decisions and actions remain.”
Eventually what customers want is to take smart business decision and make their company running more successful.
One can say: "We have so many data about our customers and the market. We should be able take some advantage out of it.". However, owning data itself is not sufficient. There are various obstacles which hinder customer to achieve this goal. The key challenge is to translate this data into true business knowledge and insights and provide them in such a way, which help the end user to take conscious decisions.
In the following I want to laydown the major phases of data processing in Analytics. Each of them comprises of different challenges, which require different ways and technics to be resolved.
Data Consolidation and Ingestion
The first phase is about ingesting and consolidating data into one central place. At the first glance this task might sound trivial: just bring the data into same data storage! However, data are distributed across different system landscape. That require different access points and authorizations. Data are stored in different formats (structured, semi-structured, unstructured) and might have mismatching data types. How to store and replicate big volume how data and keep them up-to-date for consumption? etc.
- Connectivity to different sources scattered within a heterogenous system landscape
- Federating and/or replicating data from the source systems by respecting the required data latency (real-time, scheduled)
- Storing and persisting data cost efficiently
Some might separate the following items into another phase of "Data Preparation". However I wanted simplify and keep them in this first stage:
- Streamline the data types and data format
- Removing redundancies and harmonize data
- Data cleansing, wrangling and munging
At this stage data are pretty much in their raw and origin format of their origin system. The main result of this stage is: data that is consolidated and prepared for further processing. These tasks has been typically addressed by big data warehousing vendors and formed an own "industry" for data management.

Data Modeling, Data Enrichment and Semantics
The consolidated raw data have to be further processed before they can be consumed and analyzed. For that, the next discipline is data modeling, which is about organizing and describing data and enrich them with business semantics and relationships.
Ideally, the data is modeled in such a way, that it reflects and captures the mechanics and semantics of the real business domain. The models embrace the business logic and complexity.
In this context it is helpful, if data is organized and grouped into business domain entities, such as Sales, Product, Customer, etc. That gives the opportunity to streamline and standardize Business Domain Models, which:
- is independent for the underlying source system
- abstracts from the physical data model
- allows you to hide data complexity from the end-user
- simplifies the data access for business users
- enables Top-Down / Demand-Driven modeling
Of course, the standardization does not come for free, but require alignments and governance across the organization.
Besides describing the Business Domain Model, one shall not forget to specify also their relationship to each other. Relationships capture how the models interplay with each other and for that they preserve important relevant semantics and business logic, e.g. a "Sales to Time" - Relationship allows to map and aggregate the sales revenue into the corresponding time slices (such as Month, Quarter or Year) and visualize it as a history line chart. Another example is the "Product to Product Text" - relationship, which encapsulates the logic to represent master data in the language of choice at runtime.
The semantics of relationships vary from case to case and are multifold. They need to be resolved individually and can serve different purposes. Eventually rich semantical models open doors for new application and scenarios in the product, e.g.
- Enabling Self-Service Data Consumption for Business Analysts
- Top-Down and Demand Driven modeling
- Delivering robust Business Content
The result of this phase shall be:
- Enrich data with business logic and semantics
- Abstracting Business Domain Models from the underlying physical Data Model
- Foster standardization of data into Business Domain Models
- Describe the relationships between the models
We will see the the later phases, that the relationship semantics will become one major pillar to arrive richer analytical models.
Data Analysis and Interpretation
This phase of the Analytics journey is focusing on supporting user to interpret and understand data and to derive insights.
Getting the numbers such "Total Revenue in 2021" is okay, however, this is not the end of the journey yet. One interviewed customer said "In fact my job as an business analyst has just started". With this KPI customers can describe what happened in the past. But they will fail to derive concrete business decision and strategy to improve in the future.
What he needs is to dive one level deeper to understand the root causes and key drivers for the figures and get a holistic view on them.
For instance, to understand better the KPI "Total Revenue in 2021", we might have to analyze also the revenue forecast, determine the pattern for customer churns, calculate the potential success rate of an important deal, derive correlations between purchasing behavior and marketing spend. Or sometimes we just require to acquire external data from market or from the competitors.
Hence, we are collecting additional insights of the very same business context in order to sharpen and/or generate new insights.

Using the classic analytical tools are no longer sufficient. Instead we require new technics from data mining and machine learning domain. We need new categories of tools to enable customers to run simulations or what-if scenarios.
Eventually, we need to enhance our semantic model by describing the relationships and correlations between the measures.
Let us summarize the main targets of this phase:
- Explain and interpret data by combining facts and insights of the same business context
- Utilizing analytical and data mining technics to gain new related facts, such as Root Cause Analysis, Trend Analysis, Outlier Analysis, Forecasting, etc.
- Model relationships and correlations between gained KPIs and measures
- Run simulations and what-If scenarios
While in the first two phases we were rather processing data that has been produced in the past in the history (backward looking analysis), in this phase we need to go one step further and create also new dataset and semantics (forwards looking analysis).
Data to Action / Insights to Action
The last phase of the journey is about translating insights into action. That means using the gained information to make concrete business decisions and drive business processes.
For that we have to extend our existing model by telling which facts and/or combination of insights triggers which specific business action. Let's take the example of a smart fridge: one can set a program to order new bottles of milk (action) when only 1 bottle is left:

There are three main components in this model:
- insight: running out of milk
- threshold: 1 bottle of milk
- action: order new bottle of milk
Of course, this is a very simple example to explain the interplay the between gained insights and action. In the business world there are many more dependencies and intercorrelations of facts which needs to be determined before a concrete business action can be recommended.
Hence, the quality of such as recommendation system is highly dependent on the modeling quality of the identified combination of insights plus their thresholds, mapped against the business transaction.
The system has to be improved over time through continuous optimization and learning from historic data, and at same time it is required to discover new correlations between insights and actions. When applying that right we will have a system, which not only can recommend a decision / action to take, but also explain the reasoning behind. That will help to user and increase the confidence in the decision taking process.
Furthermore, to go one step further, the system could break down a recommendation into risk categories, such as "pessimistic", "optimistic" and "neutral". Each of them has a certain probability of success rate and confidence. With that the business user has to decide which risk he is willing to take and make up a strategy.
Here is an example to illustrate such a "Decision Board" :

Another improvement the integration of system simulations, which allow users to run different What-If scenarios by changing some of the parameters and thresholds of the model. With that user can emulate different actions and let the system calculate the result for that specific configuration.
These are just a few proposals to improve the decision taking process and make it easier for business users. And there is for sure enough room to work on a decision system support.
The entire domain of recommendation system lays down the foundation for process automation. With predefined rules the system can push and trigger different business transactions and processes without human interaction. Hence, only on preconfigured cases users will be conducted for further processing. Eventually, that will make the business running more efficient and save costs.
The goals of this phase are:
- Drive “From Insights to Action” paradigm
- Support of decision taking process with recommendations
- Run simulations and What-If scenarios
- Propose recommendations at various risk / confidence level
- Automating business processes and transaction and save costs with customizable rule engines
- Close the loop with business applications
Summary
I hope I could give you an overview on the end-to-end Analytics journey and get a better understanding on the various phases and disciplines. Each phase has its own challenges and need their own treatments and solutions.
Important is that the phases are sequential ordered and can not be skipped. Moreover, they depend and pre-requisite on each other. And you have to resolve them in the entirety to resolve the customers problem in today's data management and analytics domain.
The Analytics journey can be viewed also as an evolution, where data matures step by step from raw data up to true business insights. With each phase the data is enhanced with additional semantics and business logic. That opens up doors for new kind of innovative applications.
Nonetheless, the journey must end by closing the loop between Analytics and the Business Transactional Domain. We have to translate the analytical insights into business process transactions. While as of today, both domains are still regarded as separate worlds, we want to see in the future more solutions (such as recommendation systems, simulations, data driven process automation) on how both domains interplay hand in hand with each other.
- SAP Managed Tags:
- SAP Analytics Cloud,
- SAP Datasphere
Labels:
4 Comments
You must be a registered user to add a comment. If you've already registered, sign in. Otherwise, register and sign in.
Labels in this area
-
ABAP CDS Views - CDC (Change Data Capture)
2 -
AI
1 -
Analyze Workload Data
1 -
BTP
1 -
Business and IT Integration
2 -
Business application stu
1 -
Business Technology Platform
1 -
Business Trends
1,658 -
Business Trends
116 -
CAP
1 -
cf
1 -
Cloud Foundry
1 -
Confluent
1 -
Customer COE Basics and Fundamentals
1 -
Customer COE Latest and Greatest
3 -
Customer Data Browser app
1 -
Data Analysis Tool
1 -
data migration
1 -
data transfer
1 -
Datasphere
2 -
Event Information
1,400 -
Event Information
75 -
Expert
1 -
Expert Insights
177 -
Expert Insights
352 -
General
1 -
Google cloud
1 -
Google Next'24
1 -
GraphQL
1 -
Kafka
1 -
Life at SAP
780 -
Life at SAP
14 -
Migrate your Data App
1 -
MTA
1 -
Network Performance Analysis
1 -
NodeJS
1 -
PDF
1 -
POC
1 -
Product Updates
4,575 -
Product Updates
395 -
Replication Flow
1 -
REST API
1 -
RisewithSAP
1 -
SAP BTP
1 -
SAP BTP Cloud Foundry
1 -
SAP Cloud ALM
1 -
SAP Cloud Application Programming Model
1 -
SAP Datasphere
2 -
SAP S4HANA Cloud
1 -
SAP S4HANA Migration Cockpit
1 -
Technology Updates
6,871 -
Technology Updates
489 -
Workload Fluctuations
1
Related Content
- What’s New in SAP Analytics Cloud Release 2024.10 in Technology Blogs by SAP
- SAP Analytics Business Intelligence Statement of Direction – May 2024 update in Technology Blogs by SAP
- Unleashing the Power of Custom Widgets in SAP Analytics Cloud in Technology Blogs by Members
- Watch the SAP BW Modernization Webinar Series in Technology Blogs by SAP
- Inside SAP: Discover How SAP’s IT Drives Transformation and Innovation in Technology Blogs by SAP
Top kudoed authors
| User | Count |
|---|---|
| 20 | |
| 11 | |
| 9 | |
| 9 | |
| 8 | |
| 8 | |
| 7 | |
| 6 | |
| 6 | |
| 6 |