The
SAP ALM Analytics API lets you create dashboards and reports that aggregate data managed by
SAP Cloud ALM and
SAP Focused Run. It comes with OData and REST endpoints exposing ALM analytics data.
The SAP ALM analytics API is documented in the
SAP API Business Hub.
With the ALM plug-in for REST interface you can connect your
SAP Cloud ALM tenants or your
SAP Focused RUN instances and get data in
table format or
time-series format to generate new insights into your various ALM processes.
In this blog series, we will show how to use the SAP ALM analytics with the
ALM Grafana plug-in to build
cross use-cases analytics dashboards.
The first blog of this series begins with an introduction to the main concepts of the ALM Analytics API.
Data Providers
Data providers are used to model all data managed by the SAP ALM analytics API. They represent the data sources for your information by unifying access to the data created in your SAP ALM products.
Data providers correspond to the different ALM
BUILD and
RUN use-cases. For instance,
System Monitoring is one of the SAP Focused Run data providers. SAP Cloud ALM also defines data providers for
Tasks or
Projects.
The data model used in the SAP ALM Analytics API is a
dataset organised in a
row-column table structure that unifies both time series and table query results.
Each
column in the dataset is associated with a
dimension. A dimension usually represents an attribute of specific ALM entities (eg: project name for projects, scope name for tasks, ..).
Dimensions can be of type
Metrics when they represent the measurements of a time series, or of type
Timestamp when they represent the timestamp of a time series.
Each
row in the dataset is a datapoint of a time series.

Aggregation
Data Providers are responsible to combine and aggregate measurements into single values to manage the time resolutions of time-series. There are several ways to aggregate time series data.
- Average returns the sum of all values divided by the total number of values.
- Min and Max return the smallest and largest value in the collection.
- Sum returns the sum of all values in the collection.
Queries
Queries are the vehicle to interact with the different data providers to collect datasets by filtering the dimensions and the values returned by the data sources.
A query defines the following information:
- Provider: The provider name identifies the ALM data source.
- Name: The query name represents the legend of the time series.

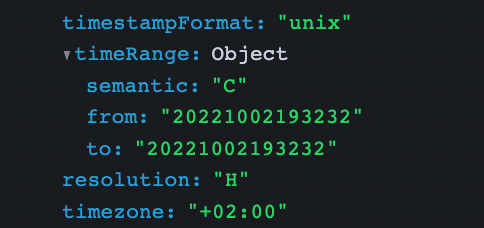
- Time Selection: This is the period and granularity used to create a time-series. It contains two parameters:
- Range: The start and end date of the time series manipulated either with a relative semantic value (eg: L1D, C24H, ..) or with an absolute date range.
- Resolution: Period used for time series aggregation.
- Columns: Format of the dataset returned by the data provider. It defines the list of dimensions and metrics that the data provider should return.
- If no columns are defined, data providers should return all known dimensions.
- if no metric is defined, data provider uses a default measurement.

- Filters: The filters is used to narrow the content of the dataset. The filters structure contains the parameters passed as values for a selected set of dimensions on which the filter should apply.

Dataset Format
The format of the dataset associated with a time series is a row-column table structure:
- Column: Each column corresponds to a dimension of the selected data provider.
- Row: Each row represents a data point in the time-series.

Output Format
The ALM analytics API support 3 format: table, time-series, raw:
The
table format transforms datasets by removing timestamp information.
Raw allows you to visualise datasets without any transformation.
Datasets is transformed into
time-series by creating a time-series for each unique combination of dimensions available in the datasets. This is an automatic drill-down operation. In that case, the name of each individual series adopts the following rules:
- {name}/{dimension}*-{measure}
- {dimension}*-{measure} if no name is specified.

In the next
blog we will create a project dashboard based on the SAP ALM Analytics API.
Thanks for reading.
