
- SAP Community
- Products and Technology
- Technology
- Technology Blogs by SAP
- SAP Analytics Cloud planning with Microsoft Excel
Technology Blogs by SAP
Learn how to extend and personalize SAP applications. Follow the SAP technology blog for insights into SAP BTP, ABAP, SAP Analytics Cloud, SAP HANA, and more.
Turn on suggestions
Auto-suggest helps you quickly narrow down your search results by suggesting possible matches as you type.
Showing results for
Advisor
Options
- Subscribe to RSS Feed
- Mark as New
- Mark as Read
- Bookmark
- Subscribe
- Printer Friendly Page
- Report Inappropriate Content
07-11-2022
5:51 PM
 In this article, I would like to describe the use of the SAP Analytics Cloud within Office 365. Even though the web browser is the central strategic user interface of SAP Analytics Cloud, Microsoft Excel can be used very well with the SAP Analytics Cloud Microsoft Excel Add-in for data analysis and planning.
Problem definition:
In the area of planning and forecasting, for example in sales planning or also in cost planning, the typical business user will often have the option of using Microsoft Excel for data analysis and planning data collection. Especially in controlling, Excel is often used as a user interface. The handling of Excel is often familiar to business users and offers a variety of possibilities to integrate additional site calculations into the plan data collection process.
Technical Solution:
SAP Analytics Cloud already provides a Microsoft Excel Add-in for Office 365 which can be used within on-premises Excel as well- as in online web-based Excel. Data entry and planning can be done directly in Excel with an online connection to the used SAP Analytics Cloud tenant as well as offline planning. With the SAP Analytics Cloud product update in Q1/2022 a new SAP Analytics Cloud Excel formula SAP.GETDIMENSIONFILTER was implemented. This formula enriches the existing functionality and allows the display and setting of a table filter directly from the Microsoft Excel worksheet for any dimension or property. Now it is possible to use cell-based formulas to retrieve or set dedicated filters on a dimension's members from an SAP Analytics Cloud grid in Microsoft Excel. The result is a simple and quick report change with dedicated filters for the members of a dimension that can be retrieved and set directly in the grid using a native Microsoft Excel formula.

SAP Analytics Cloud Microsoft Excel Add-in for Office365
By using the Excel Add-In a new toolbar is available which allows the user to sign in at a SAC tenant. In addition, it is possible to add tables into the excel sheet, as well as write back values to the SAC data source. Furthermore, the "Designer Panel" can be used to control, steer, and filter the dimensions which are displayed within the grid.

Sign in and Add Table dialog in SAP Analytics Cloud Excel
The used excel sheets can be modified with all Excel capabilities like inserting picture, logos, and pictograms etc.

Data Source table selection dialog
To add a new table into the sheet the “Add Table” dialog can be used. Now the data models inside the connected SAP Analytics cloud tenant can be selected and inserted into the excel sheet.

SAP Analytics Cloud table on a excel sheet
During the insert process the position of a table can be selected at any cell on the sheet. Within the "Designer Panel", the dimension of the data model can be added to the rows and columns. Additional it is possible to filter on elements, on hierarchies, display and property option can be used as well. With clicks direct on the elements in the table it is possible to expand or to collapse the dimension and to filter it in the designer panel.
To have more flexibility and user-friendly selection possibilities inside the used dimension it is possible to use SAP Analytics Cloud Excel formula like: SAP.GETDIMENSIONFILTER, SAP.GETDIMENSIONS and SAP.GETTABLENAME. In the following it will be described how to use these SAP Analytics Cloud Excel formulas. An overview about the new formulas can be found here:
https://help.sap.com/docs/SAP_ANALYTICS_CLOUD_OFFICE/29624d6020b74bf8817bb7df398e5cb6/ca578ba65cb847...

SAP.GETTABLENAME dialog
The first step after inserting a data table is to add the SAP Analytics Cloud Excel formula SAP.GETTABLENAME. For this purpose, a cell can be selected and with insert function SAP.GETTABLENAME a dialog opens to select a cell inside the used SAP Analytics Cloud table. The input parameter for the SAP.GETTABLENAME formula is a Cell, enter a cell that is part of the table.

SAP.GETTABLENAME dialog
As a result, the formula returns the name of the selected table which can be used as an input parameter for the formula SAP. GETDIMENSIONS.

SAP.GETDIMENSIONS dialog
This function returns all dimensions which are used in the SAP Analytics Cloud model which is used as the data source for the selected table. The input parameter for the SAP.GETDIMENSIONS formula is a Table: Enter the table name (result of formula SAP.GETTABLENAME), Display: specify how the dimensions are displayed in the sheet. You have the following options: 0 for ID, 1 for description, 2 for ID and description (default), 3 for description and ID, 4 for full ID. Orientation: Specify the orientation of the list, 0 for vertical (default), 1 for horizontal, if both, ID and description, are displayed, the results are displayed accordingly in 2 rows or 2 columns. Sort_order: Specify the sorting order of the dimensions, 0 for no sorting (default), 1 for ascending sorting, 2 for descending sorting.

SAP.GETDIMENSIONS dialog result
The result will be a list of all used dimensions in the related data model like shown in the picture above. The name of the dimension and the name of the table can be used for the formula SAP.GETDIMENSIONFILTER.
This formula can be used as a filter for the related dimension to steer the content of the table. Best practice is to select a cell in which the formular should be used on top of the table. Doing it like this it is very easy for the business user to filter directly by clicking the cell which includes the formula SAP.GETDIMENSIONFILTER.

SAP.GETDIMENSIONFILTER dialog
The input parameters for the formular are the following: Table, Enter the table name. Dimension, Enter the dimension name. Member_display, specify how the members of the dimension are displayed in the sheet. You have the following options: 0 for ID, 1 for description, 2 for ID and description (default), 3 for description and ID, 4 for full ID. Selection_display, Specify the selection display: 0 for ID, 1 for description, 2 for ID and description, 3 for description and ID, 4 for display nothing (default). Orientation, Specify the orientation of the list: 0 for vertical (default), 1 for horizontal, if both, ID and description, are displayed, the results are displayed accordingly in 2 rows or 2 columns. Separator, Enter the separator you want to use between ID and description.

SAP.GETDIMENSIONFILTER parameter
Now the function SAP.GETDIMENSIONFILTER returns the filter for a dimension and an icon to open the filter dialog from the sheet. The cell with the formula contains a pencil symbol as well as displayed in front of the dimensions name. When the clicks on the symbol, the "Member Selector" menu will open. The user can set filters within the "Member Sector" menu.
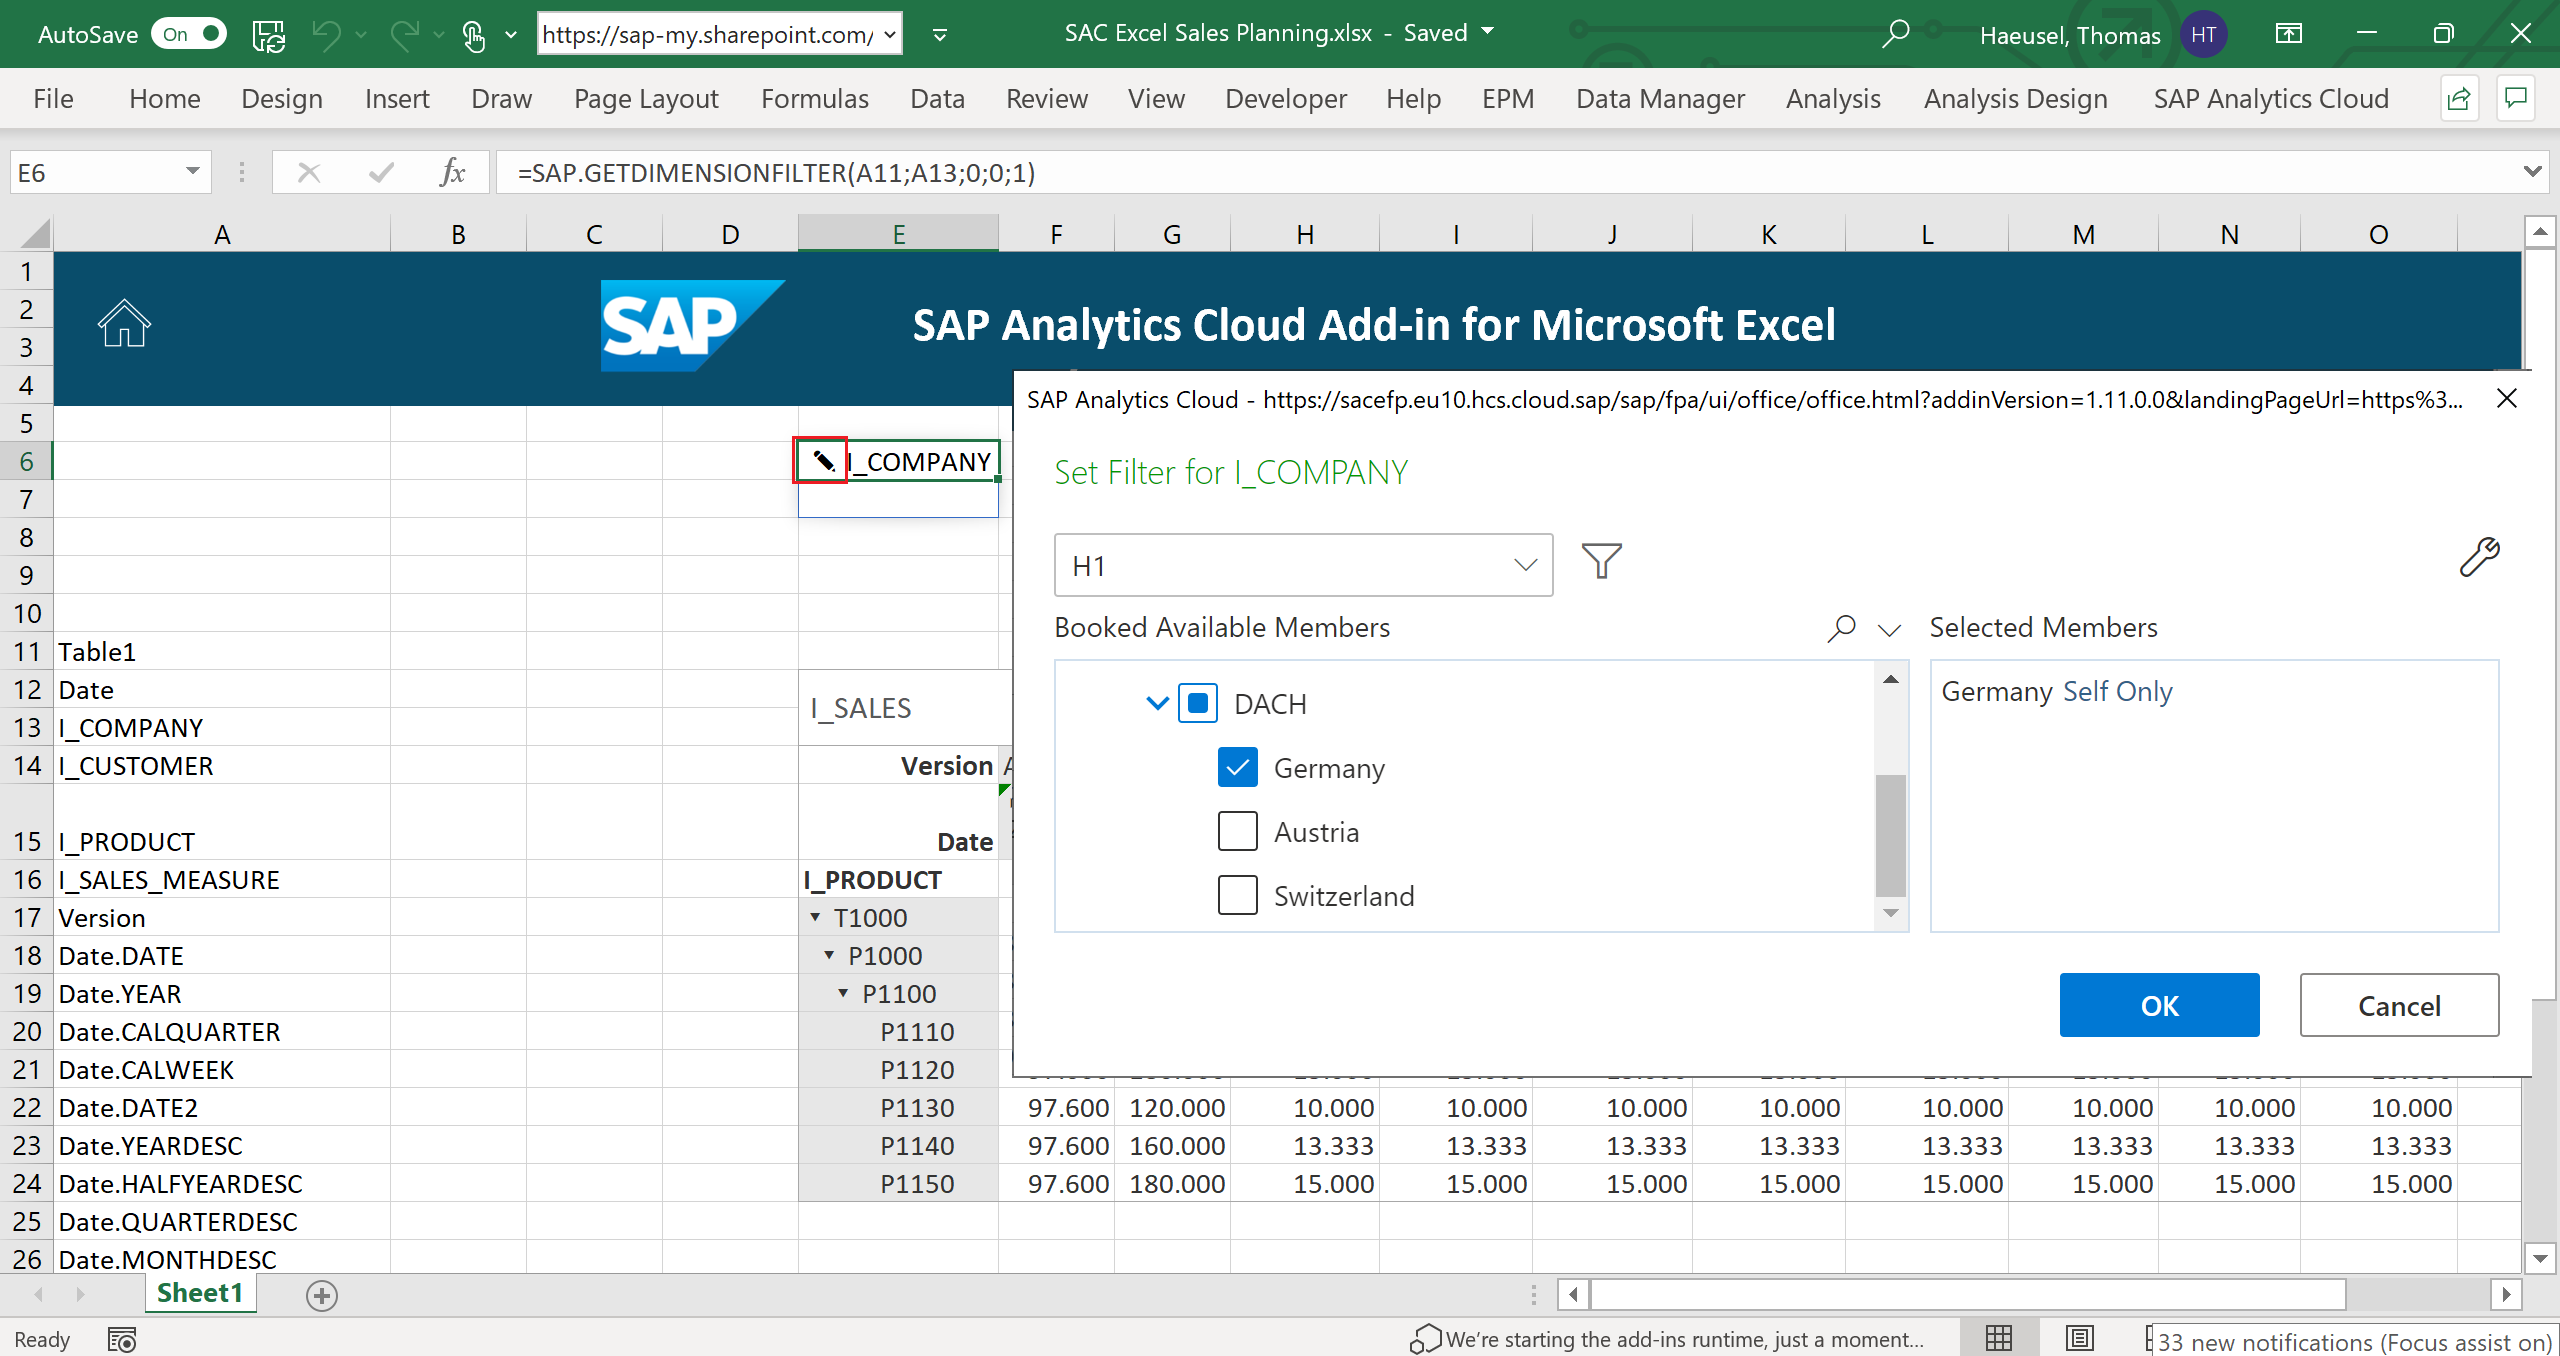
Member Selector dialog
Now it is possible to do the member selection for every dimension which is used for the data in the table with the SAP.GETDIMENSIONFILTER and the "Member Selector" menu. The selection is possible for dimensions that are displayed in the rows and columns as well as for those that are included in the model but are only used as filters for the table.

SAP Analytics Cloud with multiple Member Selector
If all the needed "Member Selector" formulas are included, the not needed rows and columns can be hidden to brighten up the excel sheet to provide a better user experience.

SAP Analytics Cloud excel data entry sheet
With this SAP Analytics Cloud excel sheet it is now possible to easily analyze data and is also possible to do business planning by entering data. This can be done on aggregated and granular level directly into the planning data model inside SAP Analytics Cloud. The member selection can be done within the member selection dialog based on the cells with the SAP.GETDIMENSIONFILTER formula as well with the Designer panel by entering the values directly into the table, it is possible to write back directly into the SAP analytics Cloud model. Additional it is possible to use secondary or side calculations to link the results into any cell of the table. By this approach it is possible to write back calculated values, what is often wished by business user in the controlling department.
Outlook:
The write back function is always possible if there exists an online connection to the SAC Analytics Cloud tenant. By using that method, it is also possible to realize an offline planning process by linking data entry values to the SAP Analytics Cloud excel table. By this way it is possible to change values which are linked to the table and write back to the SAP Analytics Cloud tenant when the online connection is re-established. A perfect approach to stay productive when traveling and to write back if internet access is available again.
- SAP Managed Tags:
- SAP Analytics Cloud,
- SAP Analytics Cloud for planning
Labels:
4 Comments
You must be a registered user to add a comment. If you've already registered, sign in. Otherwise, register and sign in.
Labels in this area
-
ABAP CDS Views - CDC (Change Data Capture)
2 -
AI
1 -
Analyze Workload Data
1 -
BTP
1 -
Business and IT Integration
2 -
Business application stu
1 -
Business Technology Platform
1 -
Business Trends
1,658 -
Business Trends
95 -
CAP
1 -
cf
1 -
Cloud Foundry
1 -
Confluent
1 -
Customer COE Basics and Fundamentals
1 -
Customer COE Latest and Greatest
3 -
Customer Data Browser app
1 -
Data Analysis Tool
1 -
data migration
1 -
data transfer
1 -
Datasphere
2 -
Event Information
1,400 -
Event Information
68 -
Expert
1 -
Expert Insights
177 -
Expert Insights
311 -
General
1 -
Google cloud
1 -
Google Next'24
1 -
GraphQL
1 -
Kafka
1 -
Life at SAP
780 -
Life at SAP
13 -
Migrate your Data App
1 -
MTA
1 -
Network Performance Analysis
1 -
NodeJS
1 -
PDF
1 -
POC
1 -
Product Updates
4,576 -
Product Updates
355 -
Replication Flow
1 -
REST API
1 -
RisewithSAP
1 -
SAP BTP
1 -
SAP BTP Cloud Foundry
1 -
SAP Cloud ALM
1 -
SAP Cloud Application Programming Model
1 -
SAP Datasphere
2 -
SAP S4HANA Cloud
1 -
SAP S4HANA Migration Cockpit
1 -
Technology Updates
6,873 -
Technology Updates
444 -
Workload Fluctuations
1
Related Content
- SAP Analytics Cloud: New ‘Present’ mode Settings Impact on SAP's Planning Business Content in Technology Blogs by SAP
- Hybrid Architectures: A Modern Approach for SAP Data Integration in Technology Blogs by SAP
- What’s New in SAP Analytics Cloud Release 2024.09 in Technology Blogs by SAP
- 入門!SAP Analytics Cloud for planning 機能紹介シリーズ - 通貨換算 in Technology Blogs by SAP
- SAP Analytics Cloud for planning - Set Advanced Filters on Date and Version in Technology Q&A
Top kudoed authors
| User | Count |
|---|---|
| 17 | |
| 17 | |
| 12 | |
| 11 | |
| 9 | |
| 9 | |
| 8 | |
| 8 | |
| 7 | |
| 7 |