Introduction
Good day everyone! In my INAUGURAL (haha) post, I will give a high-level understanding of creating timetables and dimensions to use in your data models and stories.
Understanding Time Dimension
Time dimension refers to the aspect of data, allowing businesses to analyze and interpret information within a specific timeframe. In the context of data analytics, the time dimension is critical for conducting trend analysis, forecasting, seasonality detection, and anomaly detection. SAP Datasphere & SAP Analytics Cloud recognize the importance of time as a fundamental dimension and offers robust features to enhance the analysis and visualization of time-based , as well
as standardization and reusability.
Granularity and Hierarchy
SAP Datasphere & SAP Analytics Cloud provide the flexibility to define time granularity according to your business needs. Whether you require daily, monthly, or yearly granularity, the platform empowers you to configure and align your data at the desired level of detail. Additionally, SAP Datasphere & SAP Analytics Cloud allows you to establish hierarchical relationships within the time dimension, enabling drill-down analysis from higher-level aggregates to finer-grained data.
Time-Based Filtering and Slicing
SAP Datasphere's time dimension functionality includes powerful filtering and slicing capabilities that facilitate focused analysis within specific time periods. With just a few clicks, you can extract data for a specific day, week, month, or any custom time range, enabling you to isolate and investigate time-based patterns, performance fluctuations, and variances.
Visualizing Time-Related Insights
Data visualization plays a vital role in understanding time-based data patterns effectively. SAP Datasphere & SAP Analytics Cloud offer visualization options specifically designed to showcase time-related insights. From interactive charts and graphs to maps and timelines, the platform provides intuitive and visual representations of time-based data, allowing users to grasp trends, correlations and outliers.
Why Create and Use Auto-Generated Time Dimension In SAP Datasphere
In general, the following are reasons for which we recommend using time-dimensions:
- Automatically generated with a few clicks so no overhead to create/export
- Create once in a space and re-use the same for multiple models
- Hierarchy and translation come pre-configured
Even though it is local to only one space, creating them in any space/tenant will result in the same format – so
standardization is the key.
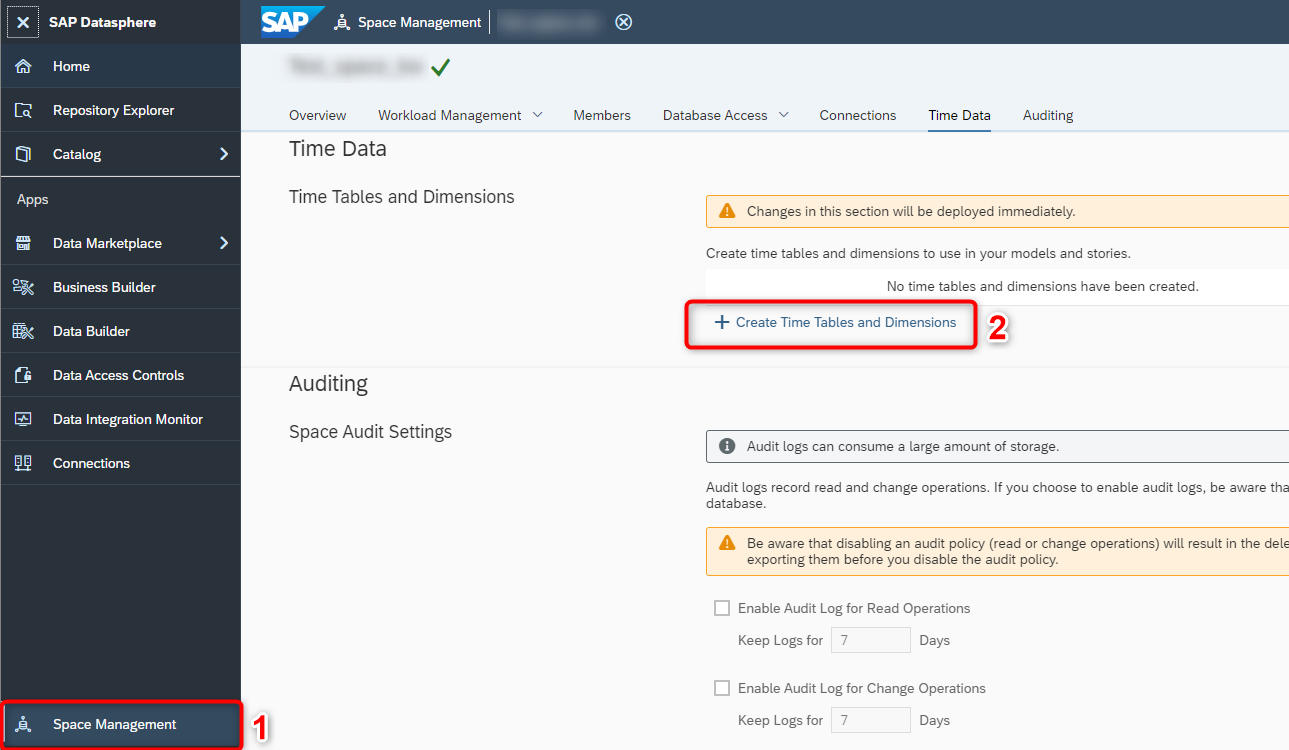
How To Create Time Tables & Dimensions
- Navigate to Space Management (1)
- Within the Time Data section, click (2)
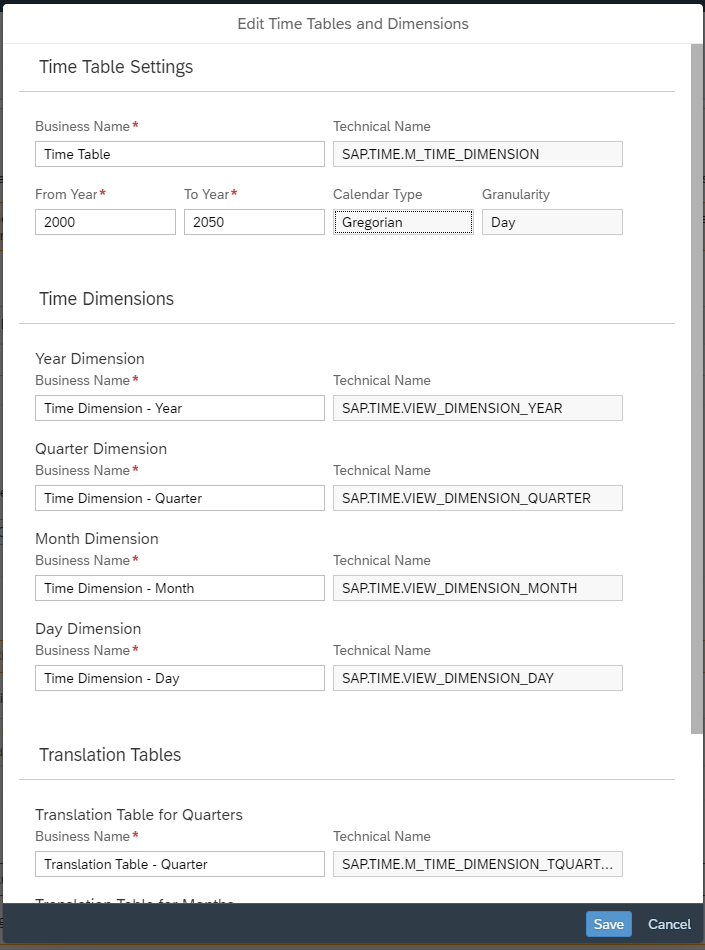
- Once prompted, you’ll have the ability to (as seen below):
- establish the From & To Year range that aligns with your business needs
- update the business name of the Time Table, related time dimensions and translation table objects
- Once you’ve successfully configured the Time Data Object, the time tables & dimensions are deployed immediately and can be found within the Data Builder app, as seen below.

- Once a time dimension object is mapped and added as an association to, for example, a graphical view, you’ll be able to control the granularity of time within a graphical story in SAP Analytics Cloud, as depicted below (in this example, level 2 is Year; level 3 is Year, Month; level 4 is Year, Month, Day).

Summary
In the realm of data analytics, time is a critical dimension that drives decision-making and reveals valuable insights. SAP Datasphere & SAP Analytics Cloud’s time dimension functionality allows Customers & Partners to harness the power of time by providing granular control, advanced analysis techniques, real-time data integration, and intuitive visualizations. By leveraging these capabilities, our Customers & Partners can unlock new possibilities and stay ahead of the competition in a rapidly evolving landscape. Embrace the potential of SAP Datasphere's time dimension functionality and embark on a data analytics journey today.

Find more information and related blog posts on
the topic page for SAP Datasphere. You will find further product information on our Community with various subpages about
Getting Started,
Business Content, the
SAP BW Bridge as well as content for
Best Practices & Troubleshooting and the
FAQ for SAP Datasphere.
