
- SAP Community
- Products and Technology
- Technology
- Technology Blogs by SAP
- Using Build Apps to Create a List Report with Char...
Technology Blogs by SAP
Learn how to extend and personalize SAP applications. Follow the SAP technology blog for insights into SAP BTP, ABAP, SAP Analytics Cloud, SAP HANA, and more.
Turn on suggestions
Auto-suggest helps you quickly narrow down your search results by suggesting possible matches as you type.
Showing results for
Employee
Options
- Subscribe to RSS Feed
- Mark as New
- Mark as Read
- Bookmark
- Subscribe
- Printer Friendly Page
- Report Inappropriate Content
12-08-2023
9:27 PM
Prerequisites:
- Before diving into this guide, it is highly recommended that you review our previous blog post. This comprehensive, step-by-step guide will show you how to harness the power of SAP Build Apps and SAP Build Process Automation Capabilities to automate the import of Emission Data.
- To get started, you'll need to create a destination in your BTP account that points to SAP Sustainability Footprint Management. You can do this by accessing the following Link to download the Retrieve Footprints (Corporate and Products) API.
Introduction:
In today's complex world, we frequently contend with vast datasets, particularly when it comes to reporting scenarios. Effective reporting is important, as it provides us with a high-level overview of specific measures, allowing for a clearer understanding. Leveraging the capabilities of SAP Build Apps, you can now easily create a one-page list report application with the following features:
- Filtering options for key attributes within your dataset.
- Bar Charts & Basic Table tailored to filter specific values for quick insights.
- Pagination functionality, especially when working with extensive datasets.
Business Scenario:
Imagine a Purchasing Manager working within an organization, responsible for overseeing Sustainable Procurement Initiatives. This manager's role includes monitoring monthly sales quantities for the products and categories. To ensure the seamless execution of day-to-day operations, the Purchasing Manager needs a self-service list report customized to his specific requirements.
This report can highlight key attributes and measures such as Monthly Procurement Overview, including Quantity, Pricing, and associated Carbon Impact, among other factors. By creating such a report using SAP Build Apps, the Purchasing Manager can make more informed decisions and better contribute to the organization's sustainability goals.
Let's delve into the process of creating the list report:
Step 1: Create the UI of the Sustainability Report:
a. Page Header
- Adding a text field for the Page Header
b. Filter Section:
- Add a container including 4 text fields for filtering by Material, Plant, Year and Month
- Integrate dropdown fields to allow users to select a filtering option.
- Add a button for 'Apply Filter' to filter the data based on the selected filtering criteria.
c. Charts Section:
- Create two side-by-side containers, each containing a bar chart:
- The first container displays the 'Top 10 Products based on CO2e Quantity.'
- The second container exhibits the 'Top 5 Plants based on Total CO2e Quantity.'
- Create two side-by-side containers, each containing a bar chart:
d. Data Table Section:
- Add a third container for a basic table with a data adapter.
e. Pagination Section:
- At the bottom, place two buttons for pagination:
- One button for 'Previous' page.
- Another button for 'Next' page.
- Include text fields to display the current page number.
- At the bottom, place two buttons for pagination:

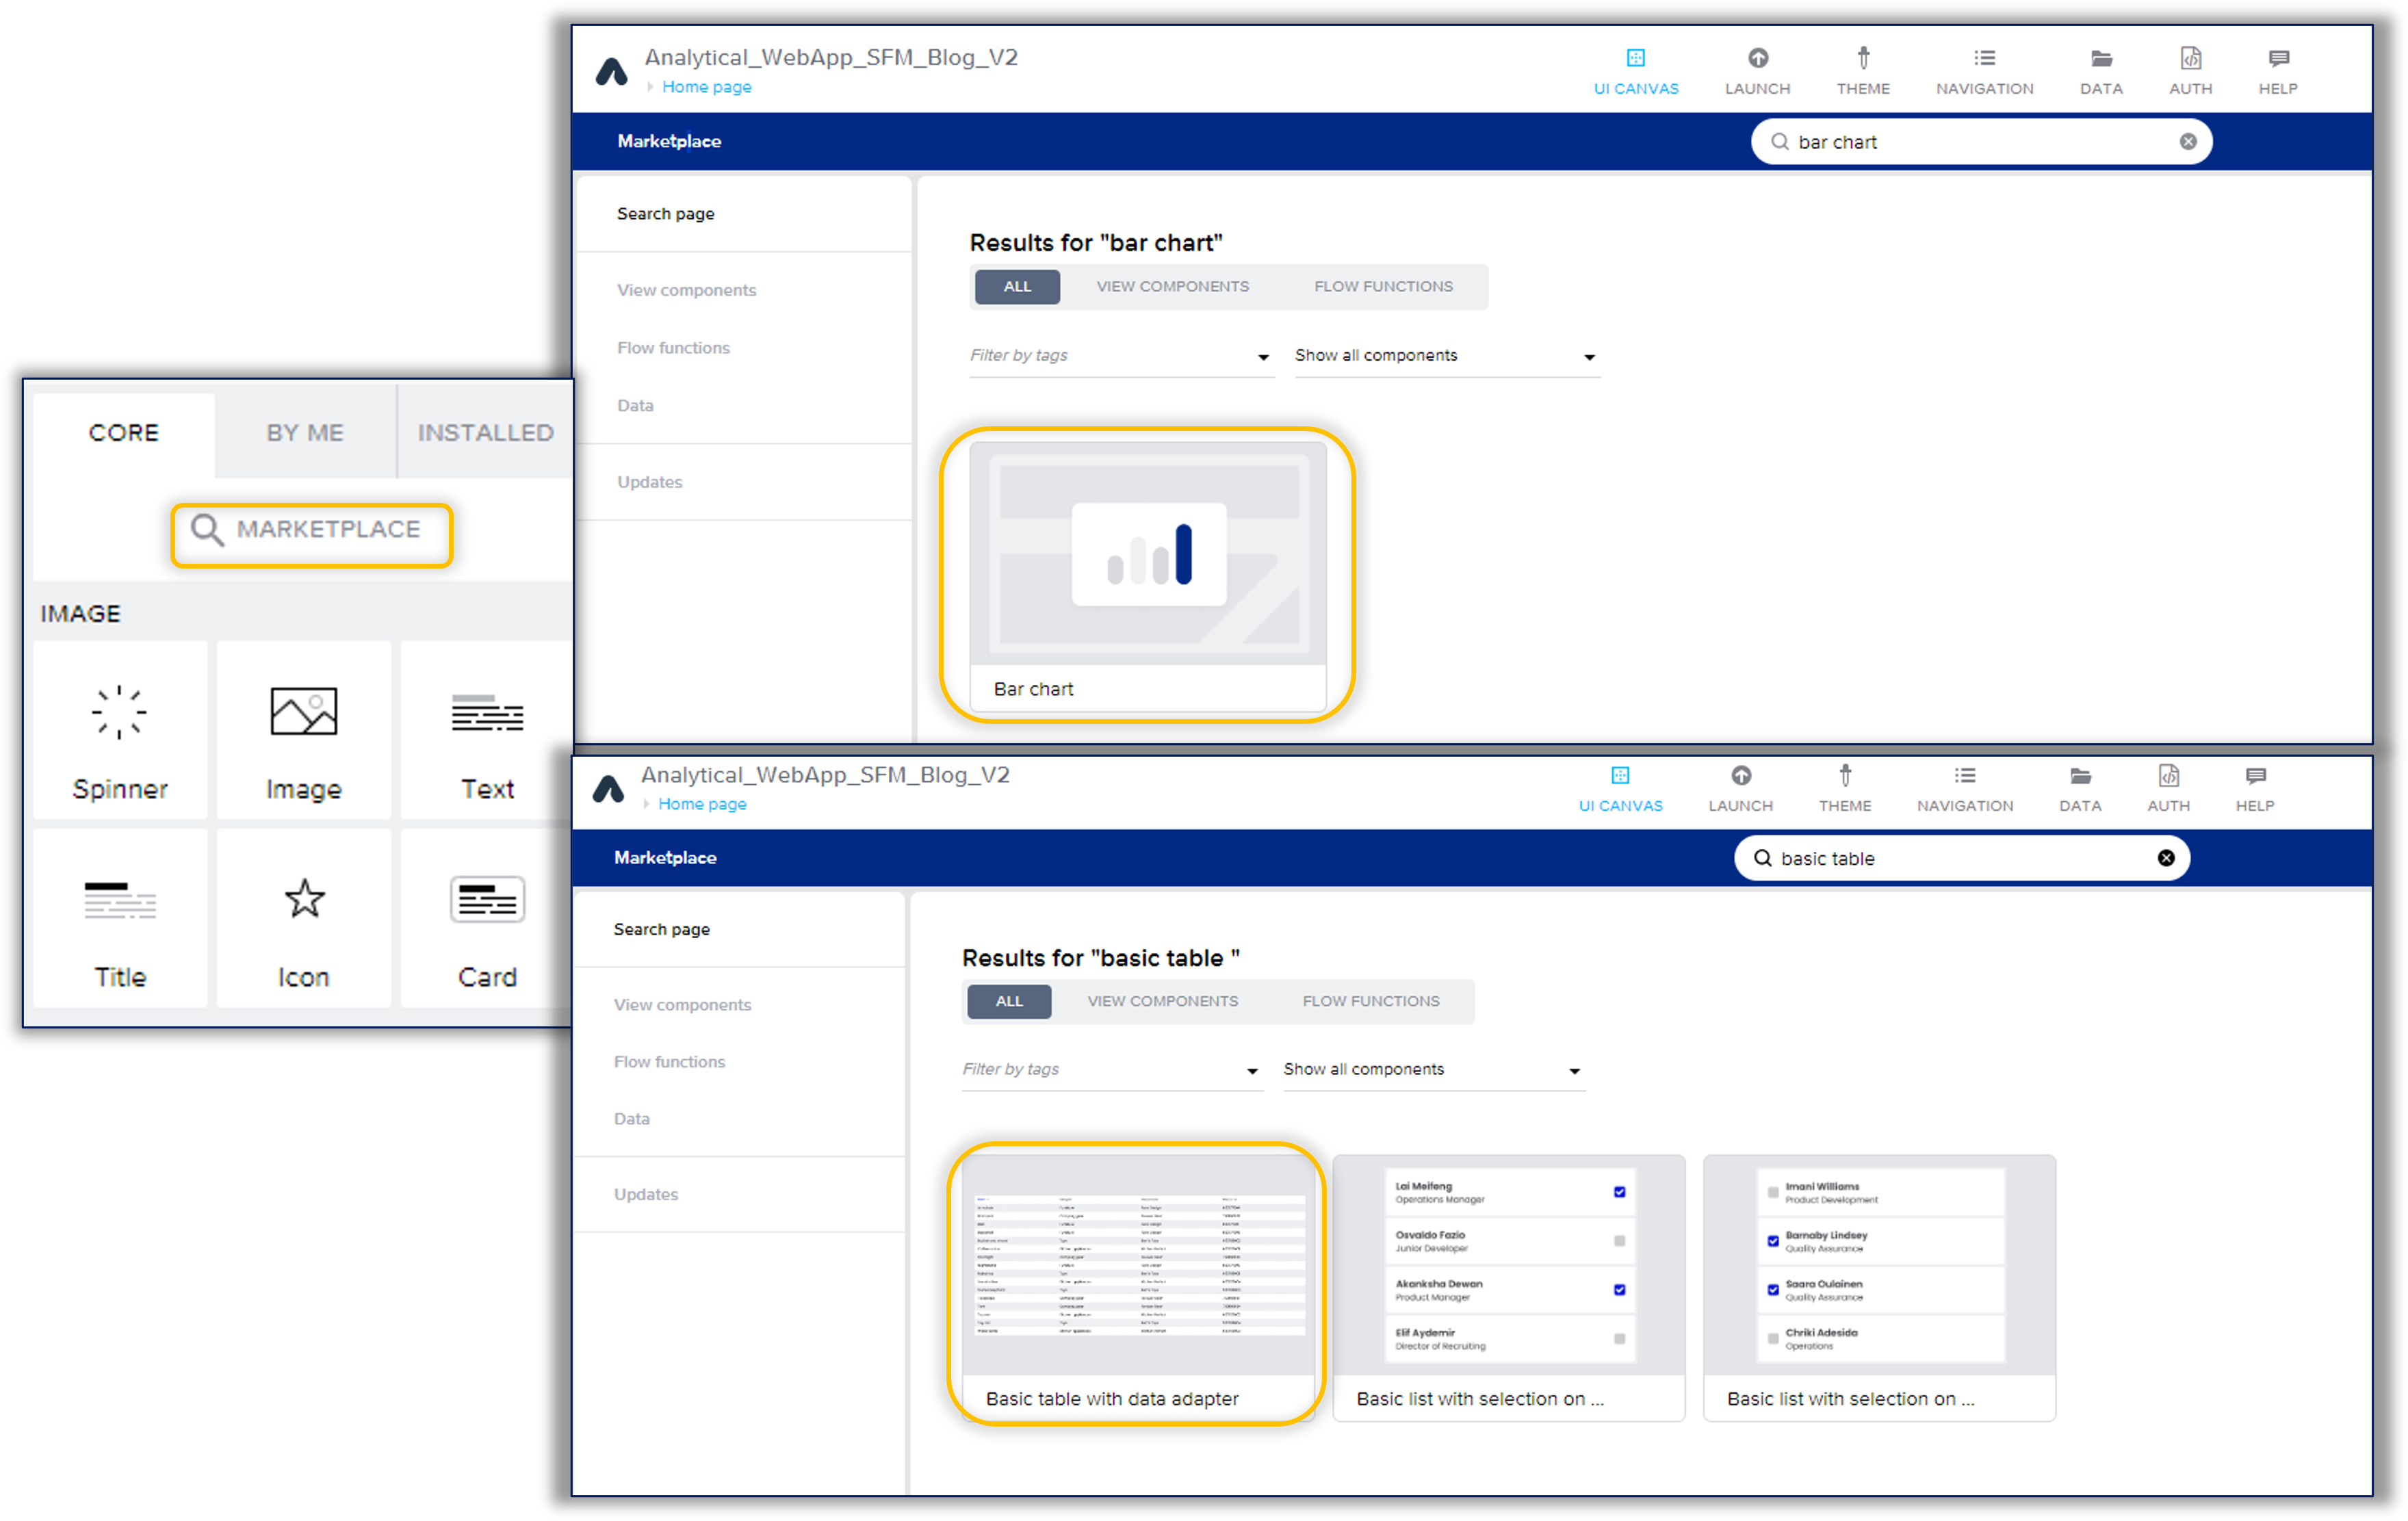
Please note that the Bar charts and Basic Table with Data Adapter are not available in the Core Components section, so you need to install it from the marketplace, as follows:
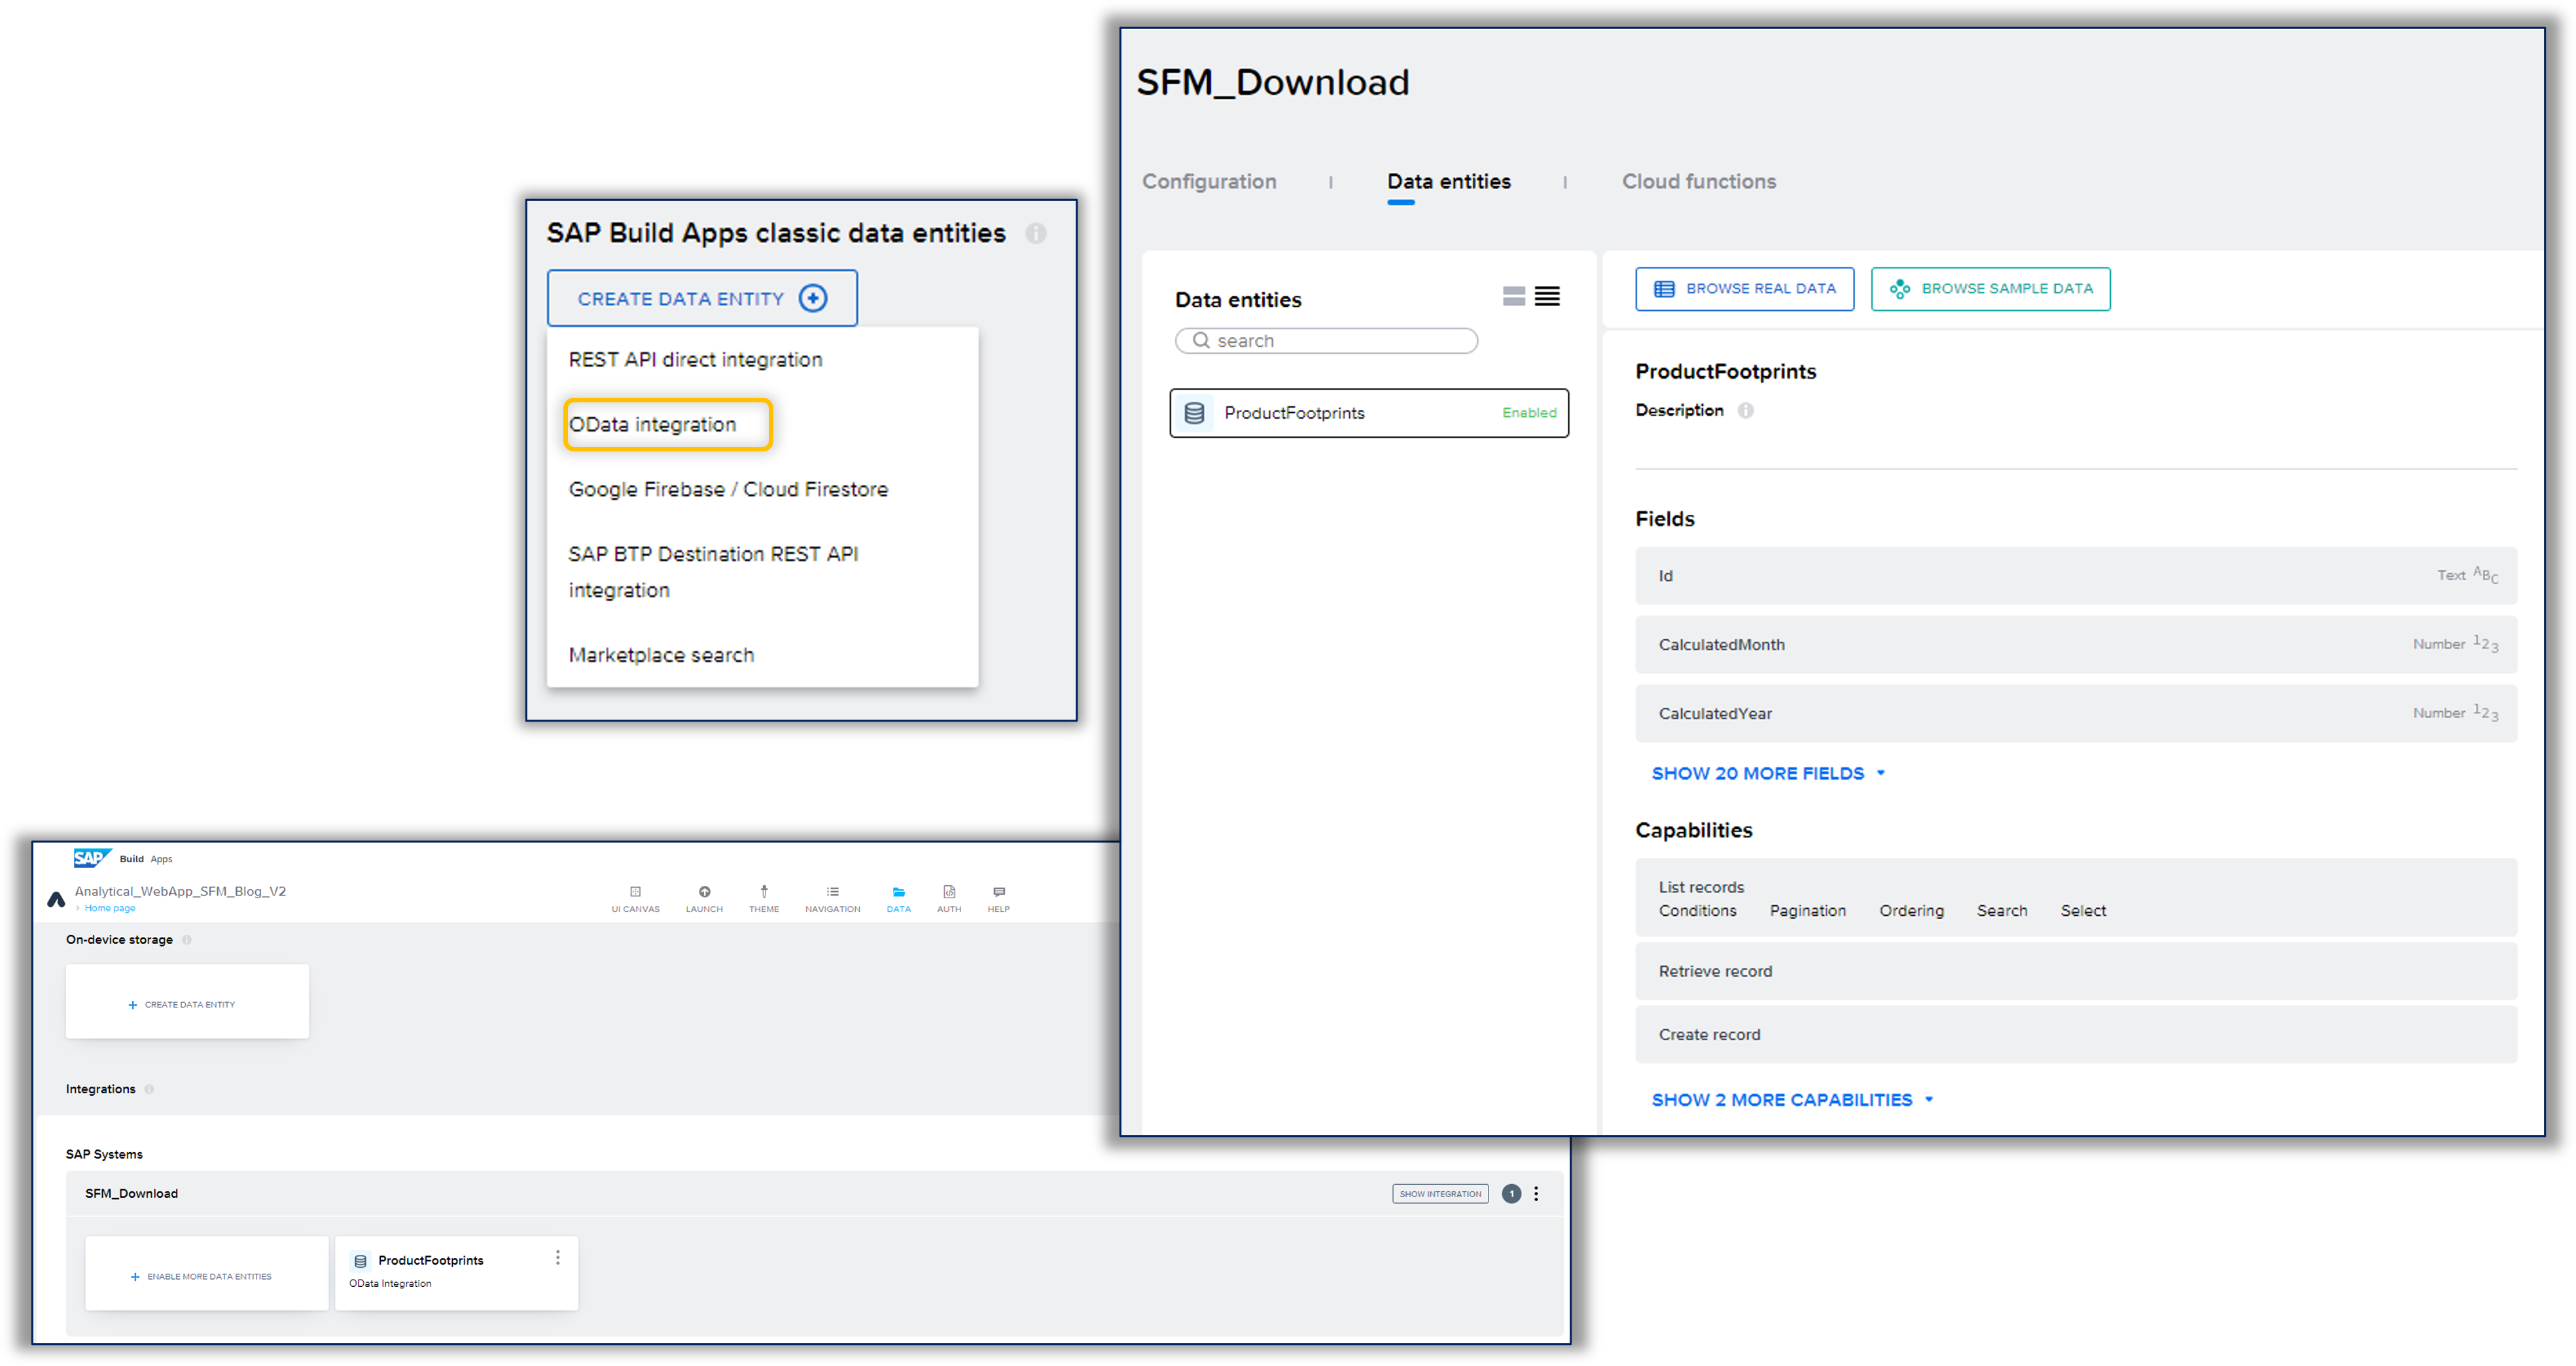
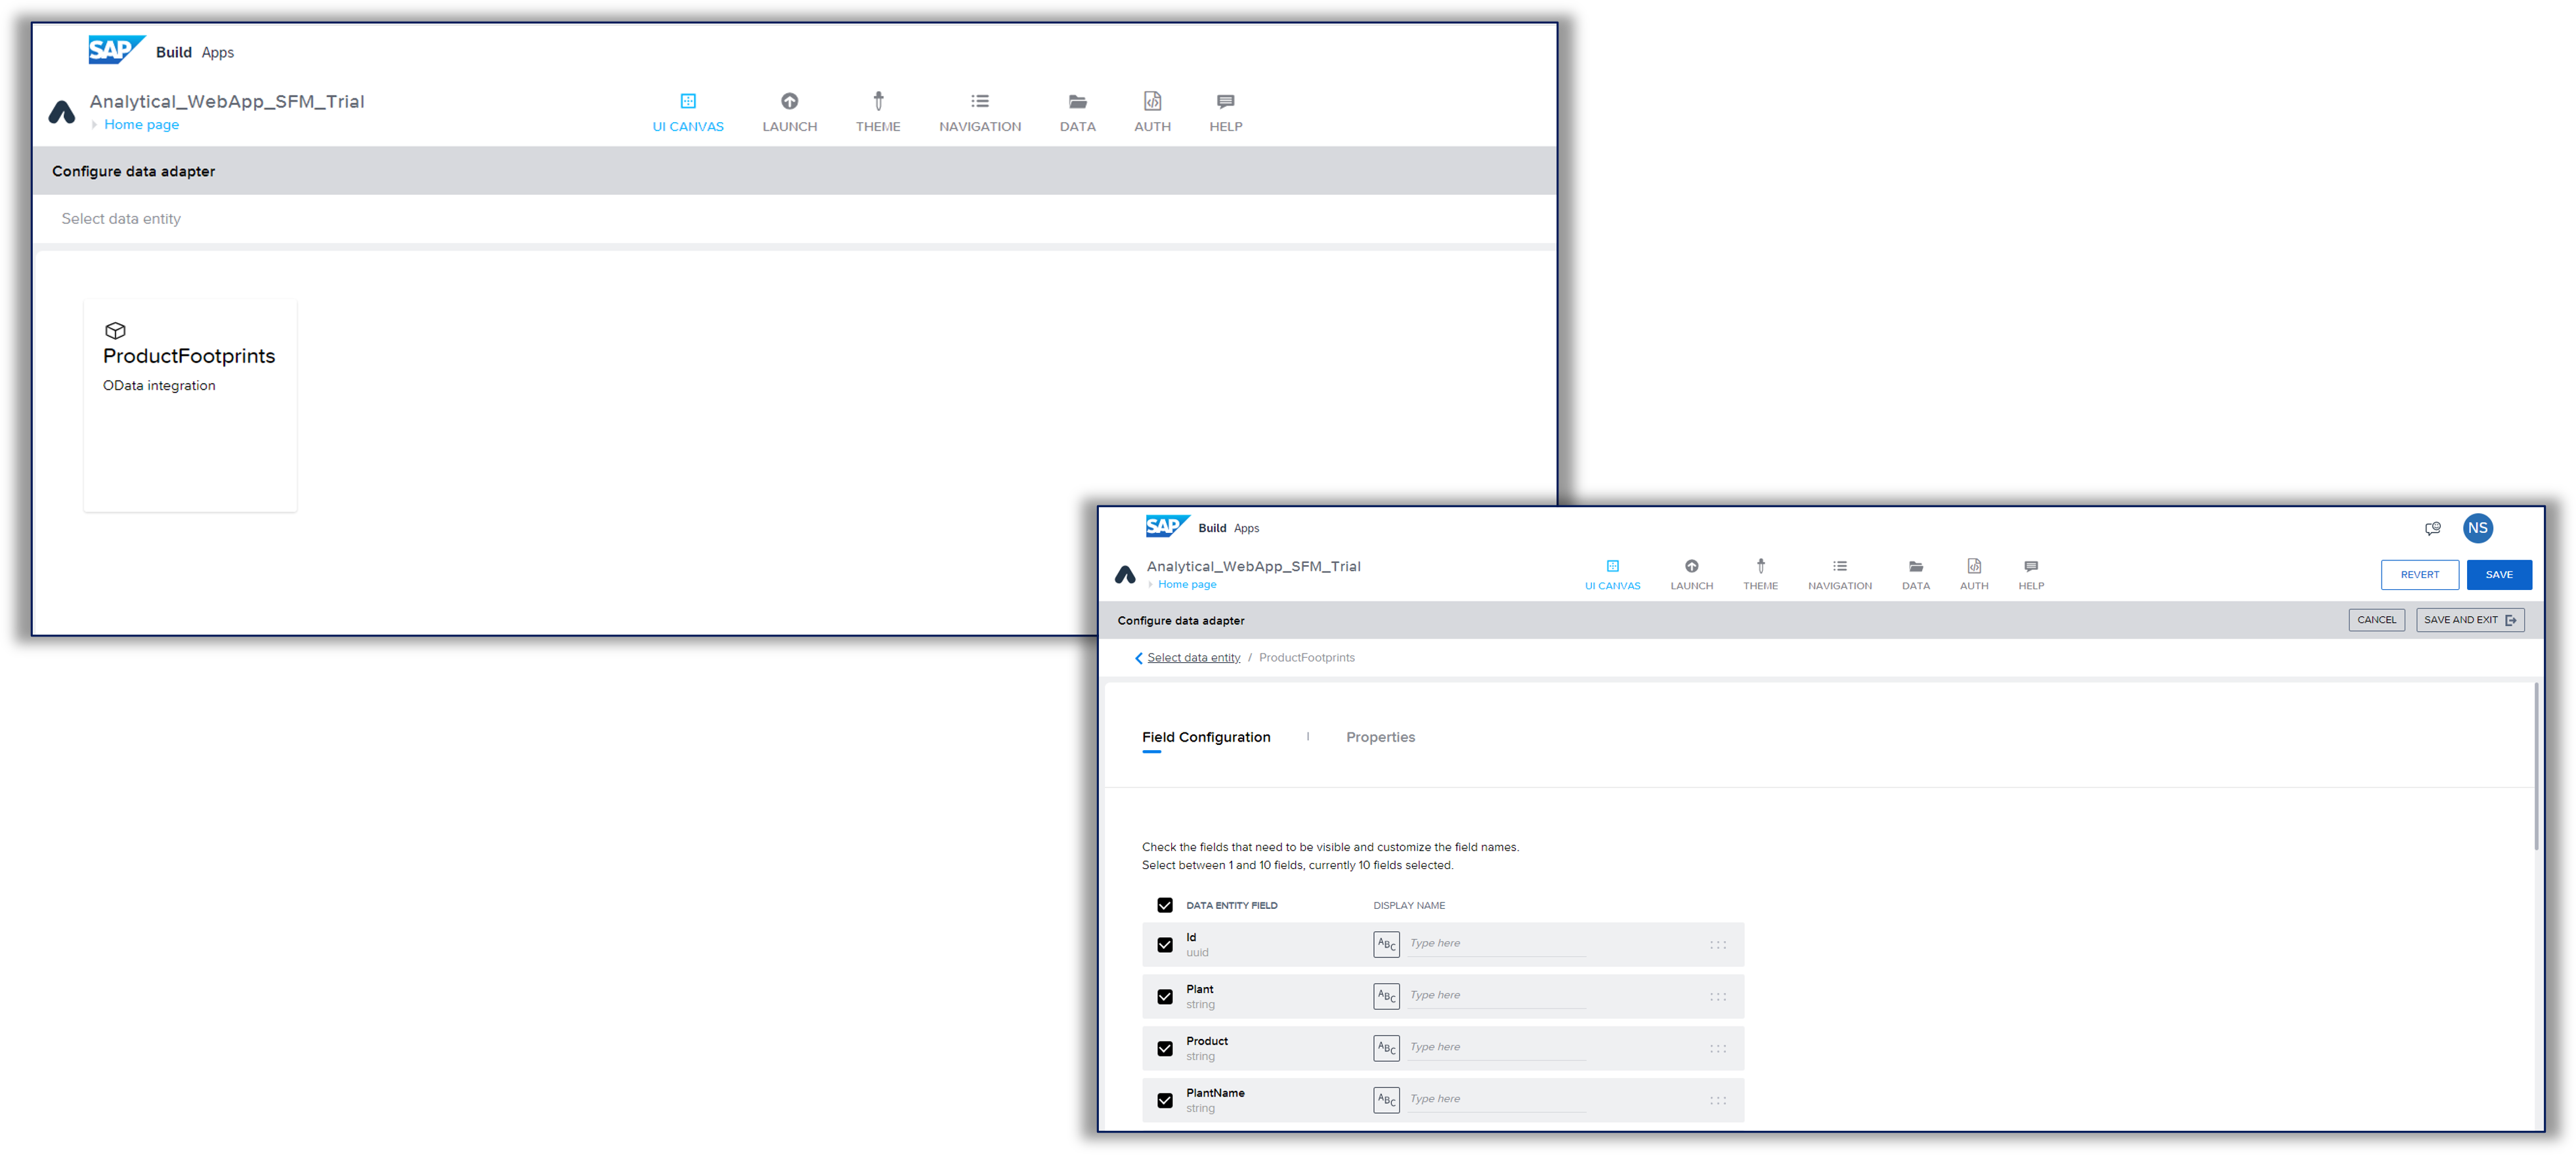
Step 2: Create the Data Resource 'ProductFootprint' by accessing the Data tab > Create Data Entity > select OData integration:
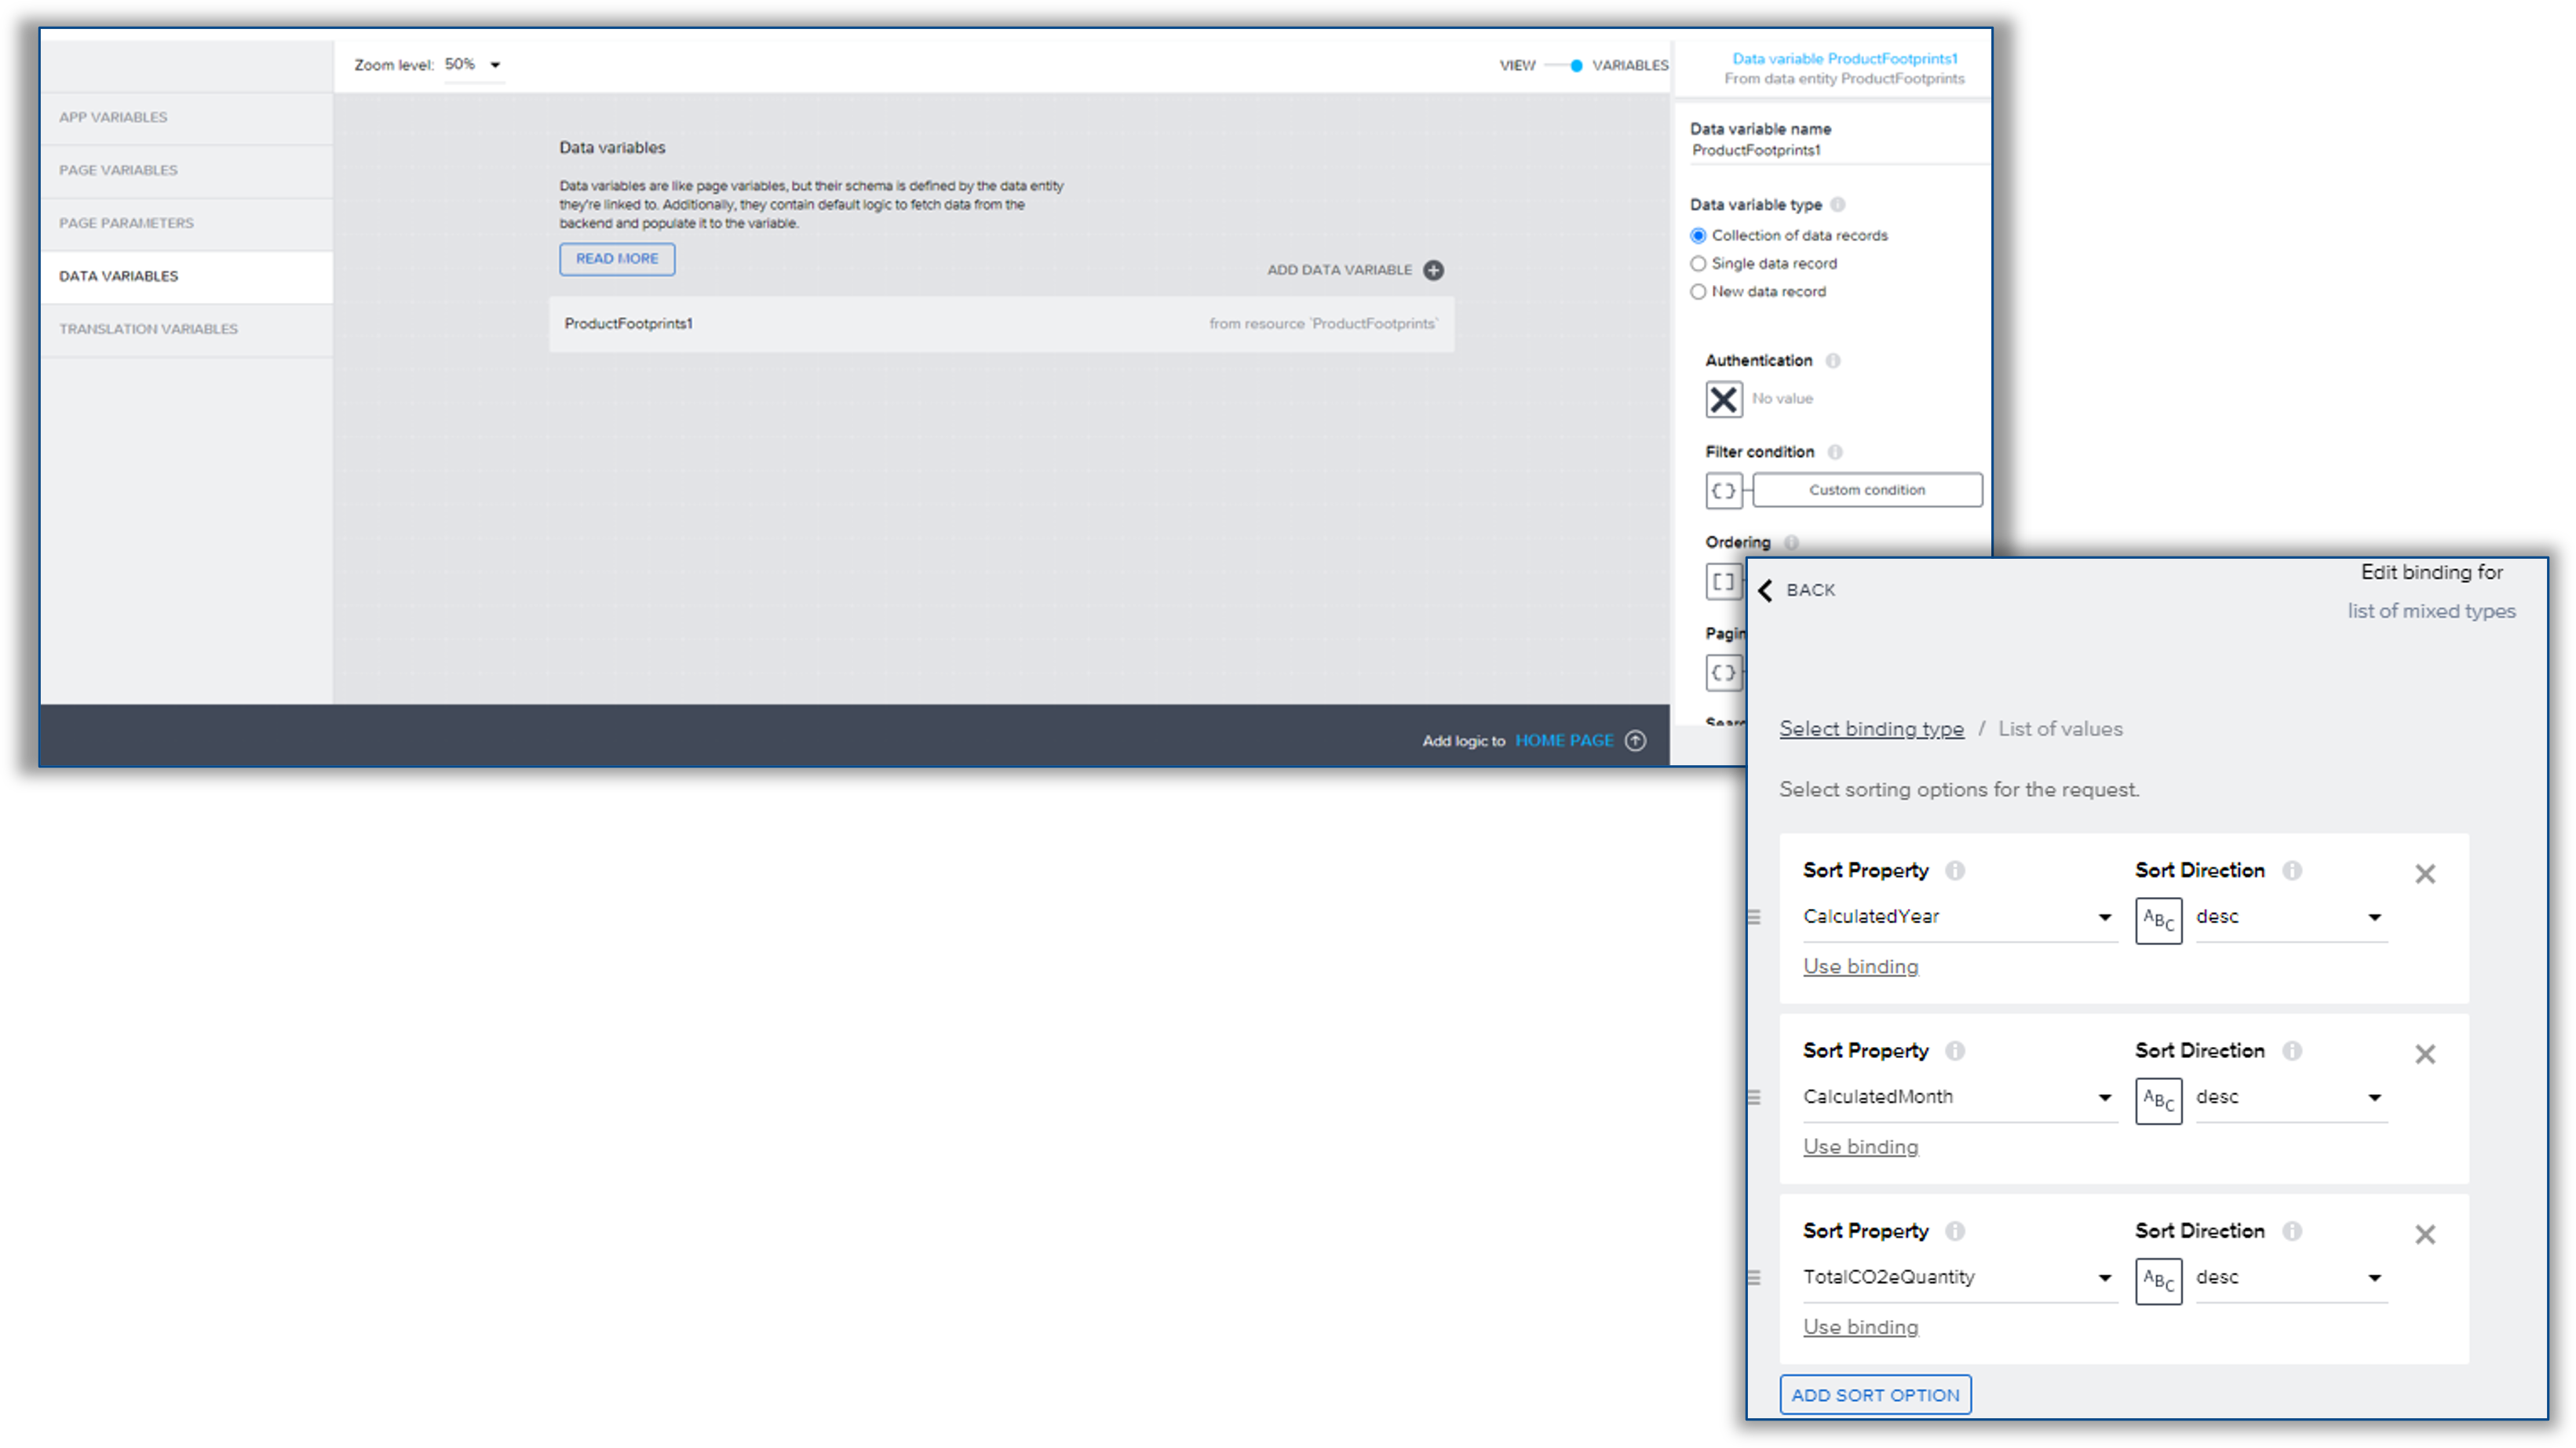
Step 3. Create the Data Variables & Page Variables to store the data, through navigating to the UI canvas and toggling the Variable button on the top right:
a. Add the variable named 'ProductsFootprints1' which is used for the filtering options. To order the selection list of the filters, go to Ordering and order the filtering options descendingly, as follows:
b. Add the variable named 'ProductsFootprints2' to refresh the data of the charts, when a filter option is selected. To achieve that, go to the Filter Condition and add the following formula:
IF( IS_EMPTY(pageVars.filterCondition),{type: "and", conditions: [{type: "greater", value: 0, property: ["TotalCO2eQuantity"]}]}, {type: "and", conditions: pageVars.filterCondition})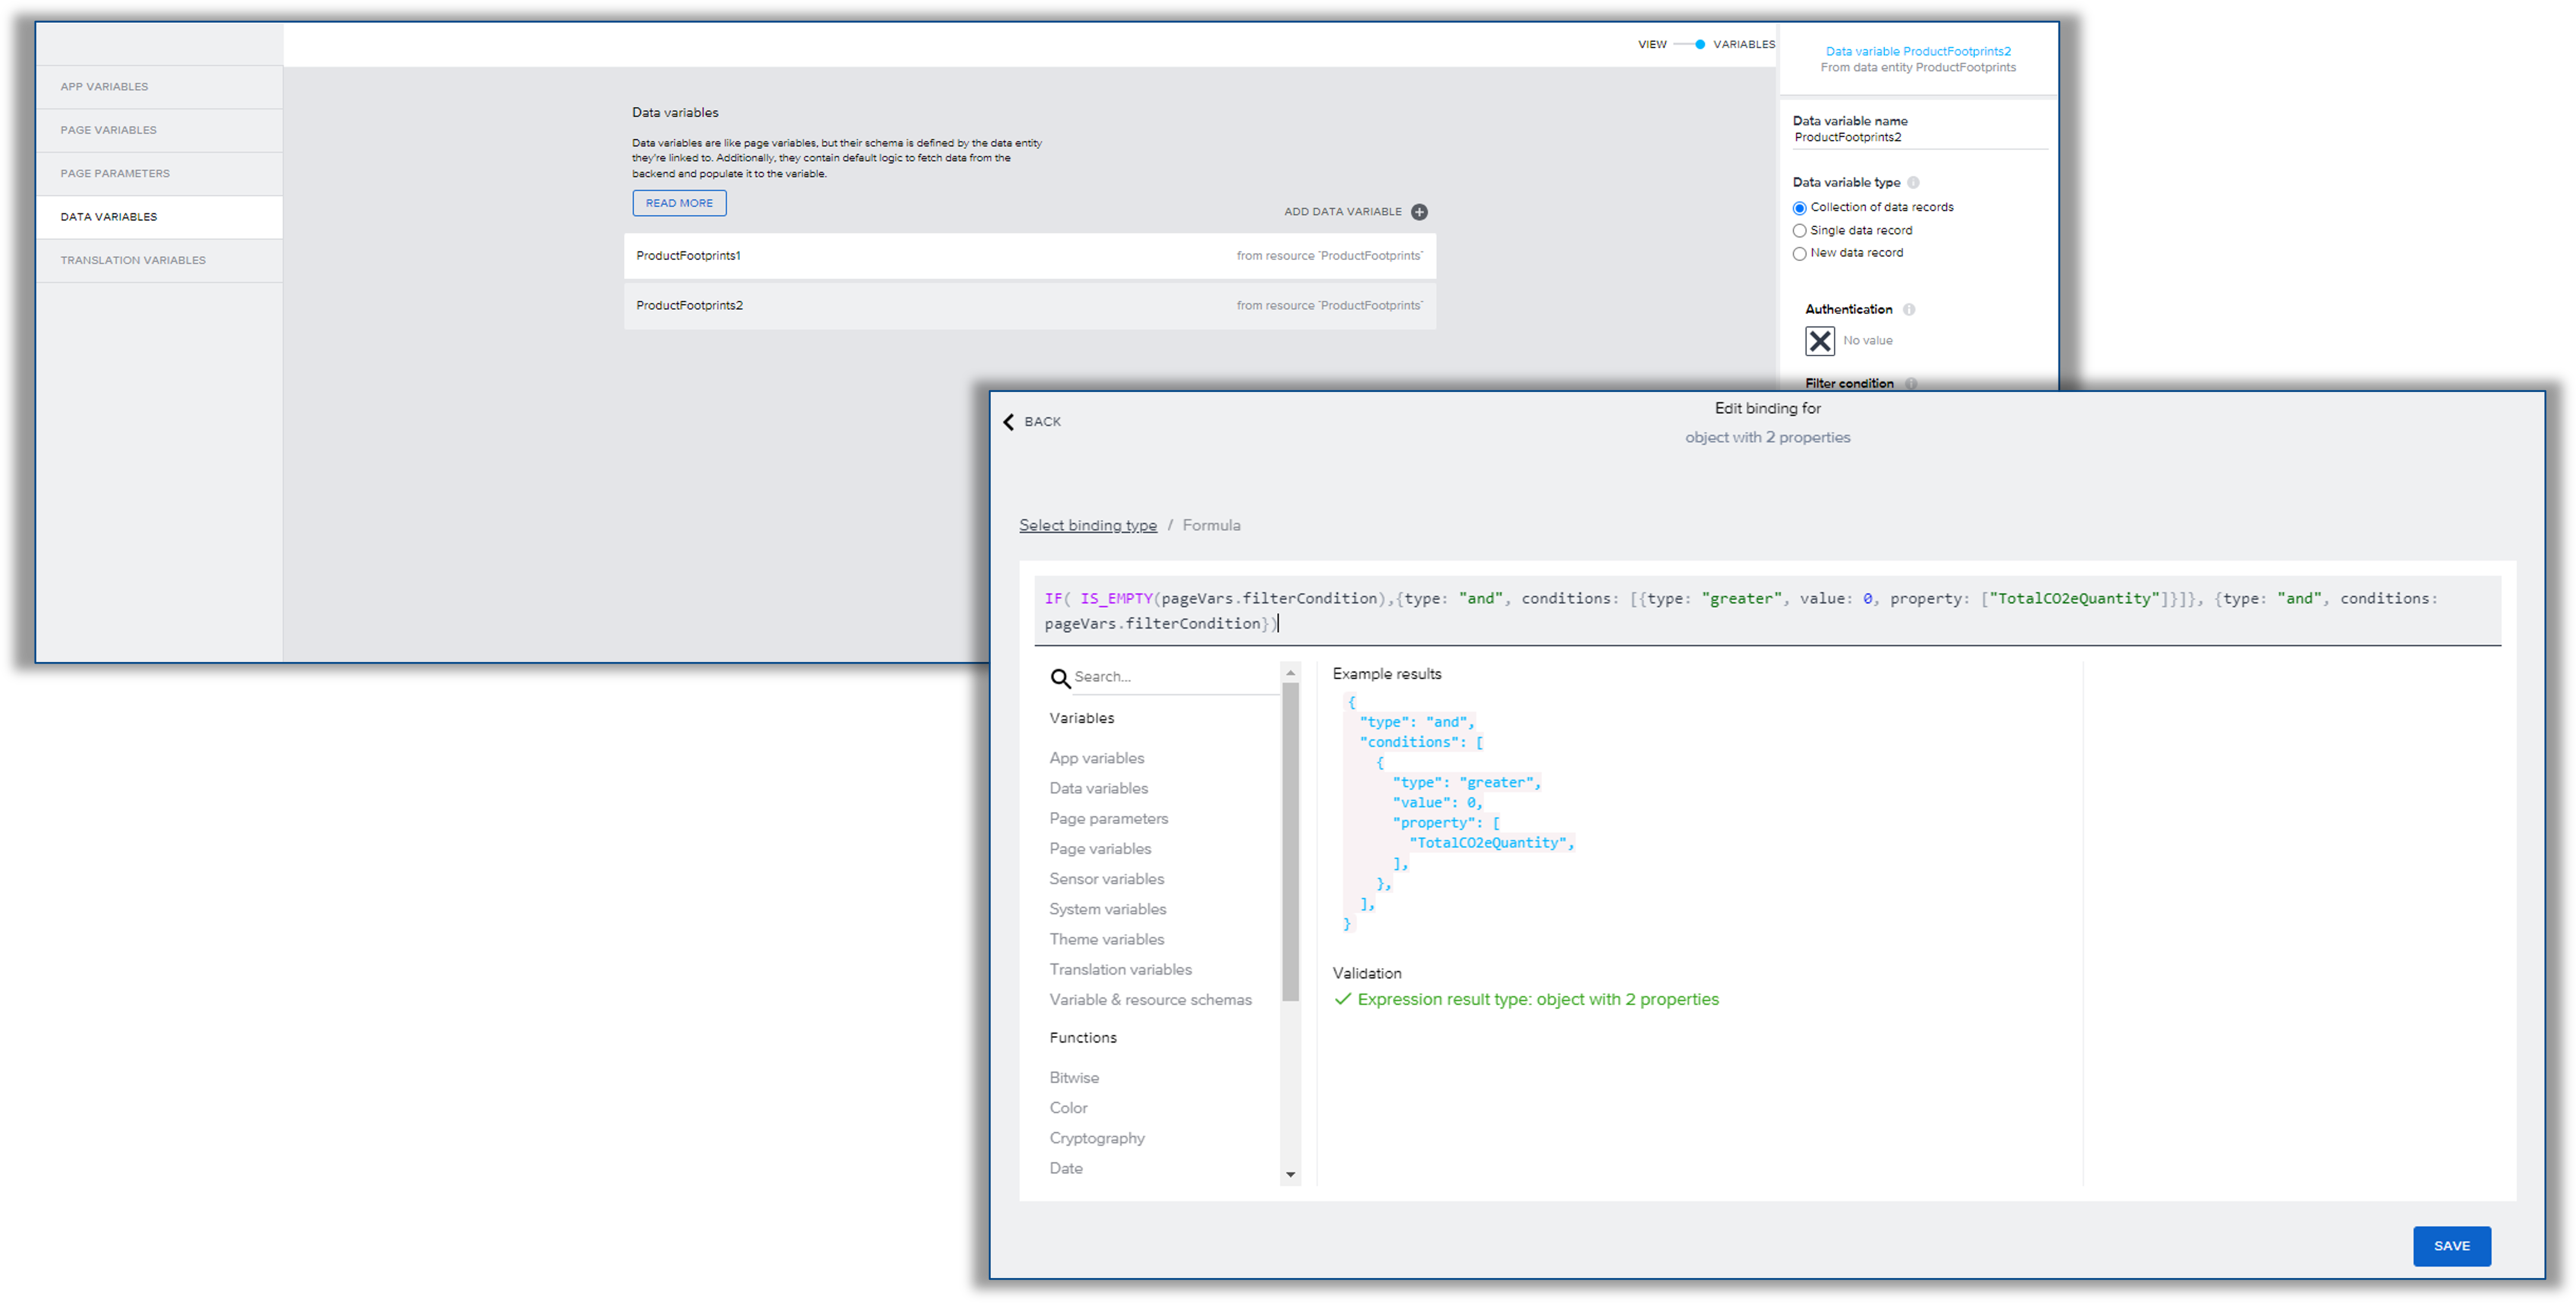
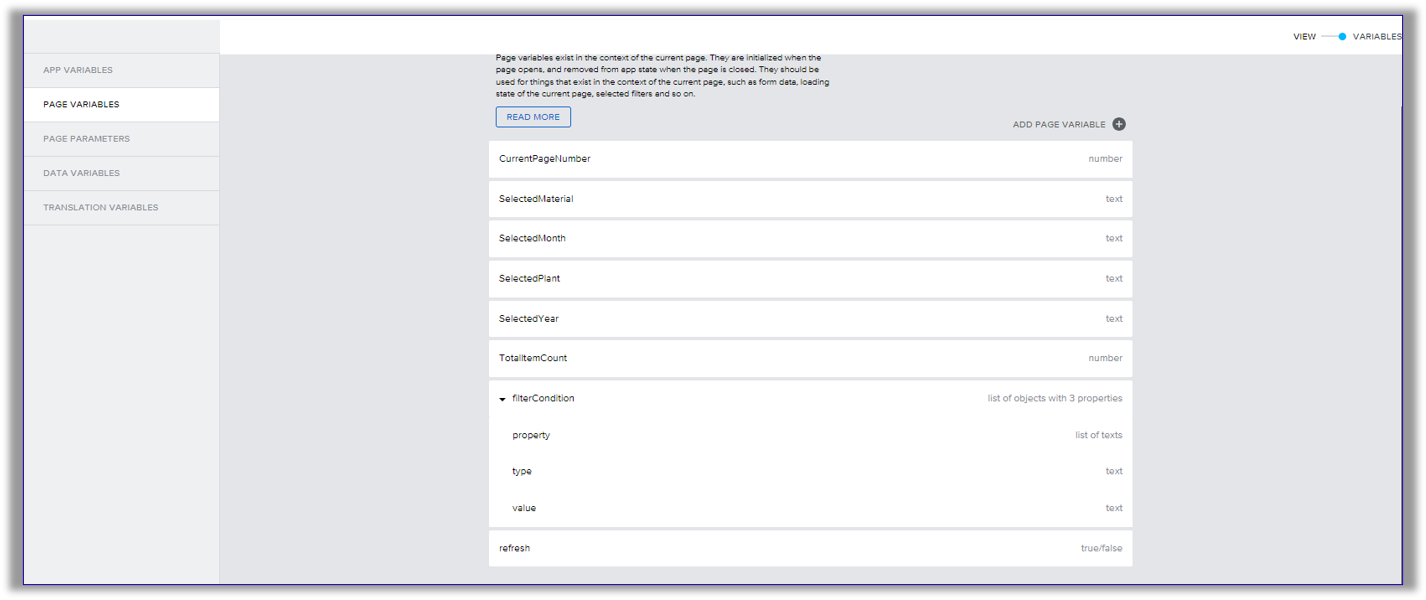
c. Add the following Page Variables, which will be used later in the configuration of the table and pagination:
Step 4: Configure the UI components:
a.Bind the Dropdown fields, by accessing Option List under Properties > Select Formula and add the below formulas:
- For Material
CONCAT([{label:"All Products", value:""}], MAP(data.ProductFootprints1, { label:data.ProductFootprints1[index].ProductName , value: data.ProductFootprints1[index].Product }))
- For Plant
CONCAT([{label:"All Plants", value:""}], UNIQUE_BY_KEY(MAP(data.ProductFootprints1, { label:data.ProductFootprints1[index].PlantName , value: data.ProductFootprints1[index].Plant }), "value"))
- For Year
CONCAT([{label:"All", value:""}], UNIQUE_BY_KEY(MAP(data.ProductFootprints1, { label:data.ProductFootprints1[index].CalculatedYear , value: data.ProductFootprints1[index].CalculatedYear }), "value"))
- For Month
CONCAT([{label:"All", value:""}], UNIQUE_BY_KEY(MAP(data.ProductFootprints1, { label:data.ProductFootprints1[index].CalculatedMonth , value: data.ProductFootprints1[index].CalculatedMonth }), "value"))
The dropdown fields require mapping to their corresponding variables to ensure that when there is a change in the dropdown values, the selected option is stored in the designated Page Variable. This can be achieved through bounding each dropdown to it's respective Page Variable , as follows:

b. Set-up the logic of the 'Apply Filter' button:
i. Integrate a JavaScript component by:
- Mapping data variables to input parameters.
- Including the below code to create a filter condition based on unique combinations.
- Mapping the output result and transform it from a simple object to an array of objects with the structure: [{type:"", value: "", property:["PropertyName"]}]."

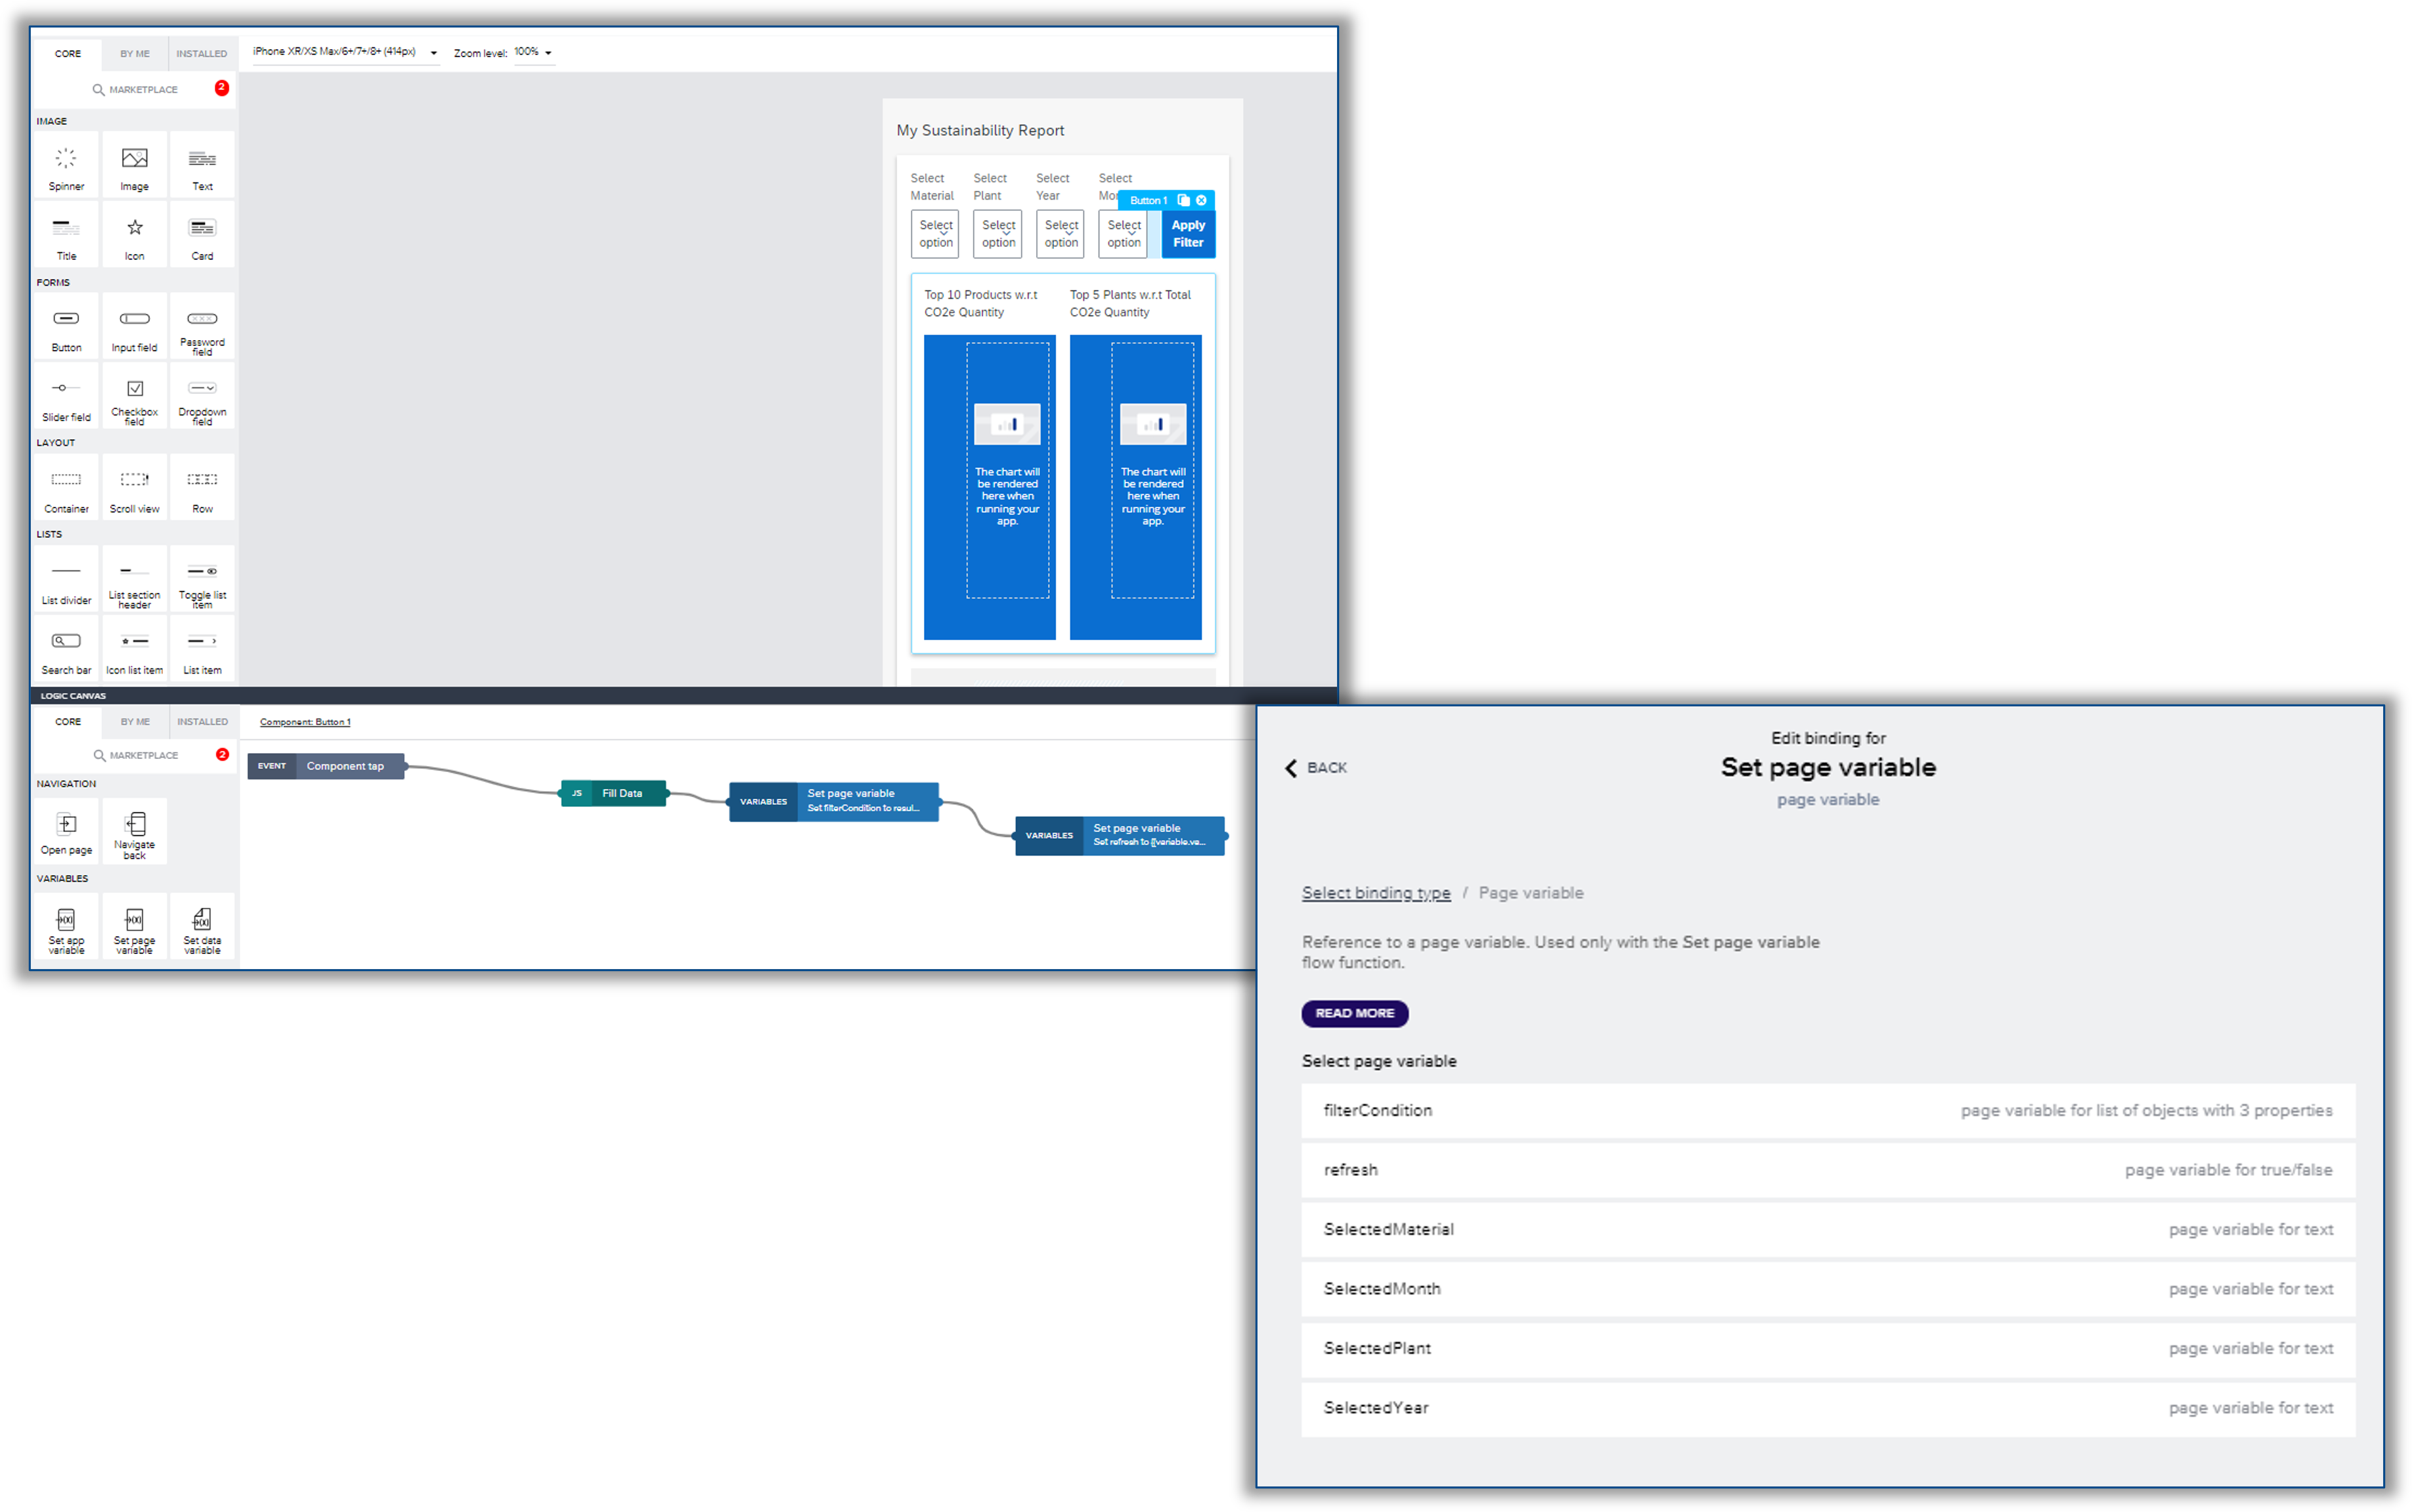
ii. Add ' Set Page Variable' component, configure it and connect it the JS, as shown below:

iii. Add and configure another 'Set Page Variable' component for refreshing the data:
c. Configure the first Bar Chart to display the Product on the x-axis and Total Carbon Emission on the y-axis, through configuring the Chart Data under Properties:
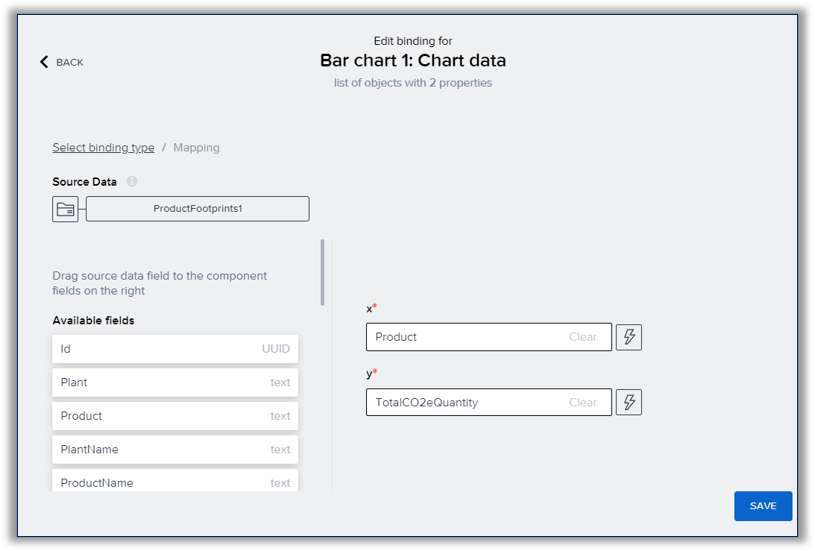
Then, configure the second Bar Chart to display the Plant on the x-axis and Total Carbon Emission Quantity on the y-axis:

Please note that Bar Charts require a designated data variable to which they are bound. This data variable retrieves information from the Backend OData binding, and any filters applied to it are automatically reflected in real-time within the Bar Charts. It's important to note that there is no necessity for manual chart refreshing following data modifications in the bound variable.
d. Bind the table by configuring the Table Resource under Properties, as follows:
Add a Filtering Conditions under Properties by adding the following formula:
IF( IS_EMPTY(pageVars.filterCondition),{type: "and", conditions: [{type: "greater", value: 0, property: ["TotalCO2eQuantity"]}]}, {type: "and", conditions: pageVars.filterCondition})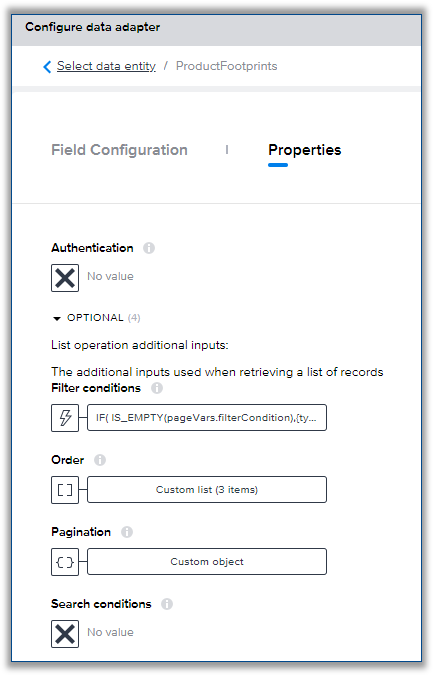
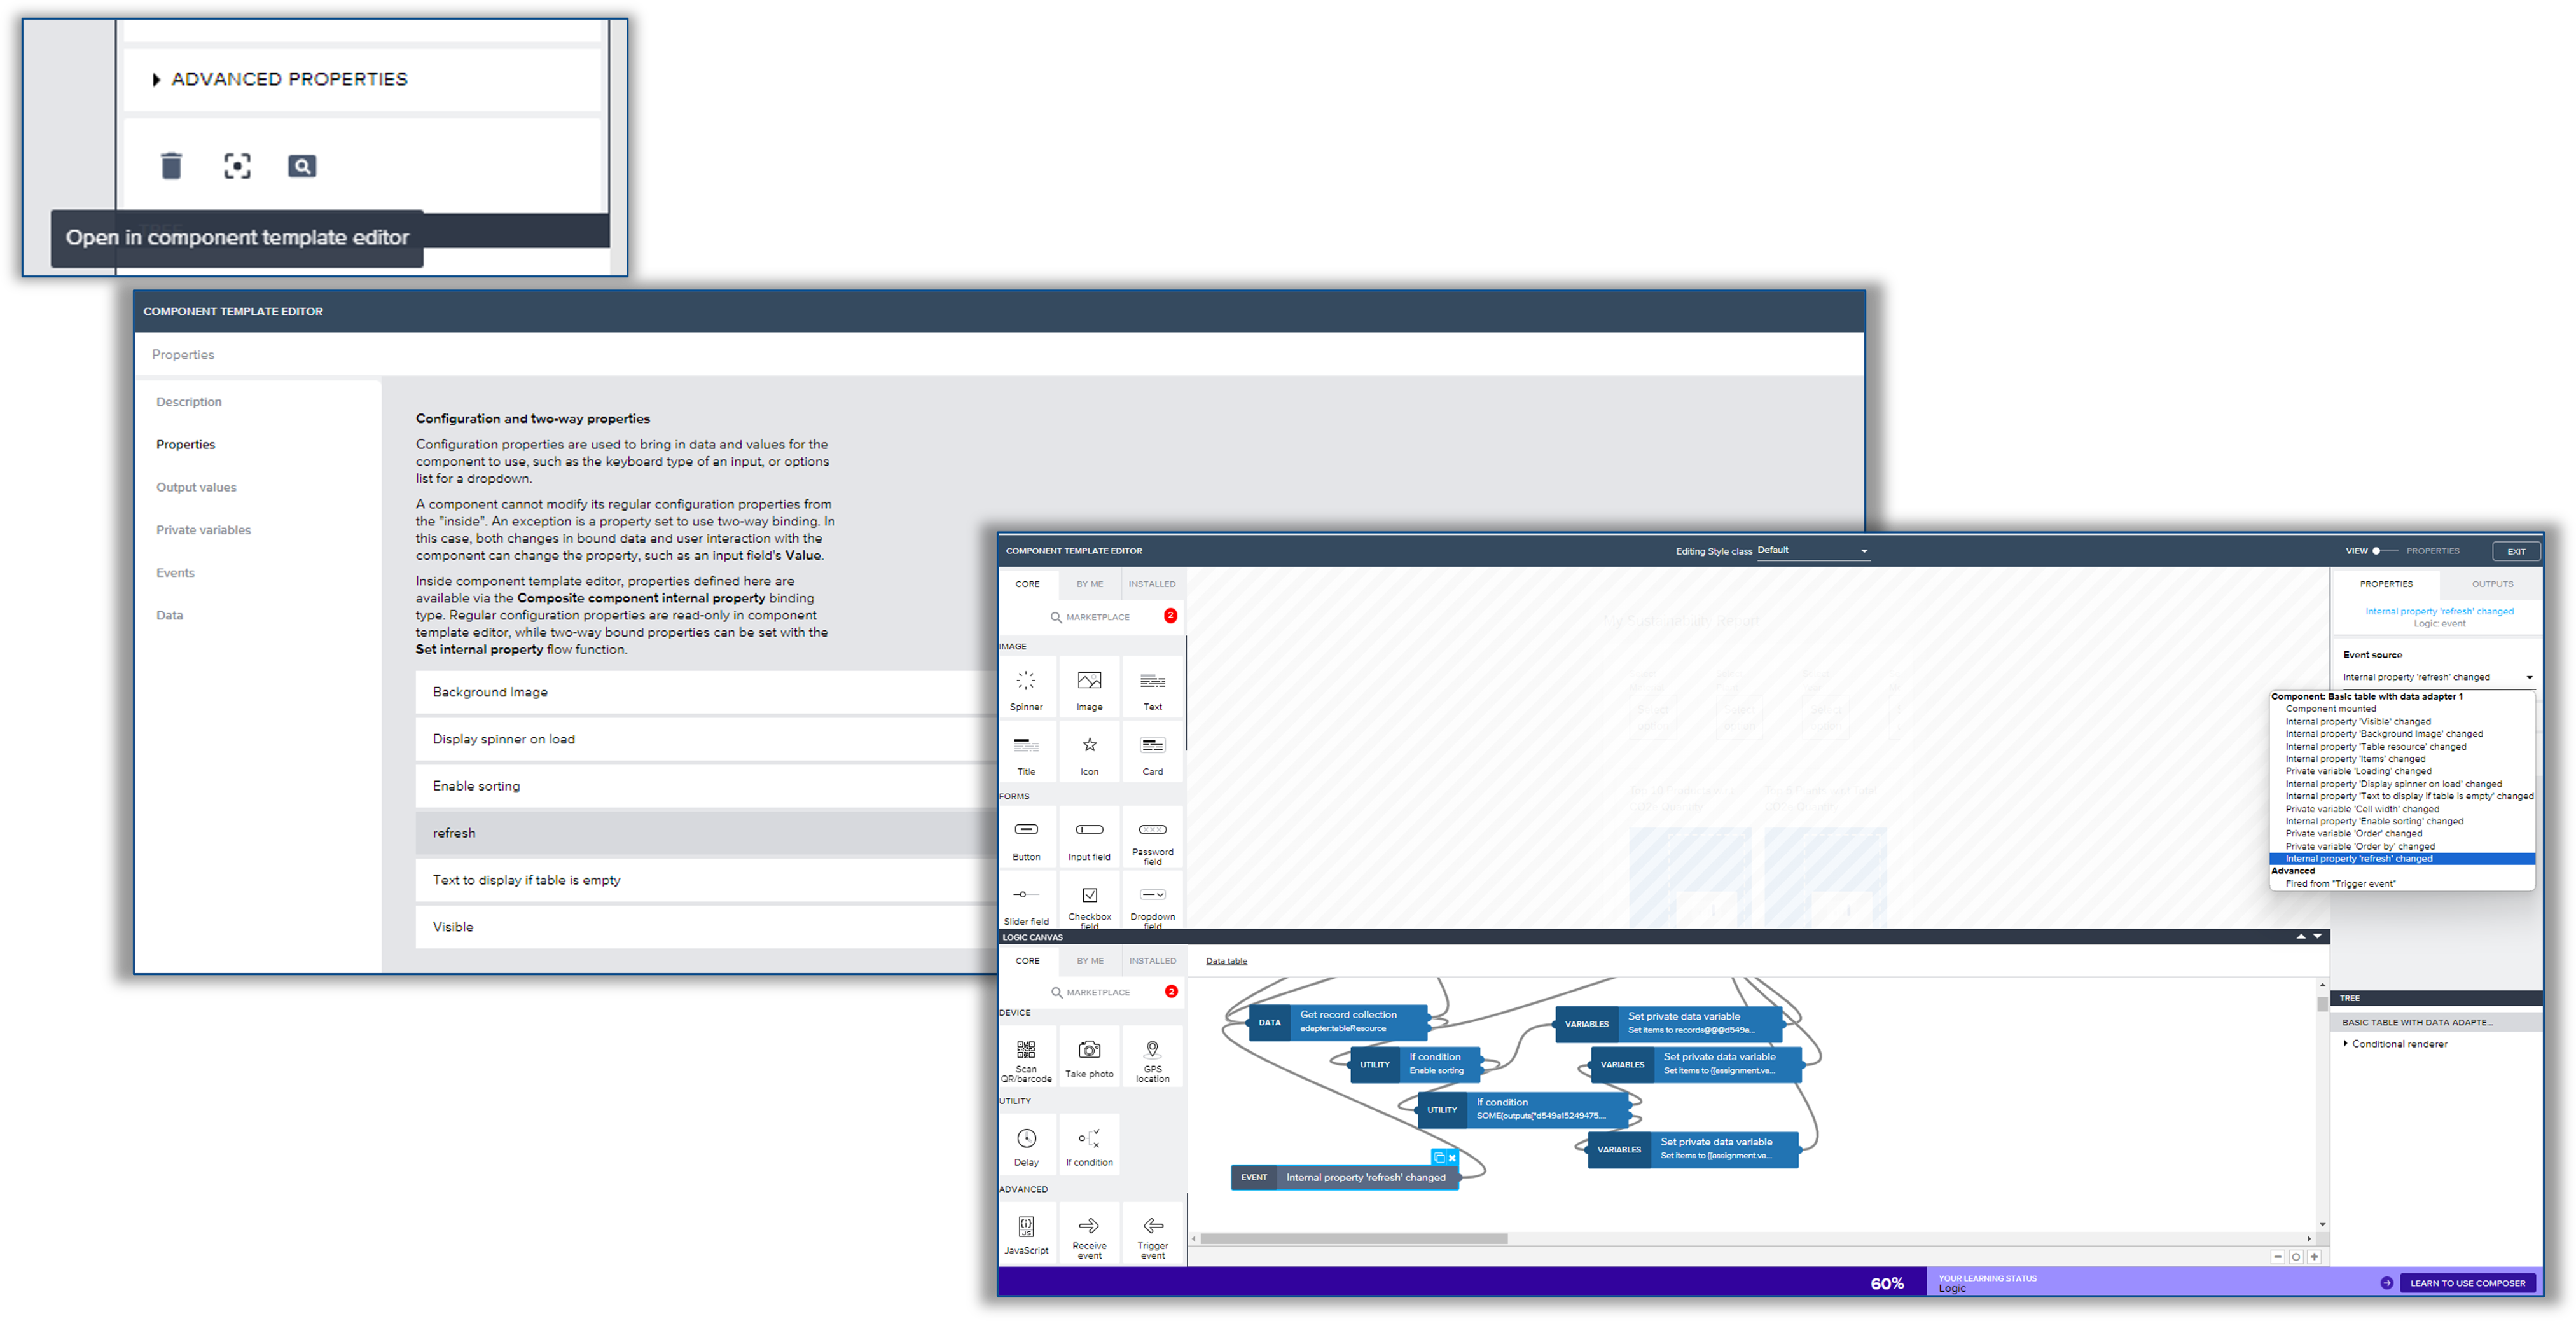
The table component is directly bound to External OData Destination and the data for the table is loaded by default at the time of first rendering. This means that when we want to apply a filter dynamically after the data is already displayed in the Table, we would have to manually refresh the data in the Table and trigger a reload. To address this, we introduce a refresh variable via the component template editor – a Boolean variable that, when its value changes, triggers a reload of the table data. Subsequently, bind this component property ‘refresh’ to the Page Variable refresh and toggle the value upon apply filter button action.”
Follow the detailed steps outlined below to refresh the table data:
i. Create a refresh property to reload the data of the table, once a filter has been applied. To do so, access the Component Editor > go to the Properties at the top right > Select 'Refresh', then go back to View mode and drag and drop a 'Receive Event' , select the 'Internal property refresh changed' from the Event Source and connect it to the 'Get Record Collection'
ii. Toggle the Enabling Sorting to False
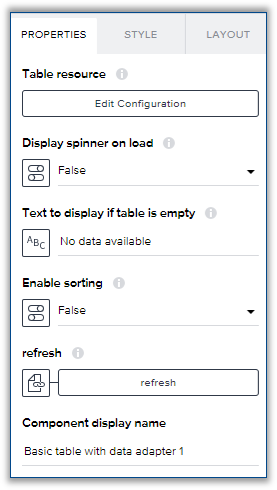
iii. Bind the Refresh property to the Page refresh variable which was configured earlier (Step 3):

e. Configure the Pagination buttons & text field of displaying the number of the current page:
When linking the Basic Table to OData integration, in the configuration, Pagination can be enabled. If there is an increment or decrement in page numbers, an additional trigger is required for the table refresh logic. To control the availability of increment and decrement page buttons, the total number of items in the OData response must be determined. Achieving this involves an additional call to "Get Data Collection," which is connected to the OData integration, follows same filter logic and provides the total count.
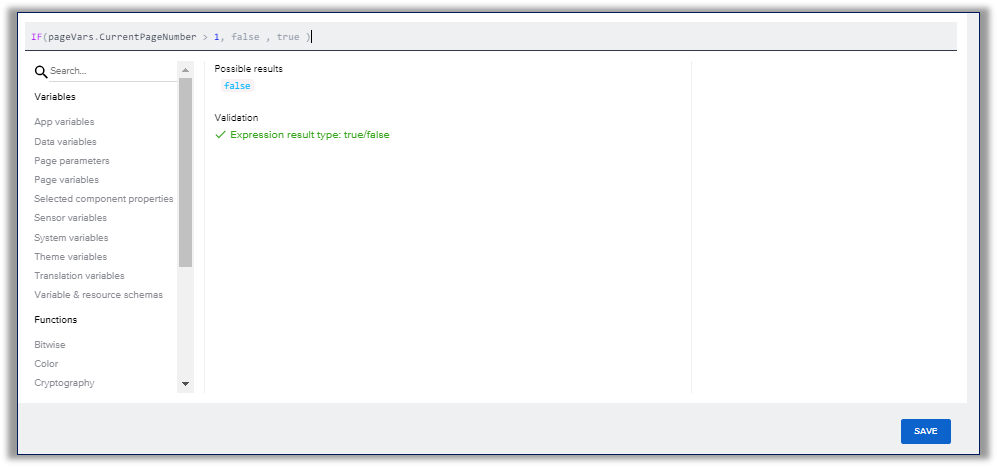
- Configure the logic of the Previous Page button, as follows:


To enable/disable the Previous Page button, navigate to Disabled under Properties > Select and add the following Formula:
IF(pageVars.CurrentPageNumber > 1, false , true )
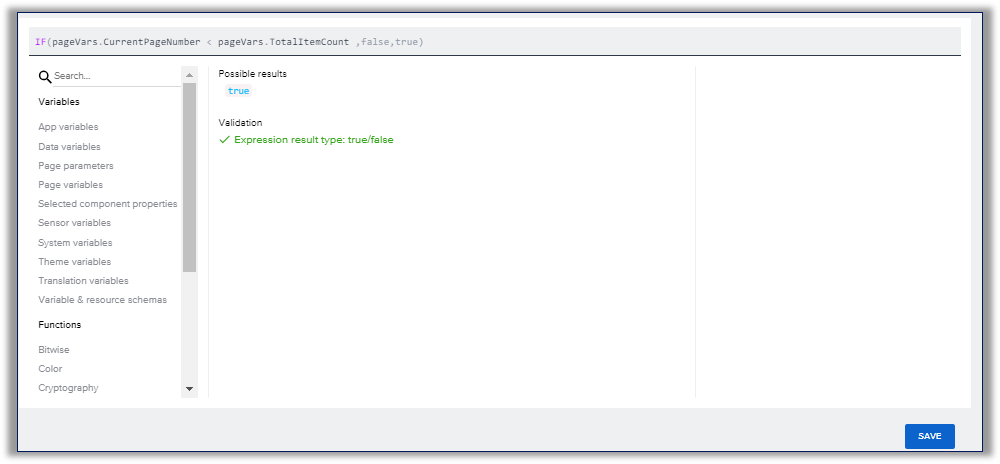
- Configure the logic of the Next Page button, as follows:


To enable/disable the Next Page button, navigate to Disabled under Properties > Select and add the following Formula:
IF(pageVars.CurrentPageNumber < pageVars.TotalItemCount ,false,true)
- To display current page number, bind the text field by adding the following formula:
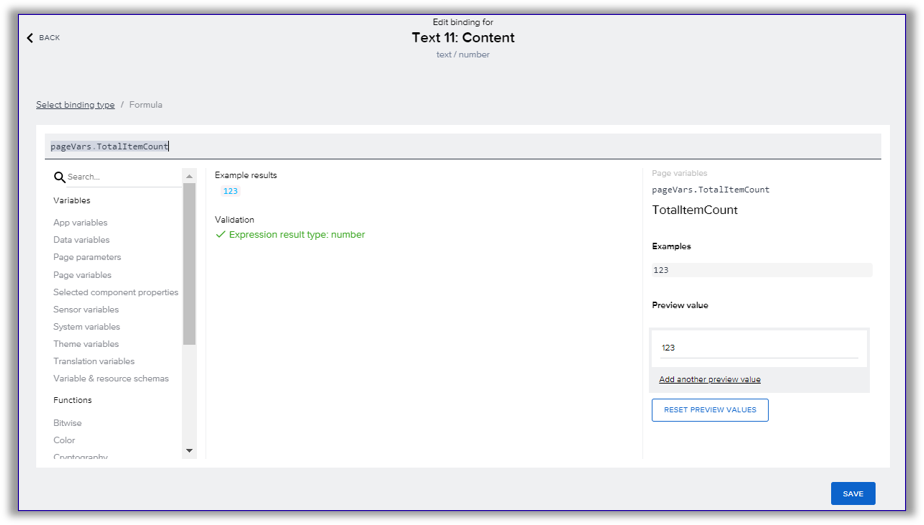
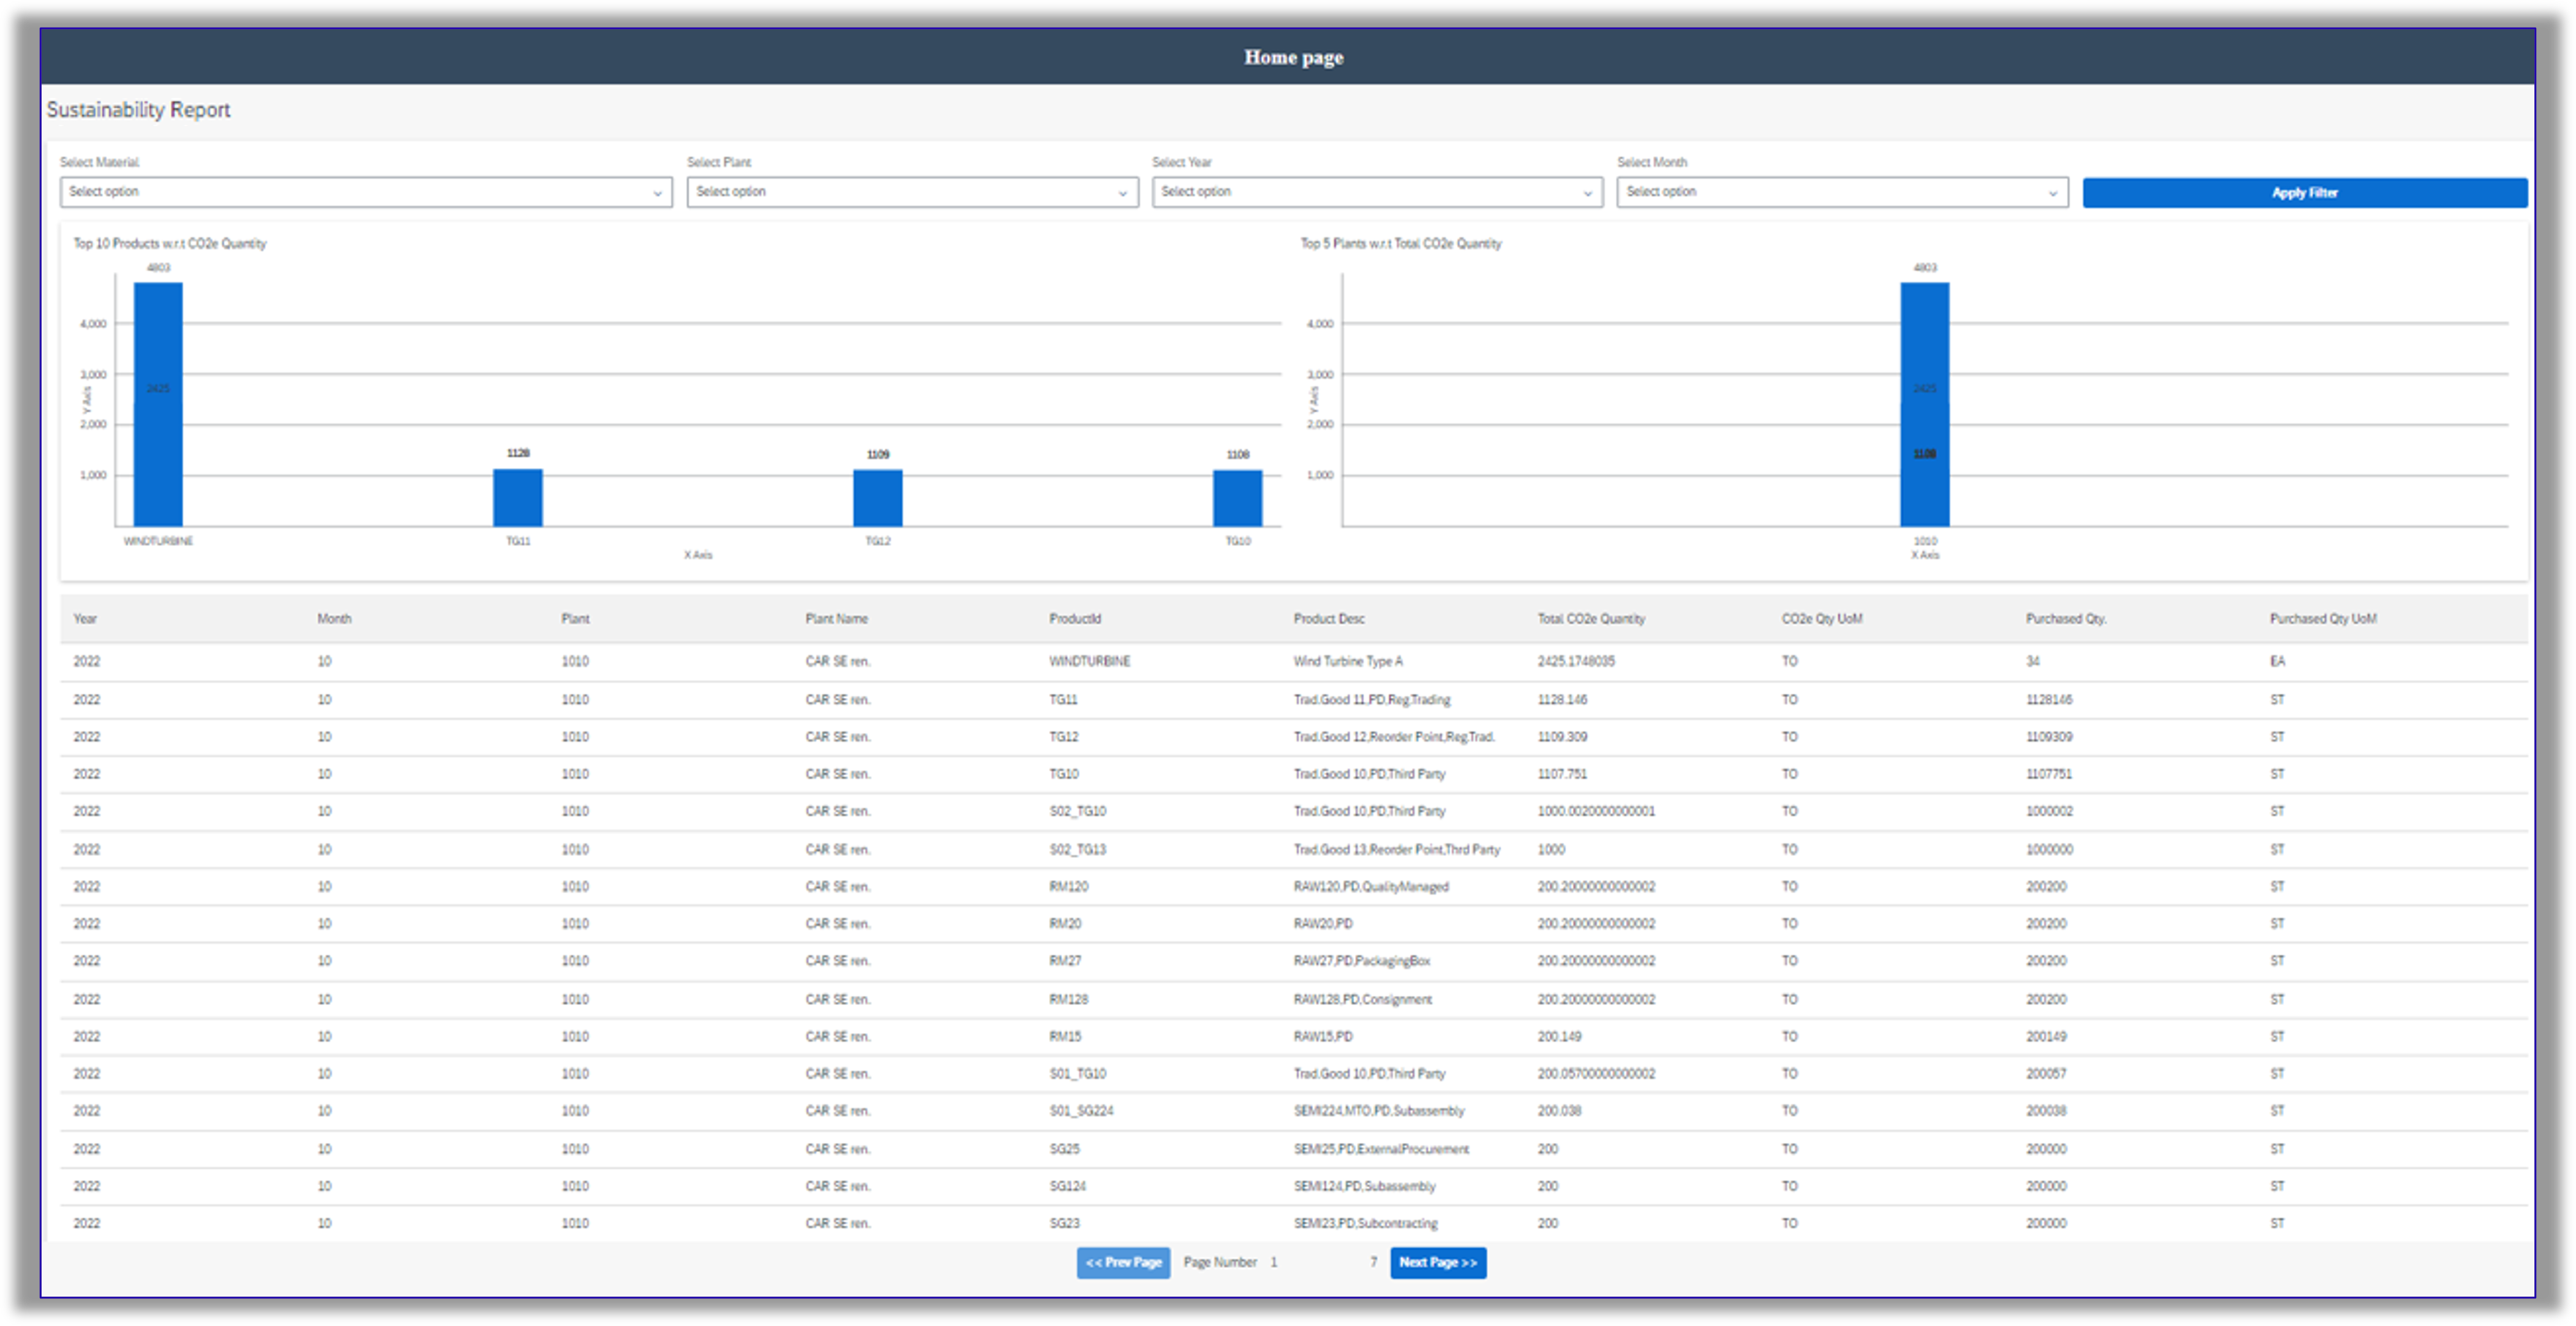
Step 5: Test the Sustainability Report by navigating to Launch > Open Preview Portal> Open Web Preview > Open your report:
- SAP Managed Tags:
- SAP Build
Labels:
2 Comments
You must be a registered user to add a comment. If you've already registered, sign in. Otherwise, register and sign in.
Labels in this area
-
ABAP CDS Views - CDC (Change Data Capture)
2 -
AI
1 -
Analyze Workload Data
1 -
BTP
1 -
Business and IT Integration
2 -
Business application stu
1 -
Business Technology Platform
1 -
Business Trends
1,658 -
Business Trends
93 -
CAP
1 -
cf
1 -
Cloud Foundry
1 -
Confluent
1 -
Customer COE Basics and Fundamentals
1 -
Customer COE Latest and Greatest
3 -
Customer Data Browser app
1 -
Data Analysis Tool
1 -
data migration
1 -
data transfer
1 -
Datasphere
2 -
Event Information
1,400 -
Event Information
67 -
Expert
1 -
Expert Insights
177 -
Expert Insights
301 -
General
1 -
Google cloud
1 -
Google Next'24
1 -
GraphQL
1 -
Kafka
1 -
Life at SAP
780 -
Life at SAP
13 -
Migrate your Data App
1 -
MTA
1 -
Network Performance Analysis
1 -
NodeJS
1 -
PDF
1 -
POC
1 -
Product Updates
4,577 -
Product Updates
346 -
Replication Flow
1 -
REST API
1 -
RisewithSAP
1 -
SAP BTP
1 -
SAP BTP Cloud Foundry
1 -
SAP Cloud ALM
1 -
SAP Cloud Application Programming Model
1 -
SAP Datasphere
2 -
SAP S4HANA Cloud
1 -
SAP S4HANA Migration Cockpit
1 -
Technology Updates
6,873 -
Technology Updates
430 -
Workload Fluctuations
1
Related Content
- link chart and table in SAC in Technology Q&A
- Creating a Custom Navigation Side Panel in SAP Analytics Cloud (Optimized Story Experience) in Technology Blogs by SAP
- Blending Tables (Import Models) in Technology Q&A
- Composite Data Source Configuration in Optimized Story Experience in Technology Blogs by SAP
- GanttCharts scrolling not working in Technology Q&A
Top kudoed authors
| User | Count |
|---|---|
| 28 | |
| 17 | |
| 15 | |
| 13 | |
| 11 | |
| 9 | |
| 8 | |
| 8 | |
| 8 | |
| 7 |