
- SAP Community
- Products and Technology
- Technology
- Technology Blogs by SAP
- What’s New in SAP BusinessObjects Cloud and SAP Di...
Technology Blogs by SAP
Learn how to extend and personalize SAP applications. Follow the SAP technology blog for insights into SAP BTP, ABAP, SAP Analytics Cloud, SAP HANA, and more.
Turn on suggestions
Auto-suggest helps you quickly narrow down your search results by suggesting possible matches as you type.
Showing results for
cchoy
Participant
Options
- Subscribe to RSS Feed
- Mark as New
- Mark as Read
- Bookmark
- Subscribe
- Printer Friendly Page
- Report Inappropriate Content
03-02-2017
2:27 AM
This blog covers some of the latest new features and enhancements in SAP BusinessObjects Cloud and SAP Digital Boardroom release 2017.02.
Note: SAP BusinessObjects Cloud agent must be upgraded to 1.0.43 in conjunction with the SAP BusinessObjects Cloud upgrade to 2017.02.0.
Don't miss our March 16 #askSAP Analytics Community Call:
SAP Strategy and Roadmap for Cloud and Hybrid Analytics Scenarios
Join us on March 16 to learn more about the SAP Analytics and SAP BusinessObjects Cloud strategy, new enhanced features and functionality, in addition to innovative ideas and capabilities to leverage on-premise SAP investments. Register here >
New video tutorials
Did you know we have a YouTube learning channel where the latest tutorials are posted for SAP BusinessObjects Cloud? Here's a sample of videos from release 2017.01:
Highlights of release 2017.02 include:
Microsoft Edge is now supported for viewing stories, events, files, and boardroom agendas, and for collaborating with other users.
In the User management page, the Set Password and Unlock User buttons will no longer display to administrators who log on with SAP Cloud ID or a SAML credentials.
Live data connections are now supported for SAP BW! These connections will allow you to visualize and analyze data residing in a remote BW system. In this initial release, KPIs are now supported by tables that use a live data connection to SAP BW or SAP S/4HANA.
As this is the first release of our SAP BusinessObjects Cloud live data connector to SAP BW, please note that we do have some functional and query consumption restrictions that you should be aware of – refer to our documentation for more details.
We feel very strongly that data preparation should be just as simple and enjoyable an experience as any other task in the SAP BusinessObjects Cloud platform. After all, it’s not easy to work with large numbers of columns and rows and mountains of data, and still ensure that the models you create are of the highest quality for your business users.
We’re very happy to announce that we are bringing that vision to a reality, with our brand new, completely revamped experience and workflow for data wrangling and preparation! At a glance, this new workflow includes:
Now when you create a model from a data source that has no measure column, you can create a measure column based on a count of an existing column, or allow SAP BusinessObjects Cloud to create a measure column automatically for you.
To optimize on performance, SAP BusinessObjects Cloud automatically caches the list of reports from import data connections for SAP SuccessFactors, SAP Hybris Cloud for Customer, and SAP Business ByDesign Analytics every week. We’ve now made it possible for you to manually refresh the list of reports and see the ones that have been created since you last checked. Just click the new refresh button that is now available when you create a new query, in the panel that lists the reports on the system.
Assigning permissions for your stories just got a whole lot easier. Now when you share a story, you have more than just the default Read access as an option for the people you share with.


Variance data labels on numeric point charts are a great way to combine meaningful information and save space on your canvas pages. Now, you have more control over how variance is displayed on numeric point charts, including:
Digital Boardroom users can now open a table in the Explorer. To make this possible, you can select the option in the table’s styling options to indicate that it can be opened in the Boardroom explorer. All drill levels and any custom styling and filters are preserved when the table is viewed in the Explorer. Also, any dimensions and measures added to the table will be added to their default location (in the story).
You can now use fewer than 16 data points as historical data for predictive forecasts. As shown in the example below, only three past periods are required now to produce a predictive forecast.
Input tasks are very useful for gathering data input from colleagues during the planning process. In previous releases, input tasks were created in a side panel. To make it easier for you to work with input tasks, we now have a new summary page that allows you to create new input tasks and get a clear view of all of the input tasks you’ve assigned in the story.
Notifications are sent to assignees, who can click a link to quickly access the canvas page where they can submit their input and return it to you for approval. We’ve saved you a step by automatically accepting the request for assignees as soon as they click on these links, but they also have the option to decline any requests.
From this summary page, you can see the status of the tasks for each assignee and either accept or decline any inputs submitted. You can also send reminders to assignees who have not yet completed their task.
When you have finished editing data in a public version and are ready to leave the story, you will be prompted to either discard the changes or publish them to the public version.
Note: SAP BusinessObjects Cloud agent must be upgraded to 1.0.43 in conjunction with the SAP BusinessObjects Cloud upgrade to 2017.02.0.
Don't miss our March 16 #askSAP Analytics Community Call:
SAP Strategy and Roadmap for Cloud and Hybrid Analytics Scenarios
Join us on March 16 to learn more about the SAP Analytics and SAP BusinessObjects Cloud strategy, new enhanced features and functionality, in addition to innovative ideas and capabilities to leverage on-premise SAP investments. Register here >
New video tutorials
Did you know we have a YouTube learning channel where the latest tutorials are posted for SAP BusinessObjects Cloud? Here's a sample of videos from release 2017.01:
- Save a story as a template
- Create and work with required dimensions
- Add a predictive forecast to a trend time series chart
Highlights of release 2017.02 include:
- Microsoft Edge supported for viewing of analytic content
- Update to the User management page
- Live data connections to SAP BW
- Next generation data preparation
- Automatic generation of measures for measureless data sources
- Clear and refresh cached metadata for SuccessFactors, Hybris C4C, and ByDesign reports
- Assign permissions while sharing stories
- Format the size and position of variance data labels on Numeric Point charts
- Open tables in the Explorer for the Digital Boardroom
- Forecast on fewer than 16 past periods
- Value Driver Trees: Data source nodes based on restricted and calculated accounts can be used as inp...
- Value Driver Trees: Better response times when updating
- Improved user experience for creating and handling input tasks
- Editing public versions: New prompt
Core: Infrastructure
Microsoft Edge supported for viewing of analytic content
Microsoft Edge is now supported for viewing stories, events, files, and boardroom agendas, and for collaborating with other users.
- Note: Touch support is not included but is planned for a future release.
- Please refer to the System Requirements and Technical Prerequisites page in the SAP BusinessObjects Cloud Help Guide for the most up to date information on client software requirements.
Update to the User management page
In the User management page, the Set Password and Unlock User buttons will no longer display to administrators who log on with SAP Cloud ID or a SAML credentials.
- If your system is using SAP Cloud ID for authentication, end users can reset their passwords by selecting Forgot password? on the logon page.
- If your system is using a custom SAML IdP, end users can use the User Profile dialog to change their passwords, provided that the administrator has first specified a password management URL in the custom SAML configuration (under System > Administration > Security).
- Learn more about user management
- Learn more about creating or changing user passwords
Core: Data Integration
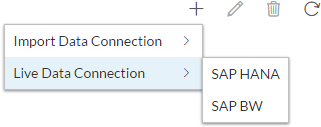
Live data connections to SAP BW
Live data connections are now supported for SAP BW! These connections will allow you to visualize and analyze data residing in a remote BW system. In this initial release, KPIs are now supported by tables that use a live data connection to SAP BW or SAP S/4HANA.
As this is the first release of our SAP BusinessObjects Cloud live data connector to SAP BW, please note that we do have some functional and query consumption restrictions that you should be aware of – refer to our documentation for more details.
- Note: SAP BusinessObjects Cloud is not a product successor of existing on-premise BI tools for SAP BW (does not supplant BEx or other modern BI solutions like Analytics Office and Design Studio).
- SAP BW backend prerequisites: 7.5 SP6 + SAP notes applied
- Support SAP BW (on any DB)
- Support SAP BW running on SAP HANA
- As always, we recommend that you check the System Requirements and Technical Prerequisites page in the SAP BusinessObjects Cloud Help Guide for the most up to date information on supported data sources.
- Learn more about live data connections
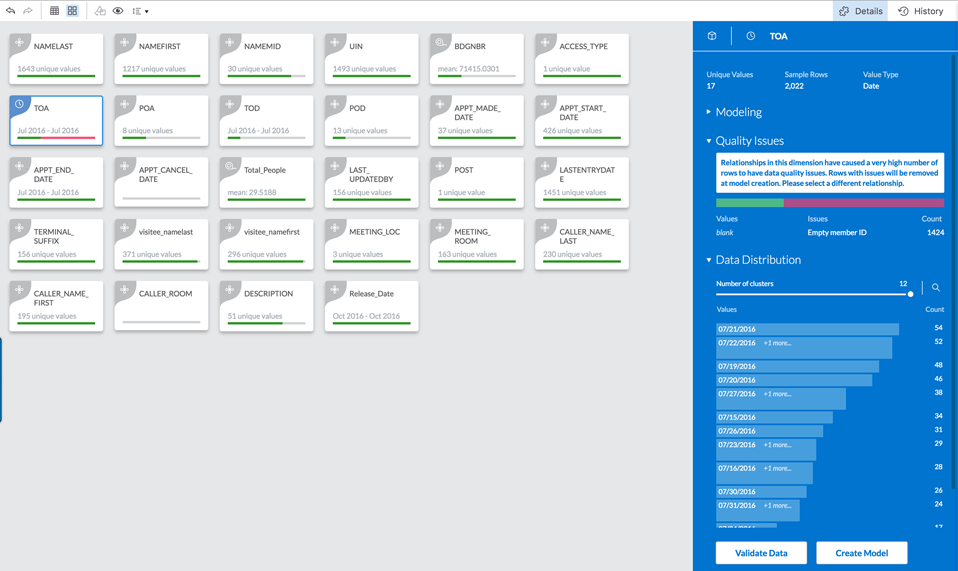
Next generation data preparation
We feel very strongly that data preparation should be just as simple and enjoyable an experience as any other task in the SAP BusinessObjects Cloud platform. After all, it’s not easy to work with large numbers of columns and rows and mountains of data, and still ensure that the models you create are of the highest quality for your business users.
We’re very happy to announce that we are bringing that vision to a reality, with our brand new, completely revamped experience and workflow for data wrangling and preparation! At a glance, this new workflow includes:
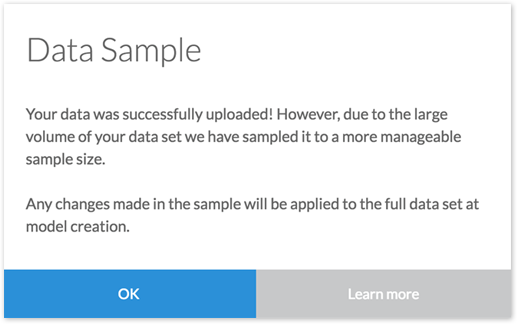
- Data sampling for a much faster experience
- Working with mountains of data is great for uncovering insights, but can also be very cumbersome and slow things down when you are wrangling your data. So now instead of waiting to load the entire data set, BusinessObjects Cloud will grab a subset of your data (consisting of randomly selected rows) to represent your data set during data preparation.
- Once you’ve finished defining all of your transforms for your data, you can go ahead and create your model and your transforms will be performed on the entire dataset.
- Any errors raised during the creation of the model will be brought back into the sample for your examination and further action.
- A new Card view that helps you see all of your columns at a glance
- Each column in the data source is represented as a card.
- The face of each card provides you with basic info: the name of the column, an icon to indicate if it is a measure or dimension, and an error quality bar to help you quickly identify and act on any detected data quality issues.
- You can sort the cards, and select one or more to focus on for a less cluttered view.
- Clicking on the cards will provide you with quick access to more details, like how your data is distributed.

- A faster, optimized Table view
- The original grid view has been improved with new data profiling charts that allow you to directly navigate to selected values
- More transformation power
- The grid will intelligently suggest transformations you could perform on each column based on context.
- Before you commit to any transformations, you can simply hover over a transformations to preview the results directly on the grid.
- A new transformations bar at the top allows you to define your own transformations if none of the suggested transformations suit your needs.
- If you need to roll back any changes, you can access the new transformations history panel for a column or the entire data set, and delete specific transformations regardless of where they are in the list (unless there are any dependencies).
![]()
To describe it in words here just won’t do it full justice, so check out this video to see it in action.
- Note: The new data preparation experience described above is available only for tenants with BI-only licenses, working with SAP BusinessObjects Cloud version 2017.02 or newer. We’re working on bringing the same experience and workflow to all of our other customers, and for data imports from any source. Please stay tuned!
- Learn how to import and prepare data from an acquired data source [New BI Analyst License Only]
Automatic generation of measures for measureless data sources
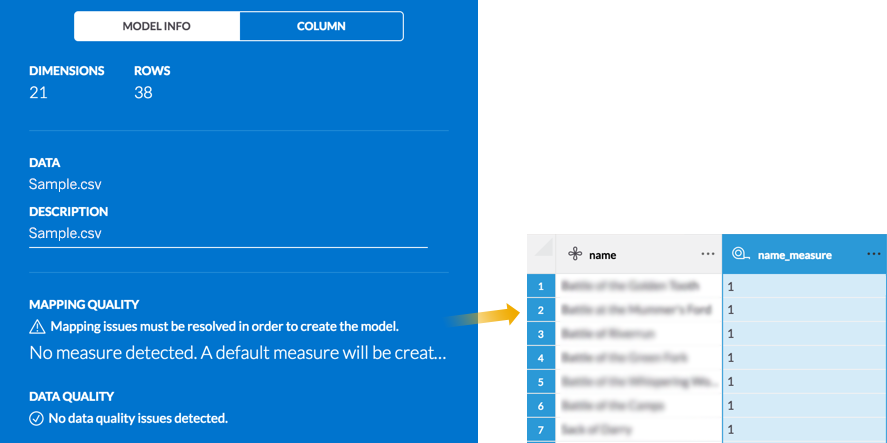
Now when you create a model from a data source that has no measure column, you can create a measure column based on a count of an existing column, or allow SAP BusinessObjects Cloud to create a measure column automatically for you.
- This feature works for all of our data wrangling workflows, including stories, importing models, and importing data.
- You have two options for naming new measures automatically created by the system:
- If a dimension has unique members on all rows, the measure name will be the name of the dimension with “_measure” as a suffix, and the measure will have “1” in all of the cells.
- If a dimension does not has unique members on all rows, the measure will be called “default_measure” and have “0” in all the cells. These values can be changed if you are creating a new model this way from within a story.
- Learn how to create a new model
Clear and refresh cached metadata for SuccessFactors, Hybris C4C, and ByDesign reports
To optimize on performance, SAP BusinessObjects Cloud automatically caches the list of reports from import data connections for SAP SuccessFactors, SAP Hybris Cloud for Customer, and SAP Business ByDesign Analytics every week. We’ve now made it possible for you to manually refresh the list of reports and see the ones that have been created since you last checked. Just click the new refresh button that is now available when you create a new query, in the panel that lists the reports on the system.

Core: Data Analysis, Stories, and Tables
Assign permissions while sharing stories
Assigning permissions for your stories just got a whole lot easier. Now when you share a story, you have more than just the default Read access as an option for the people you share with.
- Read, Update, or Full Control access can be granted to users as well as teams.
- From the Share Story dialog, you can assign access rights separately for different people by clicking the Edit Sharing Settings link.
- Once you’ve shared your story, you can modify the permissions at any time by selecting Sharing Settings directly from the toolbar under the Share dropdown.
- Adding or editing permissions on an existing story can still be done as before, from the Browse > Files area.
- Learn more about managing stories
- Learn how to share files
Format the size and position of variance data labels on Numeric Point charts
Variance data labels on numeric point charts are a great way to combine meaningful information and save space on your canvas pages. Now, you have more control over how variance is displayed on numeric point charts, including:
- Setting the font size and styling options for primary and secondary variance data labels separately from the corresponding primary and secondary measures
- Positioning the primary and secondary variance data labels either inline or on a separate line, as shown below
- Learn more about charts

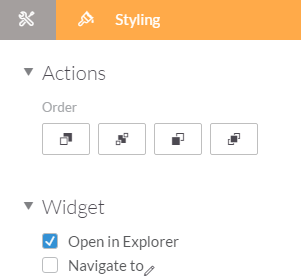
Open tables in the Explorer for the Digital Boardroom
Digital Boardroom users can now open a table in the Explorer. To make this possible, you can select the option in the table’s styling options to indicate that it can be opened in the Boardroom explorer. All drill levels and any custom styling and filters are preserved when the table is viewed in the Explorer. Also, any dimensions and measures added to the table will be added to their default location (in the story).
Other story and visualization updates
- The old (obsolete) Table chart type is no longer available in the Builder
The old Table chart type that you could previously create from the Builder has been obsolete for some time already, with the introduction of the newer and more powerful Table format. We have now removed the obsolete Table chart type from the Builder panel.
- Existing table charts can still be viewed but are no longer editable.
- If you need to make changes to an existing table (obsolete format), you will need to re-create it using the “Insert Table” button from the toolbar.
- Learn more about tables

Predictive
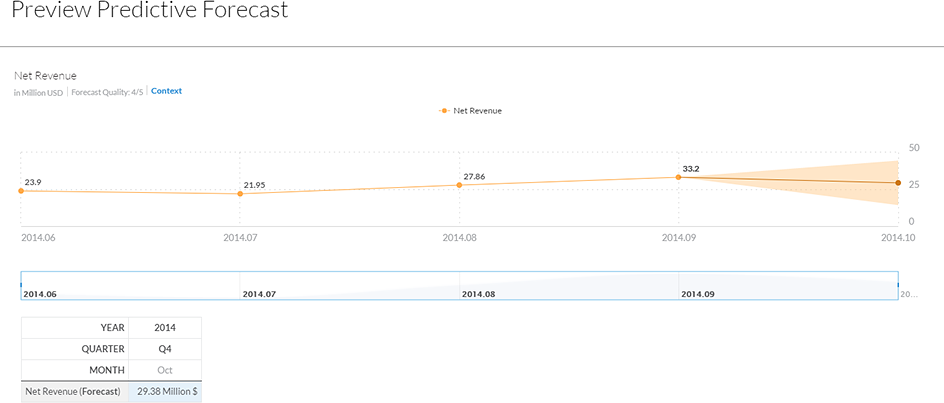
Forecast on fewer than 16 past periods
You can now use fewer than 16 data points as historical data for predictive forecasts. As shown in the example below, only three past periods are required now to produce a predictive forecast.
Planning
New features for Value Driver Trees
- Data source nodes based on restricted and calculated accounts can be used as inputs for calculation
You can now use data source nodes based on restricted and calculated accounts as inputs for union nodes and simple calculation nodes. Please note that YOY nodes cannot use these types of data source nodes as inputs.

- Better response times when updating value driver trees
When you update values for a value driver tree and then run the calculation again, we’ve sped things up by only calculating the nodes that were affected.
Improved user experience for creating and handling input tasks
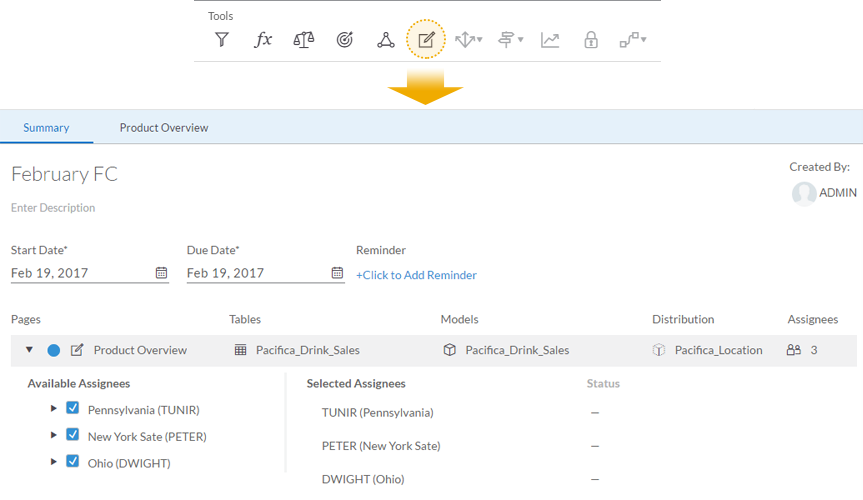
Input tasks are very useful for gathering data input from colleagues during the planning process. In previous releases, input tasks were created in a side panel. To make it easier for you to work with input tasks, we now have a new summary page that allows you to create new input tasks and get a clear view of all of the input tasks you’ve assigned in the story.
Notifications are sent to assignees, who can click a link to quickly access the canvas page where they can submit their input and return it to you for approval. We’ve saved you a step by automatically accepting the request for assignees as soon as they click on these links, but they also have the option to decline any requests.

From this summary page, you can see the status of the tasks for each assignee and either accept or decline any inputs submitted. You can also send reminders to assignees who have not yet completed their task.
Editing public versions: New prompt
When you have finished editing data in a public version and are ready to leave the story, you will be prompted to either discard the changes or publish them to the public version.

Additional resources:
- Release notes: SAP BusinessObjects Cloud 2017.02
- Video tutorials
- SAP BusinessObjects Help Resources
- Official roadmap contains more info on future plans, subject to change.
Previous feature summary blogs:
- SAP Managed Tags:
- SAP Analytics Cloud
4 Comments
You must be a registered user to add a comment. If you've already registered, sign in. Otherwise, register and sign in.
Labels in this area
-
ABAP CDS Views - CDC (Change Data Capture)
2 -
AI
1 -
Analyze Workload Data
1 -
BTP
1 -
Business and IT Integration
2 -
Business application stu
1 -
Business Technology Platform
1 -
Business Trends
1,658 -
Business Trends
116 -
CAP
1 -
cf
1 -
Cloud Foundry
1 -
Confluent
1 -
Customer COE Basics and Fundamentals
1 -
Customer COE Latest and Greatest
3 -
Customer Data Browser app
1 -
Data Analysis Tool
1 -
data migration
1 -
data transfer
1 -
Datasphere
2 -
Event Information
1,400 -
Event Information
75 -
Expert
1 -
Expert Insights
177 -
Expert Insights
355 -
General
1 -
Google cloud
1 -
Google Next'24
1 -
GraphQL
1 -
Kafka
1 -
Life at SAP
780 -
Life at SAP
14 -
Migrate your Data App
1 -
MTA
1 -
Network Performance Analysis
1 -
NodeJS
1 -
PDF
1 -
POC
1 -
Product Updates
4,575 -
Product Updates
398 -
Replication Flow
1 -
REST API
1 -
RisewithSAP
1 -
SAP BTP
1 -
SAP BTP Cloud Foundry
1 -
SAP Cloud ALM
1 -
SAP Cloud Application Programming Model
1 -
SAP Datasphere
2 -
SAP S4HANA Cloud
1 -
SAP S4HANA Migration Cockpit
1 -
Technology Updates
6,871 -
Technology Updates
492 -
Workload Fluctuations
1
Related Content
- Important Notice: Changes in SAP Analytics Cloud Classic Stories & Analytic Applications in Technology Blogs by SAP
- What’s New in SAP Analytics Cloud Release 2024.10 in Technology Blogs by SAP
- SAP Analytics Business Intelligence Statement of Direction – May 2024 update in Technology Blogs by SAP
- SAP BusinessObjects Mobile alternatives in Technology Blogs by SAP
- What’s New in SAP Analytics Cloud Q2 2024 in Technology Blogs by SAP
Top kudoed authors
| User | Count |
|---|---|
| 20 | |
| 11 | |
| 8 | |
| 8 | |
| 7 | |
| 7 | |
| 7 | |
| 6 | |
| 6 | |
| 6 |