- SAP Community
- Products and Technology
- Technology
- Technology Q&A
- Average in SAP Analytics Cloud
- Subscribe to RSS Feed
- Mark Question as New
- Mark Question as Read
- Bookmark
- Subscribe
- Printer Friendly Page
- Report Inappropriate Content
Average in SAP Analytics Cloud
- Subscribe to RSS Feed
- Mark Question as New
- Mark Question as Read
- Bookmark
- Subscribe
- Printer Friendly Page
- Report Inappropriate Content
on 07-03-2023 11:47 AM

- SAP Managed Tags:
- SAP Analytics Cloud
Accepted Solutions (1)
Accepted Solutions (1)
- Mark as New
- Bookmark
- Subscribe
- Subscribe to RSS Feed
- Report Inappropriate Content
Very clear explanation. Thank you very much. Well explained.
You must be a registered user to add a comment. If you've already registered, sign in. Otherwise, register and sign in.
- Mark as New
- Bookmark
- Subscribe
- Subscribe to RSS Feed
- Report Inappropriate Content
- Mark as New
- Bookmark
- Subscribe
- Subscribe to RSS Feed
- Report Inappropriate Content
Answers (3)
Answers (3)
- Mark as New
- Bookmark
- Subscribe
- Subscribe to RSS Feed
- Report Inappropriate Content
Thank you. Worked well
You must be a registered user to add a comment. If you've already registered, sign in. Otherwise, register and sign in.
- Mark as New
- Bookmark
- Subscribe
- Subscribe to RSS Feed
- Report Inappropriate Content


You must be a registered user to add a comment. If you've already registered, sign in. Otherwise, register and sign in.
- Mark as New
- Bookmark
- Subscribe
- Subscribe to RSS Feed
- Report Inappropriate Content
bongielondy
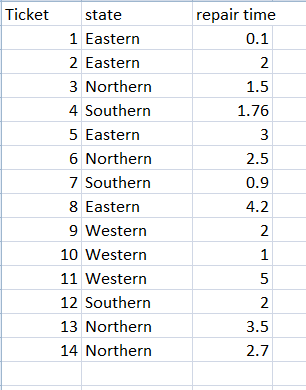
Follow the below approach.
- In your story create a table with Sates and Repair Time

- Now create a calculated measure Ticket Count of type Aggregation and Count dimension as shown below.

Result:

- Create another calculated measure Average Time as shown below.

Result:

Can also plot the same

Hope it helps !!
Please upvote/accept if this helps.
Nikhil
You must be a registered user to add a comment. If you've already registered, sign in. Otherwise, register and sign in.
- SAP Analytics Cloud Need to Know (More in 2024) in Technology Blogs by SAP
- AI@FRE (Part 2) - Accelerating Business AI Transformation with the FRE Value Framework in Technology Blogs by SAP
- Unlock innovation and transformation with expanded SAP BTP and SAP AI services on Microsoft Azure in Technology Blogs by SAP
- Navigating Stories Via the Keyboard – Accessibility Update in SAP Analytics Cloud in Technology Blogs by SAP
- Migration of Webi reports to Oracle analytics cloud in Technology Q&A
| User | Count |
|---|---|
| 67 | |
| 8 | |
| 7 | |
| 7 | |
| 6 | |
| 6 | |
| 5 | |
| 5 | |
| 4 | |
| 4 |
You must be a registered user to add a comment. If you've already registered, sign in. Otherwise, register and sign in.