on 11-06-2023 11:04 AM
I have a data in below format and not able to understand how can I convert the data to plot the Heat Map
I want to plot X dimension on X axis and Y dimension on y axis, and time data in Z axis(measure) in Heat map similar to below.
Thanks in advance
You must be a registered user to add a comment. If you've already registered, sign in. Otherwise, register and sign in.
 I want to plot X dimension on X axis and Y dimension on y axis, and time data in Z axis(measure) in Heat map similar to below.
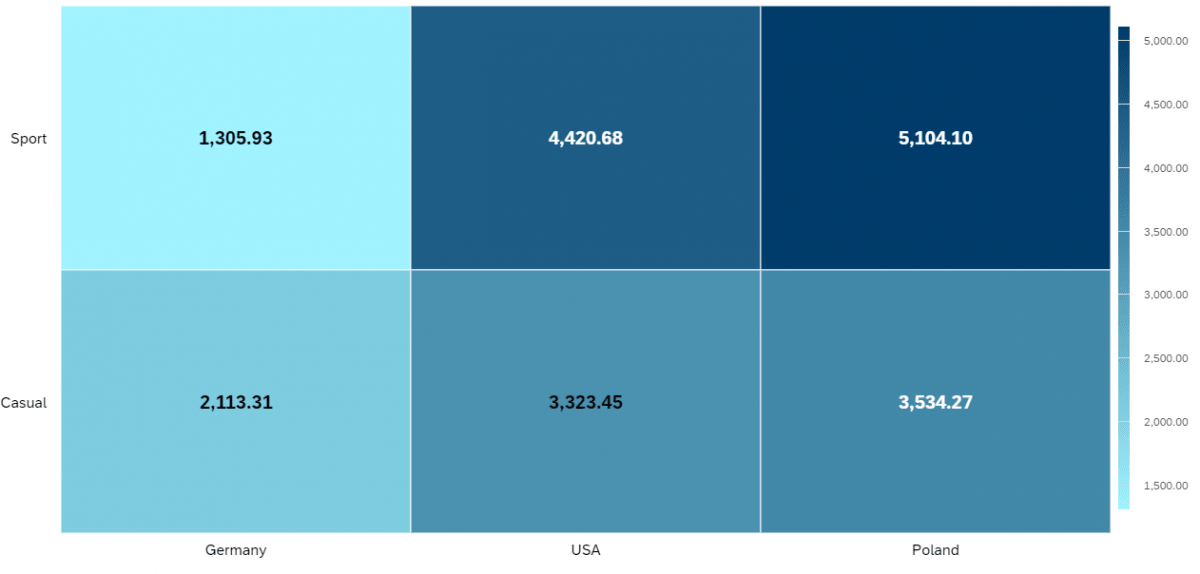 Thanks in advance
You must be a registered user to add a comment. If you've already registered, sign in. Otherwise, register and sign in.