- SAP Community
- Products and Technology
- Technology
- Technology Q&A
- Sap fiori OVP cards capture on click events.
- Subscribe to RSS Feed
- Mark Question as New
- Mark Question as Read
- Bookmark
- Subscribe
- Printer Friendly Page
- Report Inappropriate Content
Sap fiori OVP cards capture on click events.
- Subscribe to RSS Feed
- Mark Question as New
- Mark Question as Read
- Bookmark
- Subscribe
- Printer Friendly Page
- Report Inappropriate Content
on 09-17-2021 1:45 PM
Hi,
A question about chart cards in the fiori ovp.
In the chart cards, added to a sap fiori overview page, using CDS and service annotations, ¿Is there a way to capture the event of a user clicking on a specific place of a chart (a column of column chart, a portion of a donut chart)? Having the event captured, we will extend the card and add our own sapui5 code.
For example, when a user selects a column, we want to show a popup table with details of the data selected. ¿Is it possible?
Thanks for your help.
- SAP Managed Tags:
- SAP Fiori,
- SAP Fiori Elements,
- SAP Fiori for SAP S/4HANA,
- SAP Web IDE,
- NW ABAP Gateway (OData)
- Mark as New
- Bookmark
- Subscribe
- Subscribe to RSS Feed
- Report Inappropriate Content
Hi did u get any answer ???
You must be a registered user to add a comment. If you've already registered, sign in. Otherwise, register and sign in.
- Mark as New
- Bookmark
- Subscribe
- Subscribe to RSS Feed
- Report Inappropriate Content
- Mark as New
- Bookmark
- Subscribe
- Subscribe to RSS Feed
- Report Inappropriate Content
Hi Mamatha,
As of now chart actions are not allowed in ovp, pls check Fiori elements feature map
SAP Fiori Elements Feature Map - Documentation - Demo Kit - SAPUI5 SDK (ondemand.com)
To achieve the same requirement we added custom card,

in Card.fragment.xml
<core:FragmentDefinition xmlns="sap.m" xmlns:core="sap.ui.core" xmlns:ovp="sap.ovp.ui"
	xmlns:template="http://schemas.sap.com/sapui5/extension/sap.ui.core.template/1" xmlns:viz="sap.viz.ui5.controls"
	xmlns:layout="sap.ui.layout" xmlns:mvc="sap.ui.core.mvc" xmlns:viz.data="sap.viz.ui5.data"
	xmlns:viz.feeds="sap.viz.ui5.controls.common.feeds" xmlns:chart="sap.suite.ui.commons">
	<VBox>
		<chart:ChartContainer id="chartContainer" showFullScreen="true" showZoom="false" title=" CHARTS">
			<chart:ChartContainerContent>
				<chart:content>
					<viz:VizFrame id="idpiechart" width="auto" uiConfig="{applicationSet:'fiori'}" vizType="column"
						vizProperties="{ plotArea:{ dataLabel:{visible: true} }, title : {text:'Customs'} }" selectData="myOnClickHandler"
						renderComplete="handleRenderComplete">
						<viz:dataset>
							<viz.data:FlattenedDataset id="flattenData" data="{Model>/}">
								<viz.data:dimensions>
									<viz.data:DimensionDefinition name="City" value="{ShipCity}"/>
								</viz.data:dimensions>
								<viz.data:measures>
									<viz.data:MeasureDefinition name="Total" value="{Freight}"/>
								</viz.data:measures>
							</viz.data:FlattenedDataset>
						</viz:dataset>
						<viz:feeds>
							<viz.feeds:FeedItem id='valueAxisFeed' uid="valueAxis" type="Measure" values="Total"/>
							<viz.feeds:FeedItem id='categoryAxisFeed' uid="categoryAxis" type="Dimension" values="City"/>
						</viz:feeds>
					</viz:VizFrame>
				</chart:content>
			</chart:ChartContainerContent>
		</chart:ChartContainer>
	</VBox>
</core:FragmentDefinition>
just link global filters to custom card using below code in Card.controller.js
                onInit: function () {

                      //link global filters to custom card
			this.GloabalEventBus = sap.ui.getCore().getEventBus();
			this.GloabalEventBus.subscribe("OVPGlobalfilter", "OVPGlobalFilterSeacrhfired", this.onfilterApply, this);


		},
		onfilterApply: function (sChannelId, sEventName, aFilters) {
			var oModel = this.getView().getModel();
			sap.ui.core.BusyIndicator.show(0);
			oModel.read("/Orders", {
				filters: aFilters,
				success: function (OData, oResponse) {
					sap.ui.core.BusyIndicator.hide();
					var Model = new sap.ui.model.json.JSONModel();
					Model.setData(OData.results);
					this.getView().setModel(Model, "Model");

				}.bind(this),
				error: function (oError) {
					sap.ui.core.BusyIndicator.hide();
					try {
						sap.m.MessageBox.error(JSON.parse(oError.responseText).error.message.value);
					} catch (e) {
						sap.m.MessageBox.error(oError.message);
					}
				}
			});

		},
to perform chart click action we have selectData event and define the same in Card.controller.js and manually add a fragment named list.fragment.xml
myOnClickHandler: function (oEvent) {
			var data = this.getView().getModel("Model").getData();
			var cumulative = [{
				Customer: "",
				CustomerID: 0,
				EmployeeID: 0,
				ShipAddress: "",
				ShipCountry: "",
				ShipCity: ""
			}];
			for (var i = 0; i < data.length; i++) {
				if (data[i].ShipCity == oEvent.getParameters().data[0].data.City) {
					cumulative[0].Customer = data[i].Customer;
					cumulative[0].CustomerID = data[i].CustomerID;
					cumulative[0].EmployeeID = data[i].EmployeeID;
					cumulative[0].ShipAddress = data[i].ShipAddress;
					cumulative[0].ShipCountry = data[i].ShipCountry;
					cumulative[0].ShipCity = data[i].ShipCity;
				}
			}
			var oModel1 = new sap.ui.model.json.JSONModel();
			oModel1.setData(cumulative);
			this.getView().setModel(oModel1, "chartclickModel");
			if (!this.customDialog) {
				this.customDialog = sap.ui.xmlfragment(this.getView().getId(),
					"YOUR_NAMESPACE.ext.Card.list", this);
				this.getView().addDependent(this.customDialog);
			}
			this.customDialog.open();

		},
in list.fragment.xml
<core:FragmentDefinition xmlns="sap.m" xmlns:core="sap.ui.core" xmlns:form="sap.ui.layout.form" xmlns:l="sap.ui.layout">
<Dialog id="addMemberdialog" title="List" contentWidth="100%" contentHeight="100%">
<Table id="idProductsTable" sticky="HeaderToolbar,ColumnHeaders" inset="false" items="{ path:'chartclickModel>/'}"
class="sapFDynamicPageAlignContent" width="auto">
<columns>
<Column width="12em">
<Text text="Freight"/>
</Column>
<Column width="12em">
<Text text="CustomerID"/>
</Column>
<Column width="12em">
<Text text="EmployeeID"/>
</Column>
<Column width="12em">
<Text text="ShipAddress"/>
</Column>
<Column width="12em">
<Text text="ShipCountry"/>
</Column>
<Column width="12em">
<Text text="ShipCity"/>
</Column>
</columns>
<items>
<ColumnListItem>
<cells>
<Text text="{chartclickModel>Freight}"/>
<Text text="{chartclickModel>CustomerID}"/>
<Text text="{chartclickModel>EmployeeID}"/>
<Text text="{chartclickModel>ShipAddress}"/>
<Text text="{chartclickModel>ShipCountry}"/>
<Text text="{chartclickModel>ShipCity}"/>
</cells>
</ColumnListItem>
</items>
</Table>
<buttons>
<Button id="cancel" text="Cancel" press="onCancel"/>
</buttons>
</Dialog>
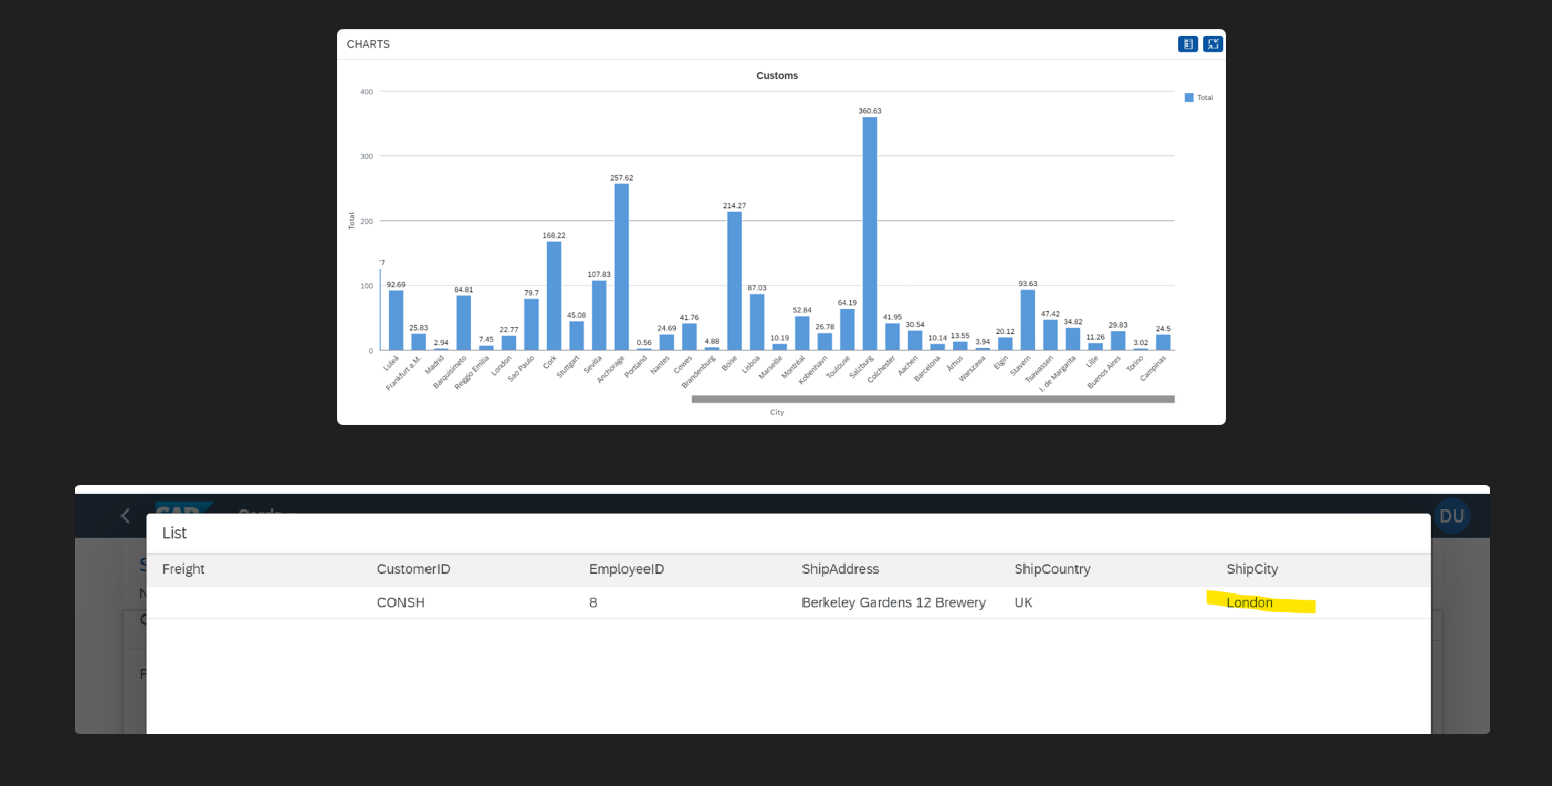
</core:FragmentDefinition>and on clicking on each bar, based on selected city the details are displayed in table
Thank You
- Mark as New
- Bookmark
- Subscribe
- Subscribe to RSS Feed
- Report Inappropriate Content
Hello bhargava.buddana,
Thank you so much for such a quick response.
Much Appreciated for your detailed explanation. As I also got to know, that it is not possible, thanks for the confirmation that chart Actions are not possible in the OVP Fiori Elements.
Will try to opt this option, to extend with custom cards to meet the requirement.
Thanks once again.
Regards,
Mamatha M
- RAG with SAP HANA Cloud Vector Engine, GenAI Hub & CAP in Technology Blogs by SAP
- Integrating SAP S/4HANA with Kafka via SAP Advanced Event Mesh: Part1 – Outbound connection in Technology Blogs by Members
- Automated Availability Check for SAP HANA Cloud (on CF level) with SAP Automation Pilot in Technology Blogs by SAP
- SAP Cloud ALM: Requirements Management on Steroids in Technology Blogs by SAP
- Enhancing the SAPUI5/OpenUI5 Demo Kit Together: A Look into Our Feedback Loop in Technology Blogs by SAP
| User | Count |
|---|---|
| 74 | |
| 8 | |
| 8 | |
| 7 | |
| 7 | |
| 6 | |
| 5 | |
| 5 | |
| 5 | |
| 4 |
You must be a registered user to add a comment. If you've already registered, sign in. Otherwise, register and sign in.