- SAP Community
- Products and Technology
- Technology
- Technology Q&A
- SAP BAS | Business Application Studio Debugger not...
- Subscribe to RSS Feed
- Mark Question as New
- Mark Question as Read
- Bookmark
- Subscribe
- Printer Friendly Page
- Report Inappropriate Content
SAP BAS | Business Application Studio Debugger not working or not attaching
- Subscribe to RSS Feed
- Mark Question as New
- Mark Question as Read
- Bookmark
- Subscribe
- Printer Friendly Page
- Report Inappropriate Content
on 04-24-2023 6:17 AM
Hi,
As of last night, something weird happened to the SAP Business Application Studio.
The debugger no longer attaches to the debug configurations that I have created:
{
"version": "0.2.0",
"configurations": [
{
"command": "cds serve --with-mocks --in-memory?",
"name": "cds serve",
"request": "launch",
"type": "node-terminal",
"skipFiles": [
"<node_internals>/**"
]
},
{
"command": "cds watch --with-mocks --in-memory?",
"name": "cds watch",
"request": "launch",
"type": "node-terminal",
"skipFiles": [
"<node_internals>/**"
]
}
]
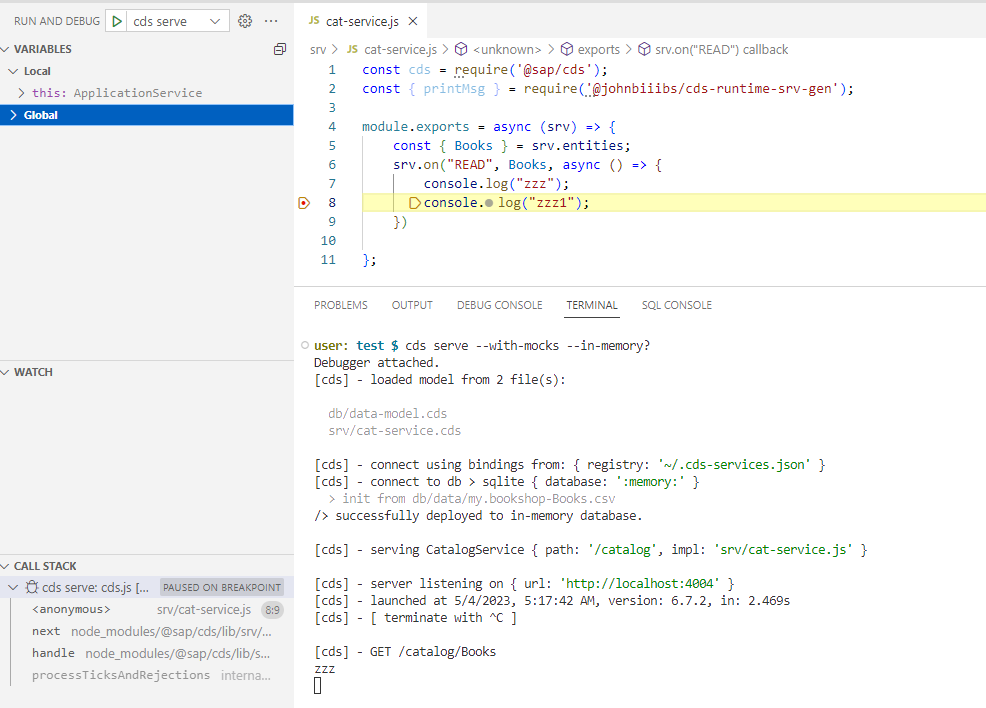
}My breakpoints are now always "unbound" and the "WATCH" and "CALL STACK" Sections are also empty

Additionally, the terminal now shows as "openvscode-server$":

Before, it used to show the name of the folder / workspace, ie. like "test$":

This problem started around 12-14 hours ago. Was there any updates applied to SAP BAS?
Hoping for any assistance.
Thanks,
John
- SAP Managed Tags:
- SAP Business Application Studio,
- SAP Cloud Application Programming Model
Accepted Solutions (1)
Accepted Solutions (1)
- Mark as New
- Bookmark
- Subscribe
- Subscribe to RSS Feed
- Report Inappropriate Content
Hi,
I think SAP finally fixed both issues after 2 weeks. The debugger now works again for type "node-terminal", as well as the "openvscode-server$" issue.

Really appreciate all the workarounds provided.
If the issue happens again, any of the workarounds provided in this thread should work:
https://answers.sap.com/answers/13872945/view.html
https://answers.sap.com/answers/13874671/view.html
https://answers.sap.com/answers/13877601/view.html
Thanks,
John
You must be a registered user to add a comment. If you've already registered, sign in. Otherwise, register and sign in.
Answers (5)
Answers (5)
- Mark as New
- Bookmark
- Subscribe
- Subscribe to RSS Feed
- Report Inappropriate Content
Hi,
There's currently a known issue with launch configuration of type: "node-terminal" which is the one used by default in CAP Node application template.
BAS dev team is checking this issue.
Meanwhile as a workaround please use this run configuration to debug your project:
{
"name": "cds serve",
"request": "launch",
"type": "node",
"cwd": "${workspaceFolder}",
"runtimeExecutable": "npx",
"args": [
"cds",
"serve",
"--with-mocks",
"--in-memory?"
],
"skipFiles": [
"<node_internals>/**"
]
}
Please copy paste the above
launch configuration and pate it inside configurations array located in
<Your project folder>/.vscode/launch.json.

If you didn't run npm install inside your project beofor, please run it now.
Thanks and best regards,
Licam
You must be a registered user to add a comment. If you've already registered, sign in. Otherwise, register and sign in.
- Mark as New
- Bookmark
- Subscribe
- Subscribe to RSS Feed
- Report Inappropriate Content
tested this and working fine.
Sree
- Mark as New
- Bookmark
- Subscribe
- Subscribe to RSS Feed
- Report Inappropriate Content
- Mark as New
- Bookmark
- Subscribe
- Subscribe to RSS Feed
- Report Inappropriate Content
Hi
# Show file `$HOME/.bashrc`
```bash
if [ -n "$SSH_CONNECTION" ]; then . $HOME/.dropbear_env
fi
```
The code checks if the length of the string "$SSH_CONNECTION" is greater than zero, and if so, it loads the file "$HOME/.dropbear_env". However, if you use $"SSH_CONNECTION", the value returned will be "SSH_CONNECTION", so the file "$HOME/.dropbear_env" will always be loaded even if you are not connected to a remote SSH. Therefore, the current path is displayed on the prompt as "$ openvscode-server", as defined in "$HOME/.dropbear_env".
It seems that the docker container interactive update caused an error while running the code.
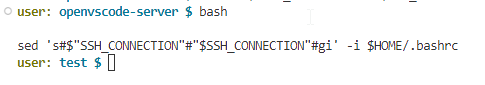
Run the terminal code below to fix the file "$HOME/.bashrc".
```bash
sed 's#$"SSH_CONNECTION"#"$SSH_CONNECTION"#gi' -i $HOME/.bashrc
```
Thanks and best regards,
Wonseok
You must be a registered user to add a comment. If you've already registered, sign in. Otherwise, register and sign in.
- Mark as New
- Bookmark
- Subscribe
- Subscribe to RSS Feed
- Report Inappropriate Content
- Mark as New
- Bookmark
- Subscribe
- Subscribe to RSS Feed
- Report Inappropriate Content
- Mark as New
- Bookmark
- Subscribe
- Subscribe to RSS Feed
- Report Inappropriate Content
Hi all,
BAS team identified the issue. In the meanwhile, until we provide a general fix, you can work around the issue if you define and run another launch configuration like this one:
{
“cwd”: “${workspaceFolder}“,
“runtimeExecutable”: “npx”,
“args”: [
“cds”,
“serve”,
“--with-mocks”,
“--in-memory?”
],
“name”: “cds serve”,
“request”: “launch”,
“type”: “node”,
“skipFiles”: [
“<node_internals>/**”
]
}
Thanks,
Liat
You must be a registered user to add a comment. If you've already registered, sign in. Otherwise, register and sign in.
- Mark as New
- Bookmark
- Subscribe
- Subscribe to RSS Feed
- Report Inappropriate Content
- Mark as New
- Bookmark
- Subscribe
- Subscribe to RSS Feed
- Report Inappropriate Content

You must be a registered user to add a comment. If you've already registered, sign in. Otherwise, register and sign in.
- Mark as New
- Bookmark
- Subscribe
- Subscribe to RSS Feed
- Report Inappropriate Content
Hi Sanjo,
This was actually my initial workaround as well, but didn't find it sustainable when using cds watch, as running it automatically redeploys / restarts the CAP server for any new code change.
This creates a new node process that you need to attach again and again; but sometimes it won't attach at all.
So hopefully you were able to make Liat's or Licam's suggestions to work.
Thanks,
John
- Mark as New
- Bookmark
- Subscribe
- Subscribe to RSS Feed
- Report Inappropriate Content

You must be a registered user to add a comment. If you've already registered, sign in. Otherwise, register and sign in.
- Mark as New
- Bookmark
- Subscribe
- Subscribe to RSS Feed
- Report Inappropriate Content
Your workspace should be opened on the root folder of your project. Can you confirm this is how you ran it?
- spring based odata deployment error in BTP cloud foundry with security configuration in Technology Q&A
- Debugger getting detached in SAP SAM in Technology Q&A
- SAP GUI for Java 8.10 on the Horizon in Technology Blogs by SAP
- Experiencing Embeddings with the First Baby Step in Technology Blogs by Members
- Fiori Application not fetching the data from back end sap system in Technology Q&A
| User | Count |
|---|---|
| 73 | |
| 9 | |
| 7 | |
| 7 | |
| 6 | |
| 6 | |
| 6 | |
| 6 | |
| 5 | |
| 4 |
You must be a registered user to add a comment. If you've already registered, sign in. Otherwise, register and sign in.