- SAP Community
- Products and Technology
- Technology
- Technology Q&A
- Variance between dimension values in a column char...
- Subscribe to RSS Feed
- Mark Question as New
- Mark Question as Read
- Bookmark
- Subscribe
- Printer Friendly Page
- Report Inappropriate Content
Variance between dimension values in a column chart
- Subscribe to RSS Feed
- Mark Question as New
- Mark Question as Read
- Bookmark
- Subscribe
- Printer Friendly Page
- Report Inappropriate Content
on 11-25-2022 12:54 PM
Hello,
I need a help.
My setup:
There is a dimension "Production Stage" with three values: "Planning", "Production", "Realise". There is a measure "Cost".
Task is to build a column or waterfall chart that shows costs over production stages and variances between the stages (the screenshot below).

How can I get such setting in SAC?
Any help and tip is welcome.
Thank you and best regards,
Aizhan
- SAP Managed Tags:
- SAP Analytics Cloud
Accepted Solutions (0)
Answers (2)
Answers (2)
- Mark as New
- Bookmark
- Subscribe
- Subscribe to RSS Feed
- Report Inappropriate Content
Hi Aizhan,
Using the setup as described, a column chart with added variance seems most fitting.
I've created an example where the measure is "Cost" and the dimensions are "prodStage" and "Date".
Lastly, I add the variance comparing current to previous period.
Putting it all in horizontal orientation makes it all easy to comprehend.


You must be a registered user to add a comment. If you've already registered, sign in. Otherwise, register and sign in.
- Mark as New
- Bookmark
- Subscribe
- Subscribe to RSS Feed
- Report Inappropriate Content
Hi Nick,
thank you for your answer. Unfortunately your suggestion doesn't address my concern. In your solution the variance is derived over time dimension, between years. My case is to show the cost variances between subsequent production stages like in the following picture, no time periods involved. Is such scenario possible to obtain in SAC?

Best regards,
Aizhan
- Mark as New
- Bookmark
- Subscribe
- Subscribe to RSS Feed
- Report Inappropriate Content
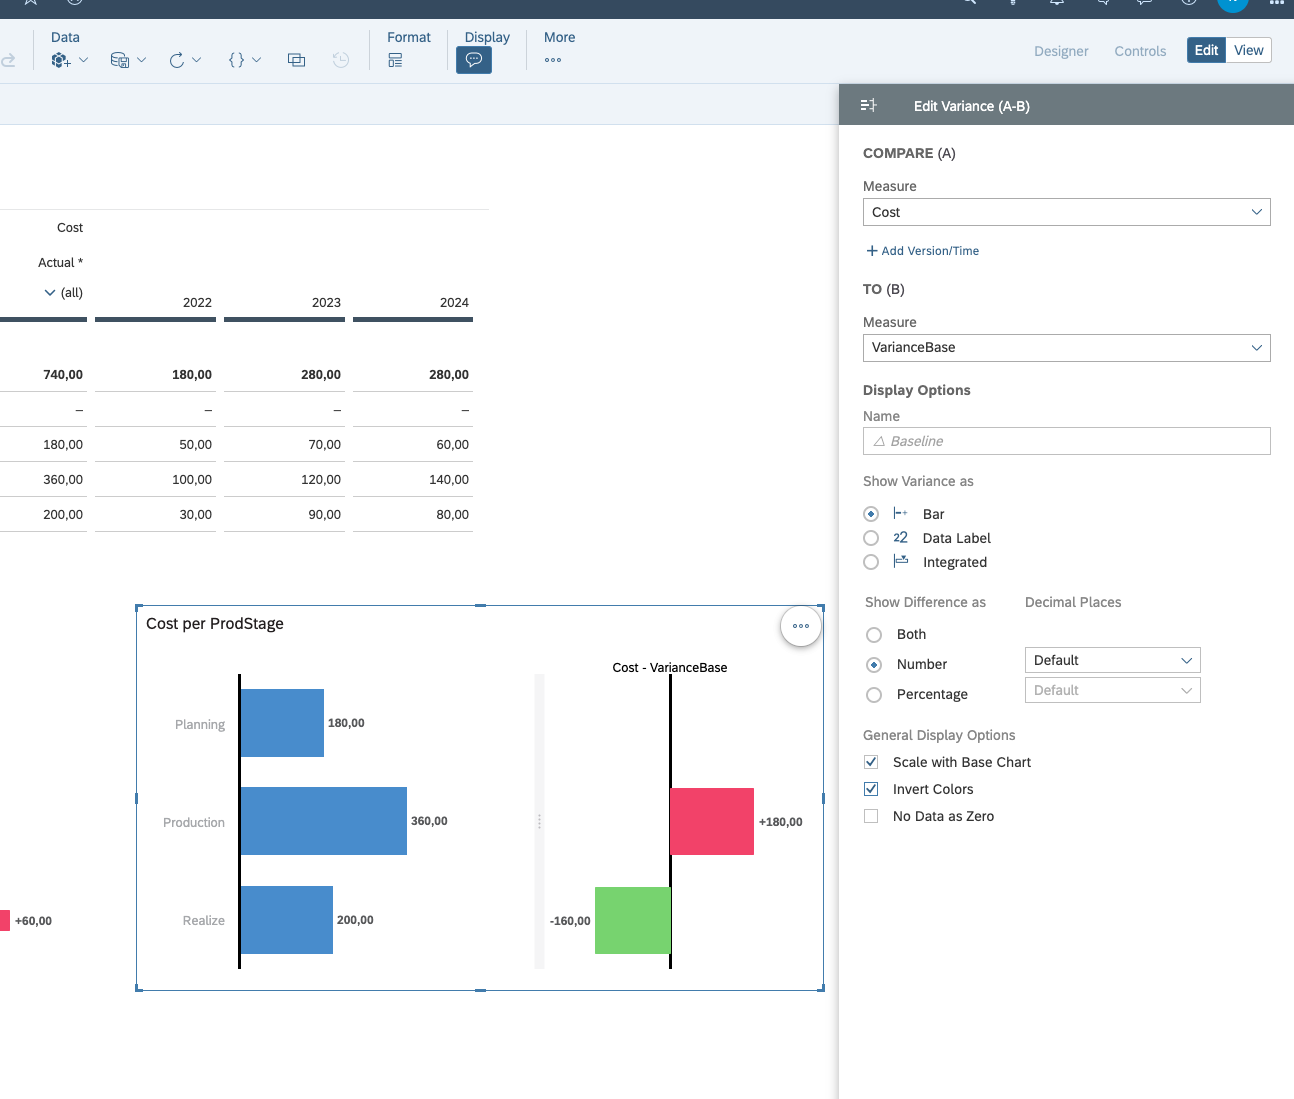
Hi Aizhan,
Understood, I'd first create a simple calculation to compare against "VarianceBase"
IF([d/"planPhase":ProdStage]="Production" ;ResultLookup(["planPhase":Cost] ;[d/"planPhase":ProdStage]="Planning" ) ;IF([d/"planPhase":ProdStage]="Realize" ;ResultLookup(["planPhase":Cost] ; [d/"planPhase":ProdStage]="Production" ) ;null ))
From there I can create the Variance like before:
You must be a registered user to add a comment. If you've already registered, sign in. Otherwise, register and sign in.
- What’s New in SAP Datasphere Version 2024.10 — May 7, 2024 in Technology Blogs by Members
- Can we achieve two scrollbars in an SAC table one for dimension and another for measures in freeze in Technology Q&A
- SAC Story: How to derive a dimension value from the property of an another dimension in Technology Q&A
- Date Dimension in SAC in Technology Q&A
- SAC scripting: Change measure based on value of a dimension input control? in Technology Q&A
| User | Count |
|---|---|
| 83 | |
| 9 | |
| 9 | |
| 8 | |
| 7 | |
| 7 | |
| 6 | |
| 5 | |
| 5 | |
| 4 |
You must be a registered user to add a comment. If you've already registered, sign in. Otherwise, register and sign in.