
- SAP Community
- Products and Technology
- Enterprise Resource Planning
- ERP Blogs by Members
- New Inventory Ageing report
Enterprise Resource Planning Blogs by Members
Gain new perspectives and knowledge about enterprise resource planning in blog posts from community members. Share your own comments and ERP insights today!
Turn on suggestions
Auto-suggest helps you quickly narrow down your search results by suggesting possible matches as you type.
Showing results for
guruprasad_pand
Explorer
Options
- Subscribe to RSS Feed
- Mark as New
- Mark as Read
- Bookmark
- Subscribe
- Printer Friendly Page
- Report Inappropriate Content
06-08-2020
2:12 PM
Introduction:
Inventory ageing report gives an overview about the distribution of available stock of materials from over a period of time, from a selected key date in reverse chronological manner.
For example, a particular material might have a stock of 100 PCS on a selected key date. This stock could have been purchased in 2 lots of 50 and 50 between 6 to 12 months and before 12 months. This material might not have been consumed and be in stock as non moving item.
This report aims at giving details of such stock distributions plotted over different periods known as buckets.
By segregating and analysing such materials, the finance and purchasing teams will be able to plan and manage inventories in an efficient manner.
The buckets of time could be anything within a month, within 6 months or for more than a year .
How the New Inventory ageing report logic differs from the regularly used custom ageing reports:

Brief overview of the logic employed in the new ageing report:
The report does three activities predominantly.
- Calculating the stock of the material on a selected key date.
- Deriving the periods of time, otherwise known as buckets like stocks within a month, within 2 months....etc, dynamically based on the inputs given on the selection screen.
- Calculating the stocks of the material in the various bucket periods, arrived in previous step, and giving the output.
Logic of working in detail:
Please refer the input screen.
- Once the plant / material types and key date is entered, valid materials in the selected plant and material type are fetched.
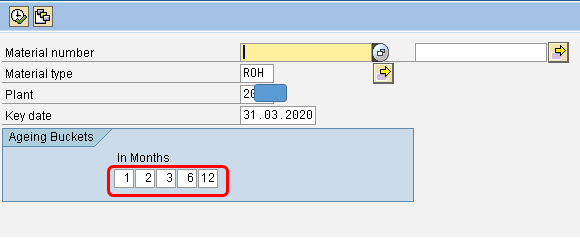
The encircled (red) fields represent the buckets or periods to be analysed.
The buckets are flexible, and can be changed by user as per requirement.
(For better results and practical reasons, it is suggested to set key date as last date of previous month and report be executed in 1st week of current month. This is to get optimum results improvising the working logic of MBEWH table, in which stock is updated only at the close of the month.)
For the above entered combination of buckets and key date, the ageing buckets derived automatically by the system will be like:
| Buckets | In months | From Year / period | To Year period |
| 1 | Within 1 month | 2019 / 11 | 2019 / 12 |
| 2 | Between 1 to 2 months | 2019 / 10 | 2019 / 11 |
| 3 | Between 2 to 3 months | 2019 / 09 | 2019 / 10 |
| 4 | Between 3 to 6 months | 2019 / 06 | 2019 / 09 |
| 5 | Between 6 to 12 months | 2018 / 12 | 2019 / 06 |
| 6 | Greater than 12 months | 2018 / 12 |
- Calculation of material stock on key date:
Note: The company code in example uses an april to march fiscal year period.
Pass the material / plant (bwkey) field to MBEW table and fetch fiscal year and period.

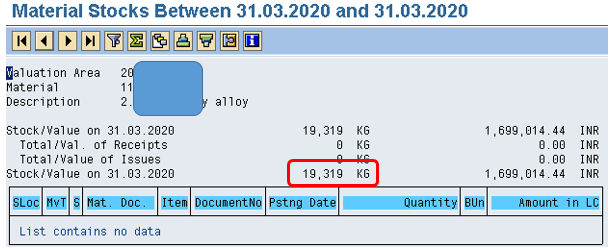
The year / period for material as per MBEW is 2020 / 01, and year / period of the key date given (31.03.20) is 2019 / 12.
- If the year / period fetched in MBEW is greater than key date year / period, we need to take the stock on key date by passing the respective key date year / period to MBEWH table and get the stock from LBKUM field.
- If the year / period fetched in MBEW is less than or equal to the year / period of key date then fetch the stock of the material from LBKUM field of MBEW table. This is the key date stock in this case.
3. Constructing the stock details for missing periods per fiscal year.
Please note the below screen shot.

Fiscal Year 2019 has one entry for period 12. There no entries for other periods in year 2019. Similarly in fiscal year 2018, periods stocks in 12, 11, 10, 6, 5 are only listed.
The logic for building the stock details in missing year / period is as below:
The stocks in year / periods not listed have same stock as that of immediately available / listed year / period above the missing period.
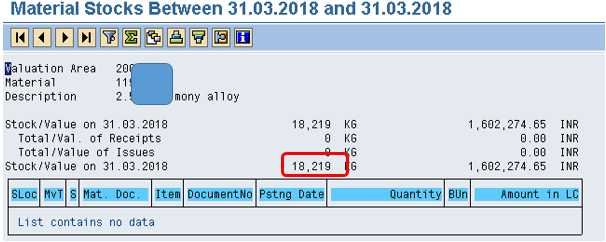
If we take year 2017, we have stocks on period 10 and 12. But details for year 11 is missing.
As per above logic the stock in period 11 is simply the stock in immediate available period just above 11, i.e 12 which is 18,219.00.
Note: 2017 / 11 is 28.02.18 and 2017 / 12 is 31.03.18.
Stock on 31.03.18 for material :
Stock on 28.02.18 for material :

The stock details are built for the periods determined automatically by the system in step 1.
4. Building the bucket stock information.
The bucket stocks are filled using following logic.
| Buckets | From Year / period | To Year period | Bucket stock derivation |
| 1 | 2019 / 11 | 2019 / 12 | Stock in period 2019/12 – stock in period 2019/11 |
| 2 | 2019 / 10 | 2019 / 11 | Stock in period 2019/11 – stock in period 2019/10 |
| 3 | 2019 / 09 | 2019 / 10 | Stock in period 2019/10 – stock in period 2019/09 |
| 4 | 2019 / 06 | 2019 / 09 | (Stock in period 2019/09 – stock in period 2019/08) + (Stock in period 2019/08 – stock in period 2019/07) + (Stock in period 2019/07- stock in period 2019/06). |
| 5 | 2018 / 12 | 2019 / 06 | (Stock in period 2019/06 – stock in period 2019/05) + (Stock in period 2019/05 – stock in period 2019/04) + (Stock in period 2019/04- stock in period 2019/03) + (stock in period 2019/03 – stock in period 2019/02)+ (Stock in period 2019/02 – stock in period 2019/01)+ (Stock in period 2019/01 – stock in period 2018/12). |
| 6 | 2018 / 12 | Stock in period 2018/12. |
Here for e.g., stock in period 2018/12 means stock at end of the 2018/12.
To check above logic with standard MB5B.
Suppose we have input bucket months as 24, 48, 54, 72, 96 for material .

The bucket details will be as below.
| Buckets | In months | From Year / period | To Year period |
| 1 | Within 24 month | 2017 / 12 | 2019 / 12 |
| 2 | Between 24 to 48 months | 2015 / 12 | 2017 / 12 |
| 3 | Between 48 to 54 months | 2015 / 06 | 2015 / 12 |
| 4 | Between 54 to 72 months | 2013 / 12 | 2015 / 06 |
| 5 | Between 72 to 96 months | 2011 /12 | 2013 /12 |
| 6 | Greater than 96 months | 2011 / 12 |
Converting the year / period info to dates.
Bucket 1: 2017/12 – 31.3.18 2019/12 – 31.3.20
Bucket 2: 2015/12 – 31.3.16 2017/12 – 31.3.18
Bucket 3: 2015/06 – 30.9.15 2015/12 – 31.3.16
Bucket 4: 2013/12 – 31.3.14 2015/06 – 30.09.15
Bucket 5: 2011/12 – 31.3.12 2013/12 – 31.3.14
For bucket 6 the stock on 2011/11 – 31.3.12 is taken.
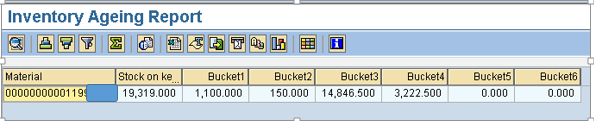
The ageing report output obtained is :

Comparing the above report with standard MB5B within the same periods:
Stock on key date 31.3.20 as per report : 19319.
Stock as per MB5B.
Bucket 1 period stock comparison:
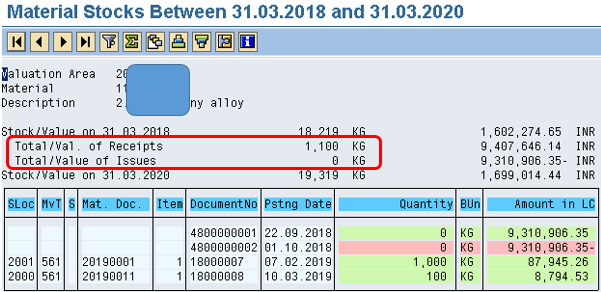
Bucket 1 period : Bucket 1: 2017/12 – 31.3.18 to 2019/12 – 31.3.20
Note: For bucket stock calculation , the difference of total goods receipt and issues within the period must be considered in MB5B.
Stock as per report : 1100.

Stock as per MB5B: (1100 = 1100 -0) / (Total Receipts – Total issues) in this period.
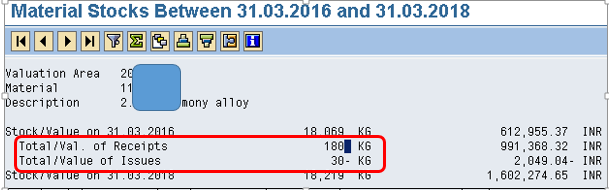
Bucket 2 period stock comparsion:
Bucket 2 period: 2015/12 – 31.3.16 to 2017/12 – 31.3.18
As per report: 150.

As per MB5B: (150 = 180 – 30)
Bucket 3 period stock comparison:
Bucket 3 period : 2015/06 – 30.9.15 to 2015/12 – 31.3.16
Stock as per report : 14846.5

As per MB5B : (14846.5 = 14850.5 – 4)

Bucket 4 stock comparison:
Bucket 4 period: 2013/12 – 31.3.14 to 2015/06 – 30.09.15
Stock as per report: 3222.5
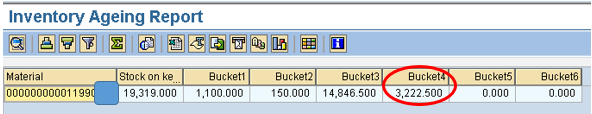
Stock as per MB5B : (3222.5 = 6958.5 – 3736)

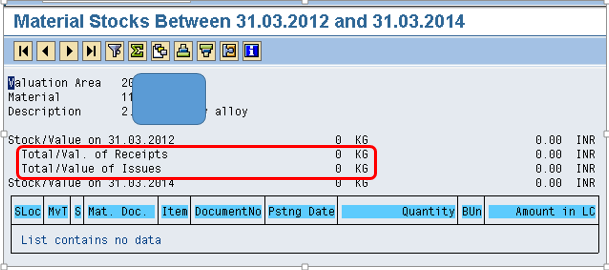
Bucket 5 stock comparison:
Bucket 5 period: 2011/12 – 31.3.12 to 2013/12 – 31.3.14
Stock as per report: 0
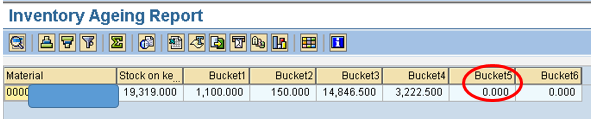
Stock as per MB5B: 0.
Bucket 6 stock comparison:
Bucket 6 is stock on 2011 / 11 – 31.3.12.
Stock as per report : 0.

Stock as per MB5B: 0

Sum of bucket stocks matches with stock on key date.
Special case:
There are scenarios when the last updated stock figure (most recent) in MBEWH could be something like year and period combination of 2020/04 and we are in current period of 2021/01. To get bucket stocks, we need to reconstruct or have all required period end stocks in place. Since in this case MBEWH is incomplete we look for an alternate method to get them.
We assume a April to March Fiscal period.
We wish to execute ageing from 30th april 2021 and current period is May 2021.
Material code is MAT1.
As per the discussed logic, we check table MBEW.
MBEW:
| Material | Lbkum(qty) | Year | Period |
| MAT1 | 100 | 2020 | 05 |
Date derivations
| Ageing cut off date | Year | Period |
| 30-apr-21 | 2021 | 01 |
| MBEW Year | MBEW Period |
| 2020 | 05 |
Since the year / period combination in MBEW is less than those of cut-off date, the stock of material MAT1 on cut-off date is same as stock in MBEW. (100 Units).
Now since we have an entry in MBEW with year / period 2020/05, it is clear that the last entry in MBEWH table (descending) will be 2020/04.
Since we predominantly rely on MBEWH period end stock to get bucket stocks, and in this case we don’t have any data above 2020/04 in MBEWH, we need to reconstruct them.
The reconstruction is simple. We can see that last update to stock was on 2020/05 (MBEW) and is same on 2021/01 as well.
We can utilise a custom table to populate the missing stock figures above 2020/04 (w.r.t MBEWH), which will serve as sort of extended MBEWH table.
| Material | LBKUM(qty) | Year | Period |
| MAT1 | 100 | 2020 | 12 |
| 100 | 2020 | 11 | |
| 100 | 2020 | 10 | |
| 100 | 2020 | 09 | |
| 100 | 2020 | 08 | |
| 100 | 2020 | 07 | |
| 100 | 2020 | 06 |
We know stock on 2021/01 is 100 units which is same as on 2020/05, and hence we substitute stock for all periods (end) from 2020/06 and above as 100 units.
We have stock figures for 2020/04 and 2020/05 (and hence 2020/01) available already, and we try to populate the missing figures only.
Summarizing:
We saw how to check if a material is slow moving, fast moving or non moving item, in a very simple manner using combination of valuated stock tables MBEW / MBEWH.
In my experience of developing this report using MKPF / MSEG tables, often it was a question of accuracy vs performance. If more accuracy is needed, it was required to use all the movement types executed for the material. In doing so however, performance use to take a hard hit.
This new logic however bridged the gap and now both accuracy and performance are equally achievable.
Even if it is felt that employing MKPF / MSEG tables have more choices to play with, but in my opinion even this report will be giving only a overview of stock information and a actual drill down will be required to micro analyse the material movement.
This said so, we can say that the same results are achievable in a swift manner using the new logic.
Note: This report can be tweaked to make it more flexible to display Ageing at storage location level and have bucket period in days by using combination of MARD/MARDH along with a minimal use of MSEG tables.
https://blogs.sap.com/2021/01/18/easy-method-to-derive-closing-stock-on-a-selected-date-with-minimal...
- SAP Managed Tags:
- MM (Materials Management),
- MM Inventory Management
32 Comments
You must be a registered user to add a comment. If you've already registered, sign in. Otherwise, register and sign in.
Labels in this area
-
"mm02"
1 -
A_PurchaseOrderItem additional fields
1 -
ABAP
1 -
ABAP Extensibility
1 -
ACCOSTRATE
1 -
ACDOCP
1 -
Adding your country in SPRO - Project Administration
1 -
Advance Return Management
1 -
AI and RPA in SAP Upgrades
1 -
Approval Workflows
1 -
Ariba
1 -
ARM
1 -
ASN
1 -
Asset Management
1 -
Associations in CDS Views
1 -
auditlog
1 -
Authorization
1 -
Availability date
1 -
Azure Center for SAP Solutions
1 -
AzureSentinel
2 -
Bank
1 -
BAPI_SALESORDER_CREATEFROMDAT2
1 -
BRF+
1 -
BRFPLUS
1 -
Bundled Cloud Services
1 -
business participation
1 -
Business Processes
1 -
CAPM
1 -
Carbon
1 -
Cental Finance
1 -
CFIN
1 -
CFIN Document Splitting
1 -
Cloud ALM
1 -
Cloud Integration
1 -
condition contract management
1 -
Connection - The default connection string cannot be used.
1 -
Custom Table Creation
1 -
Customer Screen in Production Order
1 -
Customizing
1 -
Data Quality Management
1 -
Date required
1 -
Decisions
1 -
desafios4hana
1 -
Developing with SAP Integration Suite
1 -
Direct Outbound Delivery
1 -
DMOVE2S4
1 -
EAM
1 -
EDI
3 -
EDI 850
1 -
EDI 856
1 -
edocument
1 -
EHS Product Structure
1 -
Emergency Access Management
1 -
Energy
1 -
EPC
1 -
Financial Operations
1 -
Find
1 -
FINSSKF
1 -
Fiori
1 -
Flexible Workflow
1 -
Gas
1 -
Gen AI enabled SAP Upgrades
1 -
General
1 -
generate_xlsx_file
1 -
Getting Started
1 -
HomogeneousDMO
1 -
How to add new Fields in the Selection Screen Parameter in FBL1H Tcode
1 -
IDOC
2 -
Integration
1 -
Learning Content
2 -
Ledger Combinations in SAP
1 -
LogicApps
2 -
low touchproject
1 -
Maintenance
1 -
management
1 -
Material creation
1 -
Material Management
1 -
MD04
1 -
MD61
1 -
methodology
1 -
Microsoft
2 -
MicrosoftSentinel
2 -
Migration
1 -
mm purchasing
1 -
MRP
1 -
MS Teams
2 -
MT940
1 -
Newcomer
1 -
Notifications
1 -
Oil
1 -
open connectors
1 -
Order Change Log
1 -
ORDERS
2 -
OSS Note 390635
1 -
outbound delivery
1 -
outsourcing
1 -
PCE
1 -
Permit to Work
1 -
PIR Consumption Mode
1 -
PIR's
1 -
PIRs
1 -
PIRs Consumption
1 -
PIRs Reduction
1 -
Plan Independent Requirement
1 -
POSTMAN
1 -
Premium Plus
1 -
pricing
1 -
Primavera P6
1 -
Process Excellence
1 -
Process Management
1 -
Process Order Change Log
1 -
Process purchase requisitions
1 -
Product Information
1 -
Production Order Change Log
1 -
purchase order
1 -
Purchase requisition
1 -
Purchasing Lead Time
1 -
Redwood for SAP Job execution Setup
1 -
RISE with SAP
1 -
RisewithSAP
1 -
Rizing
1 -
S4 Cost Center Planning
1 -
S4 HANA
1 -
S4HANA
3 -
S4HANACloud audit
1 -
Sales and Distribution
1 -
Sales Commission
1 -
sales order
1 -
SAP
2 -
SAP Best Practices
1 -
SAP Build
1 -
SAP Build apps
1 -
SAP CI
1 -
SAP Cloud ALM
1 -
SAP CPI
1 -
SAP Data Quality Management
1 -
SAP ERP
1 -
SAP Maintenance resource scheduling
2 -
SAP Note 390635
1 -
SAP S4HANA
2 -
SAP S4HANA Cloud private edition
1 -
SAP Upgrade Automation
1 -
SAP WCM
1 -
SAP Work Clearance Management
1 -
Schedule Agreement
1 -
SDM
1 -
security
2 -
Settlement Management
1 -
soar
2 -
Sourcing and Procurement
1 -
SSIS
1 -
SU01
1 -
SUM2.0SP17
1 -
SUMDMO
1 -
Teams
2 -
Time Management
1 -
User Administration
1 -
User Participation
1 -
Utilities
1 -
va01
1 -
vendor
1 -
vl01n
1 -
vl02n
1 -
WCM
1 -
X12 850
1 -
xlsx_file_abap
1 -
YTD|MTD|QTD in CDs views using Date Function
1
- « Previous
- Next »
Related Content
- batch wise inventory with actual cost in Enterprise Resource Planning Q&A
- Ways to create a purchase order in SAP in Enterprise Resource Planning Blogs by Members
- Recap of SAP S/4HANA 2023 Highlights Webinar: Manufacturing in Enterprise Resource Planning Blogs by SAP
- SAP S4HANA Cloud Public Edition Logistics FAQ in Enterprise Resource Planning Blogs by SAP
- Stock Ageing Report just gone live of SAP S/4HANA Cloud Public Edition in Enterprise Resource Planning Q&A
Top kudoed authors
| User | Count |
|---|---|
| 3 | |
| 3 | |
| 2 | |
| 2 | |
| 2 | |
| 2 | |
| 2 | |
| 2 | |
| 1 | |
| 1 |