
- SAP Community
- Products and Technology
- Enterprise Resource Planning
- ERP Blogs by SAP
- Reporting and Analytics in SAP SuccessFactors HXM ...
Enterprise Resource Planning Blogs by SAP
Get insights and updates about cloud ERP and RISE with SAP, SAP S/4HANA and SAP S/4HANA Cloud, and more enterprise management capabilities with SAP blog posts.
Turn on suggestions
Auto-suggest helps you quickly narrow down your search results by suggesting possible matches as you type.
Showing results for
Product and Topic Expert
Options
- Subscribe to RSS Feed
- Mark as New
- Mark as Read
- Bookmark
- Subscribe
- Printer Friendly Page
- Report Inappropriate Content
08-16-2017
9:30 AM
Update: I originally wrote a detailed post back at the end of 2017 when Report Center was released to explain how the various solutions for reporting, analytics & planning fit together to deliver a cohesive HR Reporting and Analytics experience in SuccessFactors.
Since then, there have been impressive improvements to the capabilities of reporting & analytics – in particular with the release of a new report type “Stories” - so it’s time to update this post.
The complexity inherent in HR Reporting and Analytics can be a challenge for any user without the right tools at their disposal. In 2017 the Report Center was born, and a simplified navigation for reporting, analytics and planning was delivered. Since then, the focus has been on creating a new and improved across SuccessFactors which culminated in the release of Stories in 2020.
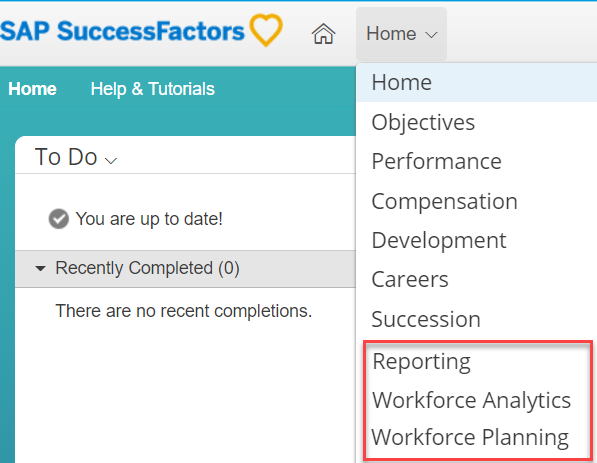
There are three key pillars to the SuccessFactors HXM Analytics solution. These are Reporting, Workforce Analytics and Workforce Planning. Information from across these pillars is also embedded throughout the SuccessFactors solution.
Reporting helps organizations present their data in meaningful and flexible formats to inform their business decisions. These decisions vary across different processes and the SuccessFactors reporting tools allow the customization of output to fit the business decision at hand. Whether it is a simple list of real time data or a dashboard of KPIs.
Reporting provides a set of simple templates to build formatted outputs using the data from the SuccessFactors solution, including data from the Workforce Analytics solution.
can be found through a simple consolidated space - the Report Center. This tool provides a one stop shop for all your Reporting needs, regardless of data source.
Through the Report Center you can create New Reports or you can Run, Edit, Share, Import/Export, Schedule and Label existing Reports. For more information on the full extent of Report Center capabilities you can find the Report Center Admin and User Guides on help.sap.com.
Reports can be built directly from the Report Center, providing several different Report formats that allow you to build reports that fit your needs. Each format provides a unique set of capabilities depending on what type of report you want to build.
Story [[[NEW]]]
Stories are a new reporting solution that allows you to tell compelling stories using a single solution with data from across the entire SAP SuccessFactors suite. Employee Central, Talent, Recruiting and many other areas. Whilst currently containing the vast majority of the SuccessFactors suite, othis will expand even further to cover other areas of SuccessFactors such as Learning which is in Beta testing and rolling out more broadly in 2021.
Stories is a paradigm shift in how you think about reporting in SuccessFactors; moving away from list reports or data exports and into modern, interactive experiences that easily convey insights to any end user.
Stories leverages common SAP technologies embedded seamlessly within SuccessFactors to deliver world class reporting and analytics capabilities to all SuccessFactors customers. This includes;
You can find out much more about the benefits of Stories and its capabilities, by viewing the resources here.
Note: Stories are the go-forward solution for all reporting in SuccessFactors. Over time the older report types (such as Canvas, Table, Tile & Dashboard) will be deprecated and only Stories will remain. This deprecation will happen over several years however, and there is no immediate impact to existing reports when enabling Stories. For more information on the deprecation plans please refer to the Customer Community.
Canvas
Canvas Reports can be used to onto a report page, these components can include Tables, Charts, Images or Text. Using these components reports can be created showcasing data from the SuccessFactors solution, including standalone transactional data and Workforce Analytics measures & dimensions.

Table
Table Reports are designed to be extremely simple to use, allowing you to easily select data from the SuccessFactors modules and to output that in a simple table. This table can then be easily exported as required.

Custom
Custom Reports provide the ability to build complex logic and layouts using BIRT (Business Intelligence and Reporting Tools). BIRT is an Open Source solution which can be embedded into SuccessFactors. This is done by uploading a BIRT template to any Table Report. The BIRT template then can apply complex logic to the data available within the Table Report, or can manipulate that data into a variety of charts and other visualisations. BIRT requires a more technical skillset than the other SuccessFactors Reporting tools, so SuccessFactors and Partners offer services to assist building these reports.

Tile
Tiles provide a simple chart output that can be embedded across the SuccessFactors suite. Tiles can be built using a Tile Builder Wizard which guides the user through the process of building a visualisation. Tiles support Drill to Detail (DtD) capabilities and DtD columns can be customised when building the Tile. Tiles can include both SuccessFactors Live data and Workforce Analytics data. Once built these tiles can be included in a Dashboard, embedded in the Home Page or Insights Panel.

Dashboard
Dashboards provide a method to easily collect and visualise multiple Tiles in a single place. Using Dashboards Tiles can be shown on one page, easily comparing multiple tactical metrics.

Standard Report templates are available for all core areas of the SAP SuccessFactors suite, including Performance, Goals, Succession, Recruiting, and Employee Central. These templates span a variety of Report Types and templates are being continually scoped and added.
For a concise summary of all Standard Report Templates available review the SuccessFactors Analytics Reporting Directory available on help.sap.com.
SuccessFactors Workforce Analytics (WFA) provides a single source for all workforce data, from many disparate sources. Regardless of whether those sources are from SAP, SuccessFactors or third party systems. The WFA process includes specialised Extract-Transform-Load (ETL) tasks to ensure all data is combined and transformed into a power people-centric data warehouse, with complex data distilled into useful metrics & dimensions to be analysed in a relevant way that drives advanced people-related decision making.
By utilising over 30 years of experience in HR analytics, SuccessFactors has developed over 2000 best practice metrics in addition to a fully customizable people model for reporting your HR data. These metrics are used across the WFA customer base, to allow for benchmarking your organisation against a similar area, location or industry.
WFA comprises of the Core Workforce & Mobility metrics packs based on core HR data, with over additional metrics packs available to add on as required. All metrics packs are designed to be intrinsically linked to get the best value out of your integrated data.
Standard Metric Pages
Metric Pages provide a quick and easy way to navigate the rich content of your custom people model provided by Workforce Analytics.
These Metric Pages allow different views of the WFA data without the need for building dedicated reports or queries.
Investigate
Investigate is a data exploration tool that allows engaged end users to analyze data quickly and easily. Investigate achieves this through robust search capability partnered with recommended metrics and visualizations utilising the comprehensive WFA metric library.
Analysts and HR business partners can utilise Investigate to analyse workforce issues and answer questions in less time. In addition to simple filtering, drill downs, and comparisons, you can easily e-mail and share analysis, and gain insight from forecasting and projections, instead of just looking back at historical trends.
As Human Resources engages in more frequent and increasingly sophisticated workforce planning, we are now on a trajectory to connect workforce planning activities with the larger enterprise business planning processes. It is vital to integrate data from other planning models into the workforce planning process, such as using sales forecasts for headcount projections or financial data for workforce cost assumptions. To achieve this integrated planning, it is necessary to manage workforce planning in a central, cross-enterprise planning platform that can accommodate multiple planning types. SAP Analytics Cloud for Planning provides this platform.
SAP provides a cloud-native cross-enterprise planning platform that can accommodate multiple planning types. With SAP Analytics Cloud for Planning you can;
To help accelerate implementations of SAP Analytics Cloud for Planning the tool comes with a content network with templates for Workforce Planning and other processes. These templates can serve as a starting point for customizing SAP Analytics Cloud for Planning to your specific business needs.
The current library includes for both Strategic Workforce Planning and Operational Headcount Planning processes. Discover more about the SAP Best Practices for this product https://rapid.sap.com/bp/BP_SF_WFP
Strategic Workforce Planning ensures the contribution of the HR strategy to the business’s success and strategic objectives. It is a planning solution that helps to predict the future development of workforce demand, supply and gap and define risk responses to close the gap.
Key Process Steps
Business Benefits
Operational Headcount Planning is a solution that supports the yearly planning of headcount or full-time equivalents on the level of hires, terminations and transfers and their salaries and merit increases.
Key Process Steps
Business Benefits
Check out other new features across our HXM solution suite
Learn about other new features and enhancements across the full SAP SuccessFactors HXM Suite by following the What's New Viewer.
Note: this is an informational post and comments are not monitored
Since then, there have been impressive improvements to the capabilities of reporting & analytics – in particular with the release of a new report type “Stories” - so it’s time to update this post.
The complexity inherent in HR Reporting and Analytics can be a challenge for any user without the right tools at their disposal. In 2017 the Report Center was born, and a simplified navigation for reporting, analytics and planning was delivered. Since then, the focus has been on creating a new and improved across SuccessFactors which culminated in the release of Stories in 2020.
There are three key pillars to the SuccessFactors HXM Analytics solution. These are Reporting, Workforce Analytics and Workforce Planning. Information from across these pillars is also embedded throughout the SuccessFactors solution.
Reporting
Reporting helps organizations present their data in meaningful and flexible formats to inform their business decisions. These decisions vary across different processes and the SuccessFactors reporting tools allow the customization of output to fit the business decision at hand. Whether it is a simple list of real time data or a dashboard of KPIs.
Reporting provides a set of simple templates to build formatted outputs using the data from the SuccessFactors solution, including data from the Workforce Analytics solution.
can be found through a simple consolidated space - the Report Center. This tool provides a one stop shop for all your Reporting needs, regardless of data source.
Through the Report Center you can create New Reports or you can Run, Edit, Share, Import/Export, Schedule and Label existing Reports. For more information on the full extent of Report Center capabilities you can find the Report Center Admin and User Guides on help.sap.com.

Report Types
Reports can be built directly from the Report Center, providing several different Report formats that allow you to build reports that fit your needs. Each format provides a unique set of capabilities depending on what type of report you want to build.

Story [[[NEW]]]
Stories are a new reporting solution that allows you to tell compelling stories using a single solution with data from across the entire SAP SuccessFactors suite. Employee Central, Talent, Recruiting and many other areas. Whilst currently containing the vast majority of the SuccessFactors suite, othis will expand even further to cover other areas of SuccessFactors such as Learning which is in Beta testing and rolling out more broadly in 2021.
Stories is a paradigm shift in how you think about reporting in SuccessFactors; moving away from list reports or data exports and into modern, interactive experiences that easily convey insights to any end user.
Stories leverages common SAP technologies embedded seamlessly within SuccessFactors to deliver world class reporting and analytics capabilities to all SuccessFactors customers. This includes;
- Search capabilities to easily find the data you need
- Simple drag & drop interface for building queries & visualizations
- Data explorer for advanced users to flexibly filter and drill into the data
- Linked analysis to enable interactive dashboards for all end users
- Modern visualizations
- Simplified administrative processes to manage data permissions
- and much more!
You can find out much more about the benefits of Stories and its capabilities, by viewing the resources here.

Note: Stories are the go-forward solution for all reporting in SuccessFactors. Over time the older report types (such as Canvas, Table, Tile & Dashboard) will be deprecated and only Stories will remain. This deprecation will happen over several years however, and there is no immediate impact to existing reports when enabling Stories. For more information on the deprecation plans please refer to the Customer Community.
Canvas
Canvas Reports can be used to onto a report page, these components can include Tables, Charts, Images or Text. Using these components reports can be created showcasing data from the SuccessFactors solution, including standalone transactional data and Workforce Analytics measures & dimensions.
Table
Table Reports are designed to be extremely simple to use, allowing you to easily select data from the SuccessFactors modules and to output that in a simple table. This table can then be easily exported as required.
Custom
Custom Reports provide the ability to build complex logic and layouts using BIRT (Business Intelligence and Reporting Tools). BIRT is an Open Source solution which can be embedded into SuccessFactors. This is done by uploading a BIRT template to any Table Report. The BIRT template then can apply complex logic to the data available within the Table Report, or can manipulate that data into a variety of charts and other visualisations. BIRT requires a more technical skillset than the other SuccessFactors Reporting tools, so SuccessFactors and Partners offer services to assist building these reports.
Tile
Tiles provide a simple chart output that can be embedded across the SuccessFactors suite. Tiles can be built using a Tile Builder Wizard which guides the user through the process of building a visualisation. Tiles support Drill to Detail (DtD) capabilities and DtD columns can be customised when building the Tile. Tiles can include both SuccessFactors Live data and Workforce Analytics data. Once built these tiles can be included in a Dashboard, embedded in the Home Page or Insights Panel.
Dashboard
Dashboards provide a method to easily collect and visualise multiple Tiles in a single place. Using Dashboards Tiles can be shown on one page, easily comparing multiple tactical metrics.
Standard Report Templates
Standard Report templates are available for all core areas of the SAP SuccessFactors suite, including Performance, Goals, Succession, Recruiting, and Employee Central. These templates span a variety of Report Types and templates are being continually scoped and added.
For a concise summary of all Standard Report Templates available review the SuccessFactors Analytics Reporting Directory available on help.sap.com.
Workforce Analytics
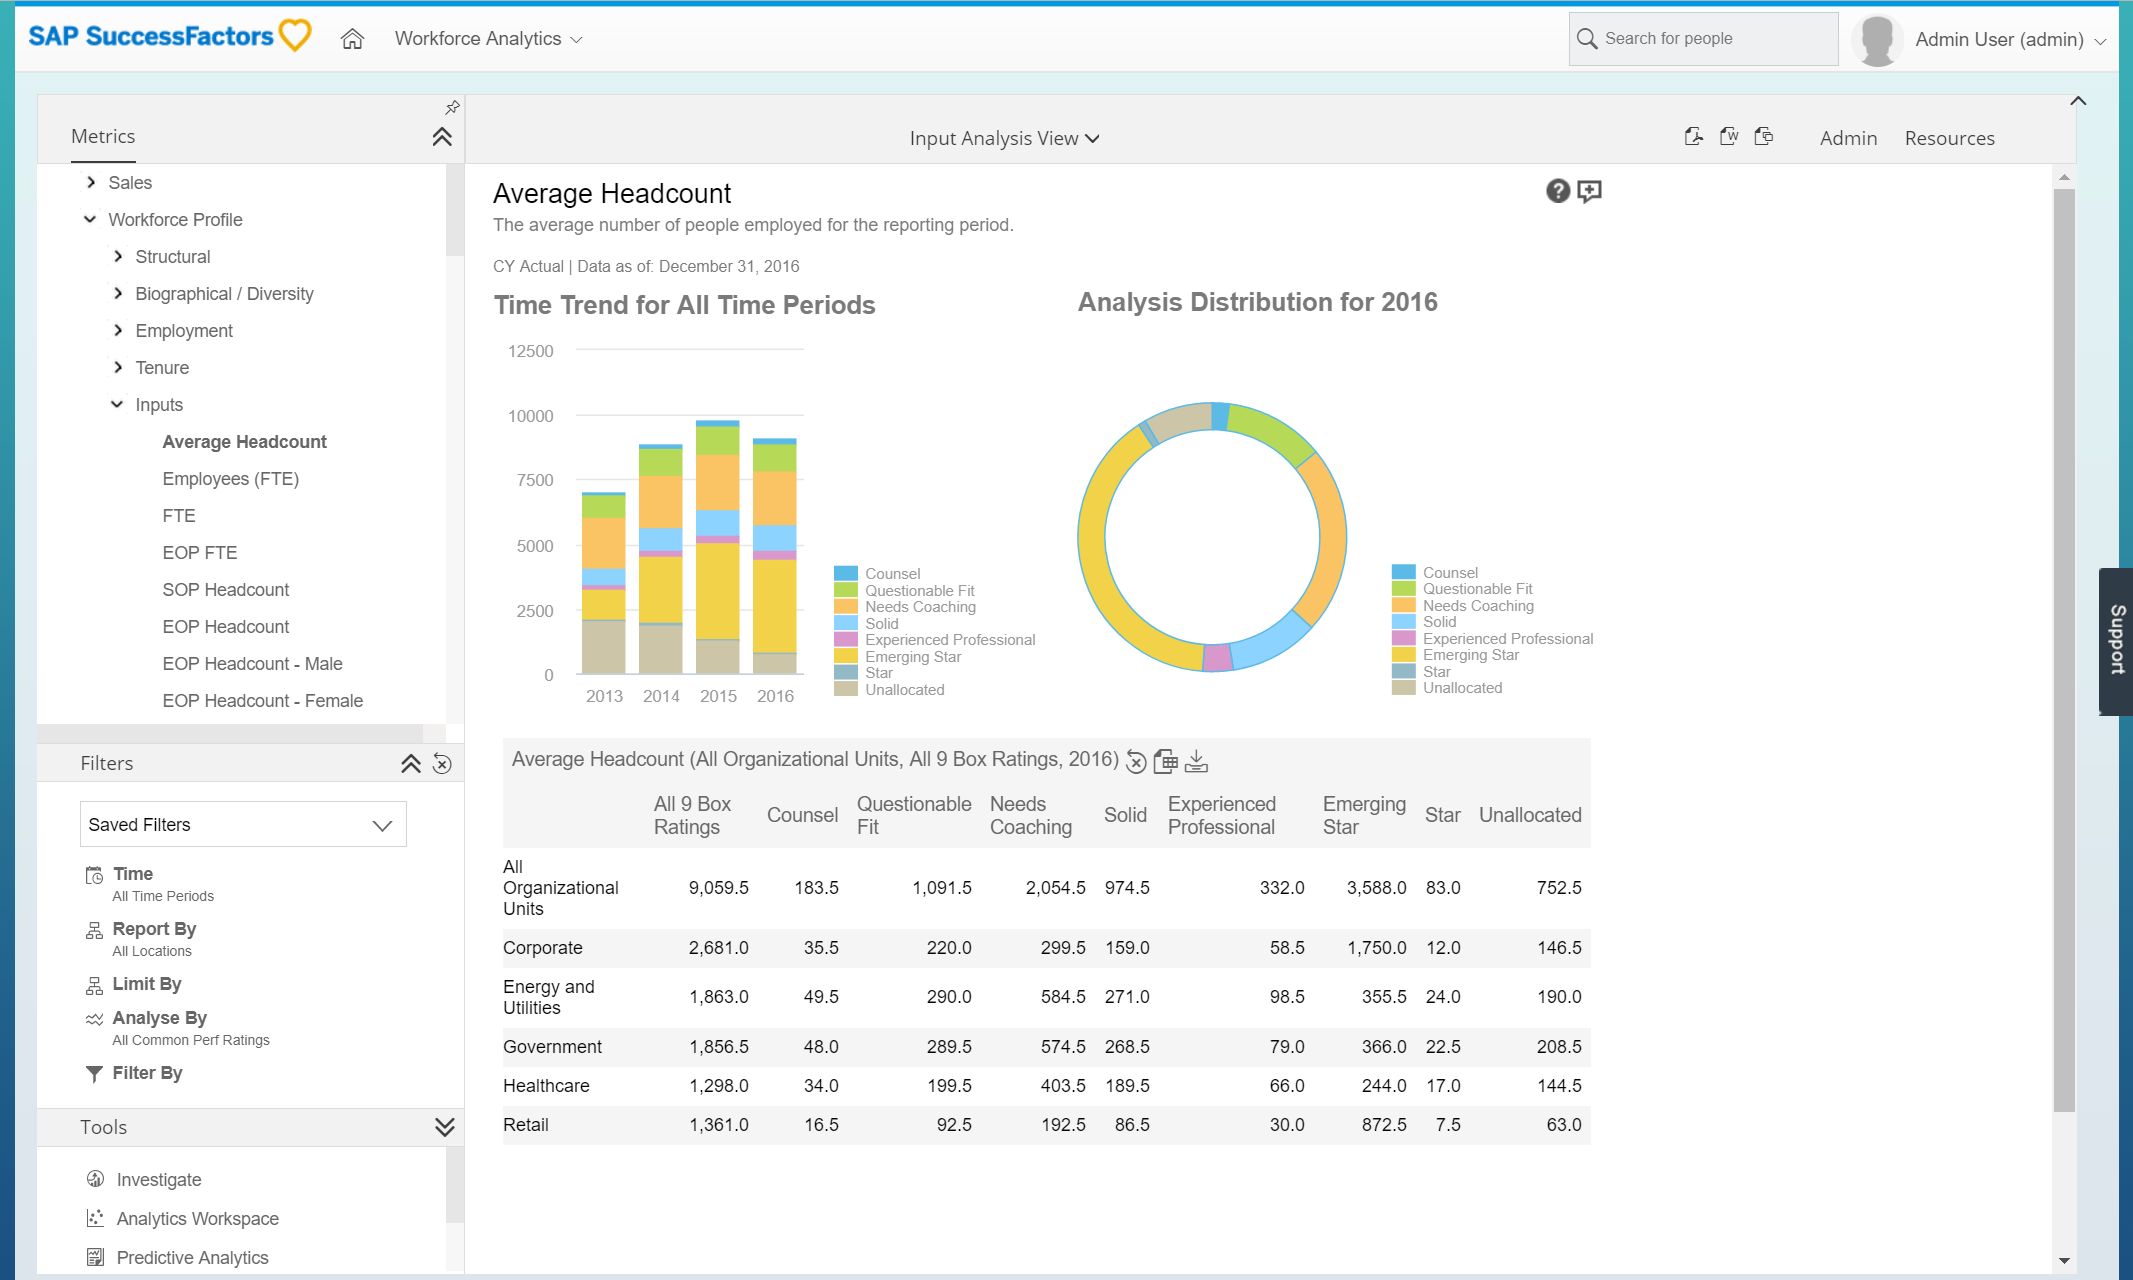
SuccessFactors Workforce Analytics (WFA) provides a single source for all workforce data, from many disparate sources. Regardless of whether those sources are from SAP, SuccessFactors or third party systems. The WFA process includes specialised Extract-Transform-Load (ETL) tasks to ensure all data is combined and transformed into a power people-centric data warehouse, with complex data distilled into useful metrics & dimensions to be analysed in a relevant way that drives advanced people-related decision making.
By utilising over 30 years of experience in HR analytics, SuccessFactors has developed over 2000 best practice metrics in addition to a fully customizable people model for reporting your HR data. These metrics are used across the WFA customer base, to allow for benchmarking your organisation against a similar area, location or industry.
WFA comprises of the Core Workforce & Mobility metrics packs based on core HR data, with over additional metrics packs available to add on as required. All metrics packs are designed to be intrinsically linked to get the best value out of your integrated data.
Standard Metric Pages
Metric Pages provide a quick and easy way to navigate the rich content of your custom people model provided by Workforce Analytics.
These Metric Pages allow different views of the WFA data without the need for building dedicated reports or queries.
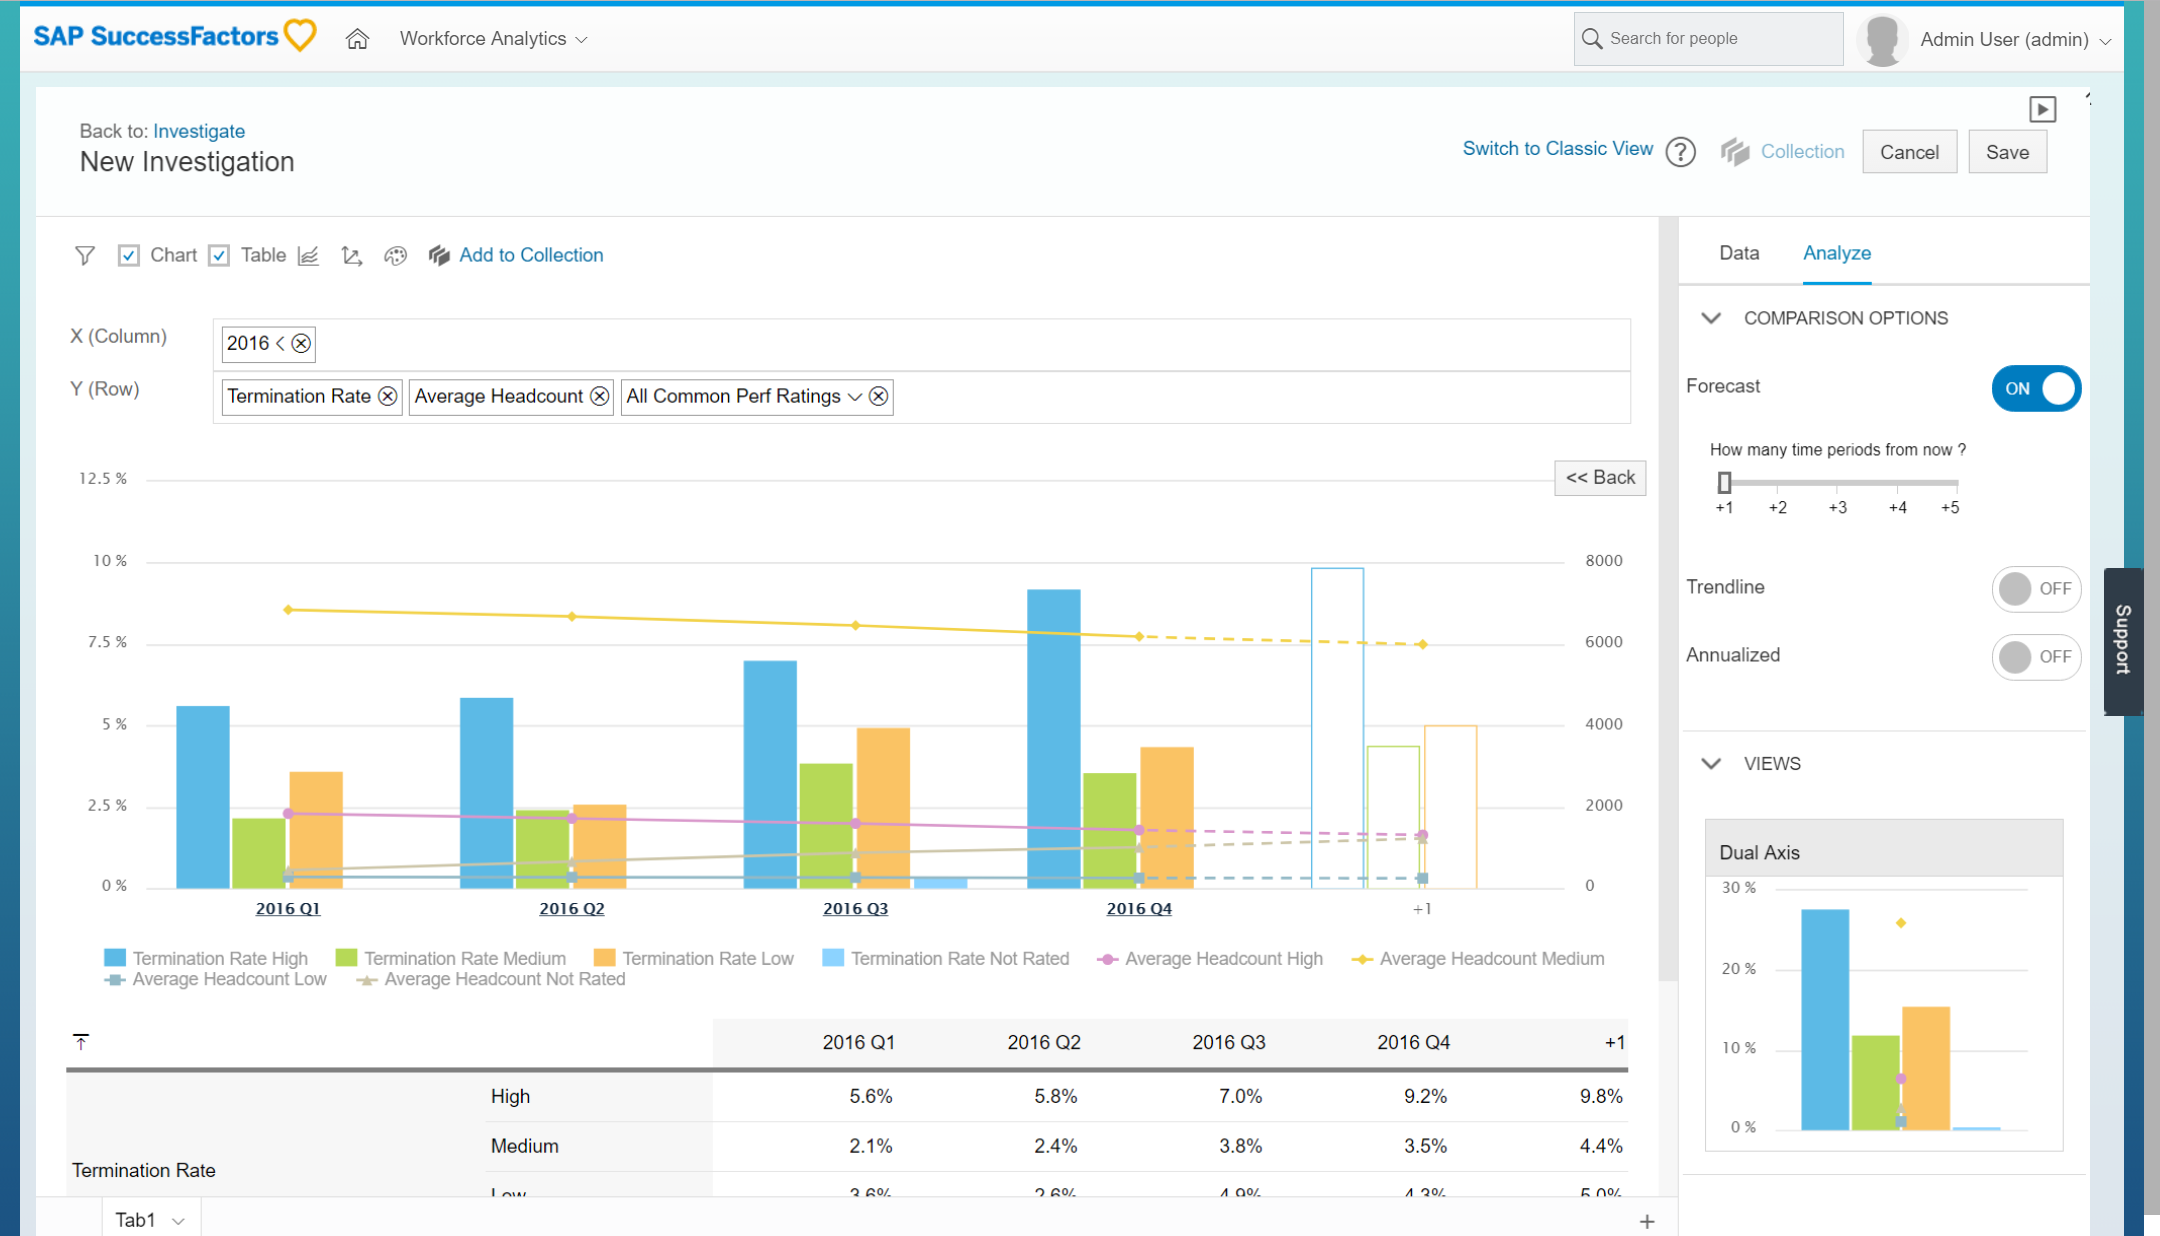
Investigate
Investigate is a data exploration tool that allows engaged end users to analyze data quickly and easily. Investigate achieves this through robust search capability partnered with recommended metrics and visualizations utilising the comprehensive WFA metric library.
Analysts and HR business partners can utilise Investigate to analyse workforce issues and answer questions in less time. In addition to simple filtering, drill downs, and comparisons, you can easily e-mail and share analysis, and gain insight from forecasting and projections, instead of just looking back at historical trends.
- Investigate provides you with a powerful, yet easy to use interactive data exploration capability for casual and advanced users
- Investigate combines a clean, intuitive UI powered by SAP Fiori
- Accelerate analysis through recommendations from comprehensive library of metrics, dimensions and data visualizations
- Instant forecasts for all metrics
Workforce Planning
As Human Resources engages in more frequent and increasingly sophisticated workforce planning, we are now on a trajectory to connect workforce planning activities with the larger enterprise business planning processes. It is vital to integrate data from other planning models into the workforce planning process, such as using sales forecasts for headcount projections or financial data for workforce cost assumptions. To achieve this integrated planning, it is necessary to manage workforce planning in a central, cross-enterprise planning platform that can accommodate multiple planning types. SAP Analytics Cloud for Planning provides this platform.

SAP provides a cloud-native cross-enterprise planning platform that can accommodate multiple planning types. With SAP Analytics Cloud for Planning you can;
- Create workforce planning models that fit your exact business needs
- Access your actuals, forecast, budgets and predictions in one view
- Run advanced predictive scenarios based on classification, regression and forecasting
- Create scripted applications to meet sophisticated business requirements
- Leverage data from other planning models (like budget planning, revenue forecasts, production forecasts) in your workforce planning process
- Modern visualizations and design
- Advanced data actions for cost calculations, forecasting, copying data across plans, etc.
- Built-in connector to Workforce Analytics to source HR metrics and dimensions
- Built-in connector to Employee Central to source employee data (list of employees)
To help accelerate implementations of SAP Analytics Cloud for Planning the tool comes with a content network with templates for Workforce Planning and other processes. These templates can serve as a starting point for customizing SAP Analytics Cloud for Planning to your specific business needs.
The current library includes for both Strategic Workforce Planning and Operational Headcount Planning processes. Discover more about the SAP Best Practices for this product https://rapid.sap.com/bp/BP_SF_WFP
Strategic Workforce Planning
Strategic Workforce Planning ensures the contribution of the HR strategy to the business’s success and strategic objectives. It is a planning solution that helps to predict the future development of workforce demand, supply and gap and define risk responses to close the gap.

Key Process Steps
- Prepare System for Strategic Forecast Planning
- Prepare Demand and Supply Headcount Forecast
- Create Demand, Supply and Gap Headcount Forecast
- Finalize Strategic Forecast
- Perform Risk Assessment
- Prepare Risk Response
- Create Risk Response
- Finalize Risk Response Strategy
Business Benefits
- Aligning strategic workforce objectives with corporate strategic goals
- Workforce planning activities based on historic data from SAP SuccessFactors
- Modeling scenarios for future workforce demand, supply and gap (shortages and surplus) along planning dimensions
- Defining transparent risk response strategies (HR interventions) to close forecasted gaps
- Using powerful analytical charts to visualize planning forecasts, planning scenarios, risk identification and risk responses
Operational Headcount Planning
Operational Headcount Planning is a solution that supports the yearly planning of headcount or full-time equivalents on the level of hires, terminations and transfers and their salaries and merit increases.

Key Process Steps
- Prepare System for Operational Headcount Planning
- Validate Planner Views
- Create New Positions
- Create Headcount & Full-Time Equivalent Forecast
- Create Annual Salary & Merit Percentage Forecast
- Analyze Plan Headcount and Full-Time Equivalent Forecast
- Analyze Actual and Plan Headcount and Full-Time Equivalent Forecast
- Analyze Actual vs. Plan Headcount and Full-Time Equivalent Forecast
Business Benefits
- Planning on headcount or full-time equivalent basis
- Accurate and up-to-date headcount and salary information from SAP SuccessFactors feeding the planning process
- Centralized planning solution for all headcount planning activities
Check out other new features across our HXM solution suite
Learn about other new features and enhancements across the full SAP SuccessFactors HXM Suite by following the What's New Viewer.
Note: this is an informational post and comments are not monitored
Labels:
18 Comments
You must be a registered user to add a comment. If you've already registered, sign in. Otherwise, register and sign in.
Labels in this area
-
Artificial Intelligence (AI)
1 -
Business Trends
363 -
Business Trends
29 -
Customer COE Basics and Fundamentals
1 -
Digital Transformation with Cloud ERP (DT)
1 -
Event Information
461 -
Event Information
28 -
Expert Insights
114 -
Expert Insights
188 -
General
1 -
Governance and Organization
1 -
Introduction
1 -
Life at SAP
414 -
Life at SAP
2 -
Product Updates
4,679 -
Product Updates
274 -
Roadmap and Strategy
1 -
Technology Updates
1,499 -
Technology Updates
100
Related Content
- Custom Analytical Queries as an alternative for LIS in SAP S/4HANA Production Planning (PP) in Enterprise Resource Planning Blogs by SAP
- NF3-e Nota Técnica 2024.001: novos campos na nota fiscal eletrônica de energia elétrica in Enterprise Resource Planning Blogs by SAP
- NF3-e Technical Note 2024.001: New Fields Added to Electronic Nota Fiscal for Electrical Energy in Enterprise Resource Planning Blogs by SAP
- Adding Custom Fields to Migration Objects in SAP S/4HANA Cloud Public Edition in Enterprise Resource Planning Blogs by SAP
- SAP Enterprise Support Academy Newsletter May 2024 in Enterprise Resource Planning Blogs by SAP
Top kudoed authors
| User | Count |
|---|---|
| 7 | |
| 6 | |
| 4 | |
| 4 | |
| 4 | |
| 3 | |
| 3 | |
| 3 | |
| 3 | |
| 3 |