
- SAP Community
- Products and Technology
- Human Capital Management
- HCM Blogs by Members
- Creating Month Start and End Dates for Headcount F...
Human Capital Management Blogs by Members
Gain valuable knowledge and tips on SAP SuccessFactors HCM suite and human capital management market from member blog posts. Share your insights with a post of your own.
Turn on suggestions
Auto-suggest helps you quickly narrow down your search results by suggesting possible matches as you type.
Showing results for
bellakong
Participant
Options
- Subscribe to RSS Feed
- Mark as New
- Mark as Read
- Bookmark
- Subscribe
- Printer Friendly Page
- Report Inappropriate Content
12-05-2023
9:03 AM
Reporting headcount at each month end or tracking employees who are active during a specific month has consistently ranked among the most demanding requests for HR professionals utilizing SuccessFactors Story Reports. Addressing these challenges often involves navigating the inherent limitations within the Story functionality. This blog aims to be a guiding light, offering solutions to overcome obstacles and empower HR fellows in their reporting endeavors within SuccessFactors.
In the evolving landscape of HR analytics, this post serves as the inaugural step, focusing on the creation of month start and end dates—a pivotal aspect for generating insightful headcount follow-up reports. As we tackle this fundamental requirement, we pave the way for future discussions on period reports, including topics such as tracking new hires, leavers, and measuring intricate balances. Let's embark on this journey together, conquering the reporting obstacles that come with SuccessFactors Story Reports.
Before we dive into the details, ensure the following prerequisites are in place:
Access to SAP SuccessFactors with the necessary permissions for Story Reporting.
Familiarity with the data model relevant to headcount reporting. For example Employee Central and how employment details (different dates) have been configured in your system, and which are used for the count.
Definitions of who should be included during what period.
In this blog, I will use 2 examples. One is for a monthly following up headcount rolling back to 13 month, and the other one is for count new hires or active employees by month within a full year.
Screen shots were taken using Classic Design Experience in story report.
First case: Rolling back based on current date
Creating Month Start
SuccessFactors has no calendar date which can be used for reporting employee job information (excluding time sheet). Therefor, before reporting any headcount based on period, you have to create a month start date and a month end date (24 calculated columns in query) in order to built a timeline.
Open the Story Reporting page and select the relevant data source and chose needed columns for the report. In the example, it is Job information, time filter is As of Today because this report is reflecting up to date job information for all the employees.
Define current month first day (current month first day -1 will be the end date for previous month)
You are able to set the calculated columns as hidden (Off) or visible in story (On), including in Preview) once it has been created:
Create another calculated column as previous month 1st date. All the first date of each month should be created first.
In the same logic, create another 11 calculated columns until previous 12 month 1 start date.
At this point, it is highly recommended to save query and save the story report with the data source you have created.
Creating Month End
Based on the month start date you have created, create a new calculated column as previous month end date
Same logic for the rest of the month end date until previous 13 month end date
Now the timeline has been created rolling back 13 month in your query. After saving the query, you can either pull out a table list or create a chart to validate if all the start date and end dates have been calculated correctly.
Example Usage in Story Reports:
To visualize and validate the calculated columns created earlier, follow these steps:
The table list will pull the date based on the selection:
Second example: reporting new hire or active employees based on 12 months in 2023
Same step to create calculated columns in the query, however it is much simpler:
Jan 1st 2023
Jan 31st 2023
Same for the rest month start date and month end date.
Because these dates are fixed as in the formula, you may need to create a new story report for another year's reporting demand.
Best Practices:
Regularly save your work to prevent data loss.
Validate the accuracy of calculated columns by previewing the data source.
Be aware of some of important limitations in query for story report: 30 tables and 120 columns.
Next Steps:
Hope this blog will help you in the journey mastering the creation of month start and end dates for headcount follow-up reports. As you navigate the SuccessFactors reporting landscape, keep these best practices in mind to ensure the integrity and precision of your analyses.
Stay tuned for upcoming blogs in this series, where we'll delve into more specific period reports. The next installment will guide you through reporting headcount, new hires, and leavers based on the time structures you've built using the concepts discussed above. These insights will further empower you to harness the full potential of SuccessFactors Story Reports for nuanced and comprehensive workforce analytics.
Feel free to share your experiences and questions in the comments below. Your feedback is invaluable as we explore the intricacies of SuccessFactors reporting together.
In the evolving landscape of HR analytics, this post serves as the inaugural step, focusing on the creation of month start and end dates—a pivotal aspect for generating insightful headcount follow-up reports. As we tackle this fundamental requirement, we pave the way for future discussions on period reports, including topics such as tracking new hires, leavers, and measuring intricate balances. Let's embark on this journey together, conquering the reporting obstacles that come with SuccessFactors Story Reports.
Before we dive into the details, ensure the following prerequisites are in place:
Access to SAP SuccessFactors with the necessary permissions for Story Reporting.
Familiarity with the data model relevant to headcount reporting. For example Employee Central and how employment details (different dates) have been configured in your system, and which are used for the count.
Definitions of who should be included during what period.
In this blog, I will use 2 examples. One is for a monthly following up headcount rolling back to 13 month, and the other one is for count new hires or active employees by month within a full year.
Screen shots were taken using Classic Design Experience in story report.
First case: Rolling back based on current date
Creating Month Start
SuccessFactors has no calendar date which can be used for reporting employee job information (excluding time sheet). Therefor, before reporting any headcount based on period, you have to create a month start date and a month end date (24 calculated columns in query) in order to built a timeline.
Open the Story Reporting page and select the relevant data source and chose needed columns for the report. In the example, it is Job information, time filter is As of Today because this report is reflecting up to date job information for all the employees.

Create calculated columns in the Column Overviews
Define current month first day (current month first day -1 will be the end date for previous month)

TODATE(CONCAT( CONCAT( CONCAT( TOTEXT(

MONTH(CURRENTDATE())),"/"),  TOTEXT ( YEAR(CURRENTDATE()))),

"/01"), "mm/yyyy/dd")
You are able to set the calculated columns as hidden (Off) or visible in story (On), including in Preview) once it has been created:

Create another calculated column as previous month 1st date. All the first date of each month should be created first.
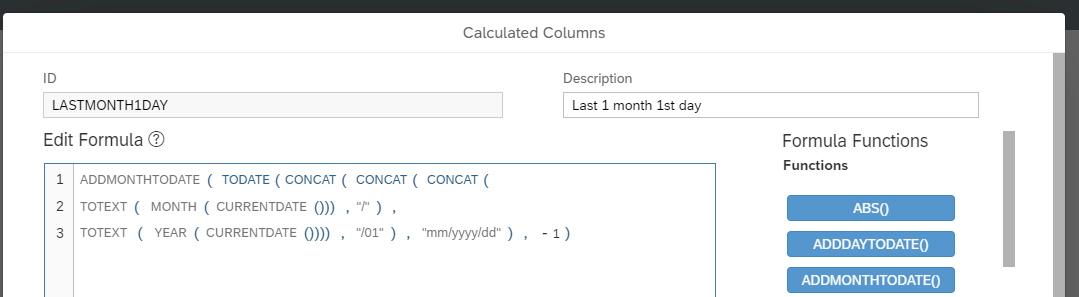
ADDMONTHTODATE( TODATE(CONCAT( CONCAT( CONCAT(

TOTEXT( MONTH(CURRENTDATE())),"/"),

TOTEXT ( YEAR(CURRENTDATE()))), "/01"), "mm/yyyy/dd"), -1)
In the same logic, create another 11 calculated columns until previous 12 month 1 start date.
ADDMONTHTODATE( TODATE(CONCAT(

CONCAT( CONCAT( TOTEXT( MONTH(CURRENTDATE())),"/"),

TOTEXT ( YEAR(CURRENTDATE()))), "/01"), "mm/yyyy/dd"), -12)
At this point, it is highly recommended to save query and save the story report with the data source you have created.
Creating Month End
Based on the month start date you have created, create a new calculated column as previous month end date

ADDDAYTODATE([CURRENTMONTH1DAY],-1)Hit Preview in the query and test if they are performing as expected (Current date in screen shot = 12/03/2023😞
Same logic for the rest of the month end date until previous 13 month end date

ADDDAYTODATE([LAST12MONTH1DAY],-1)Now the timeline has been created rolling back 13 month in your query. After saving the query, you can either pull out a table list or create a chart to validate if all the start date and end dates have been calculated correctly.
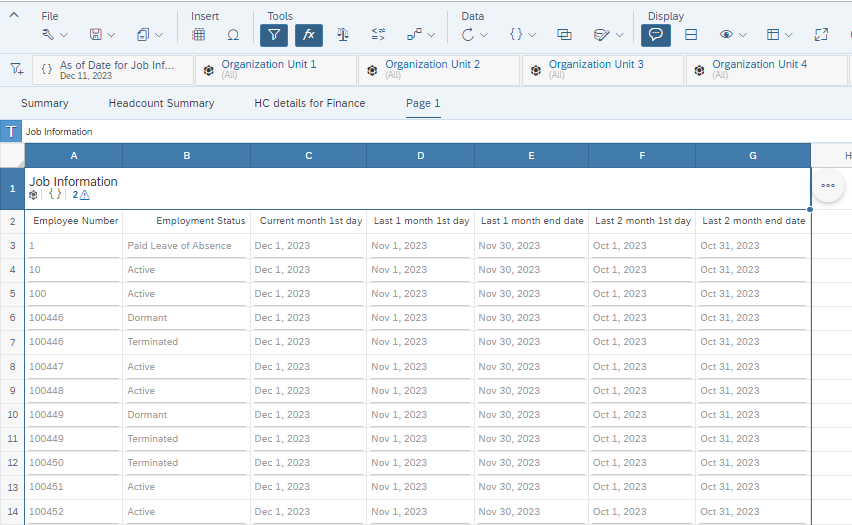
Example Usage in Story Reports:
To visualize and validate the calculated columns created earlier, follow these steps:
- Insert a table list (List, non-aggregated) in the Grid page.
- Open the dropdown list under 'Column', starting with Employee ID for consistency in checking established dates for further calculations.

The table list will pull the date based on the selection:
Second example: reporting new hire or active employees based on 12 months in 2023
Same step to create calculated columns in the query, however it is much simpler:
Jan 1st 2023
TODATE("01/01/2023", "mm/dd/yyyy")Jan 31st 2023
TODATE("01/31/2023", "mm/dd/yyyy")Same for the rest month start date and month end date.
Because these dates are fixed as in the formula, you may need to create a new story report for another year's reporting demand.
Best Practices:
Regularly save your work to prevent data loss.
Validate the accuracy of calculated columns by previewing the data source.
Be aware of some of important limitations in query for story report: 30 tables and 120 columns.
Next Steps:
Hope this blog will help you in the journey mastering the creation of month start and end dates for headcount follow-up reports. As you navigate the SuccessFactors reporting landscape, keep these best practices in mind to ensure the integrity and precision of your analyses.
Stay tuned for upcoming blogs in this series, where we'll delve into more specific period reports. The next installment will guide you through reporting headcount, new hires, and leavers based on the time structures you've built using the concepts discussed above. These insights will further empower you to harness the full potential of SuccessFactors Story Reports for nuanced and comprehensive workforce analytics.
Feel free to share your experiences and questions in the comments below. Your feedback is invaluable as we explore the intricacies of SuccessFactors reporting together.
13 Comments
You must be a registered user to add a comment. If you've already registered, sign in. Otherwise, register and sign in.
Labels in this area
-
1H 2024 Product Release
5 -
2H 2023 Product Release
1 -
ACCRUAL TRANSFER
1 -
Advanced Workflow
1 -
AI
1 -
AI & Skills Ontology
1 -
Anonymization
1 -
API and Integration
1 -
BTP
1 -
Business Rules
2 -
Calibrating with Performance Form Data
1 -
Canvas Report
1 -
Career Development
1 -
Certificate-Based Authentication
1 -
Cloud Identity Services
1 -
Cloud Platform Integration
1 -
Common Super Domain
1 -
Compensation
1 -
Compensation Information Management
1 -
Compensation Management
1 -
Compliance
2 -
Content
1 -
Conversational AI
2 -
CSD
1 -
Custom Data Collection
1 -
Custom event
1 -
custom portlet
1 -
Data & Analytics
1 -
Data Integration
1 -
Dayforce
1 -
deep link
1 -
deeplink
1 -
Delimiting Pay Components
1 -
Deprecation
1 -
EC Payroll
1 -
Employee Central
1 -
Employee Central Global Benefits
1 -
Employee Central Integration (Inc. EC APIs)
1 -
Employee Central Payroll
2 -
employee profile
2 -
Employee Rehires
2 -
external terminal
1 -
external time events
1 -
Generative AI
2 -
Getting Started
1 -
Global Benefits
1 -
Goals
1 -
Guidelines
1 -
h12024
1 -
H2 2023
1 -
HCM
1 -
HR
2 -
HR Data Management
1 -
HR Transformation
1 -
ilx
1 -
Incentive Management Setup (Configuration)
1 -
Integration Center
3 -
Integration Monitoring
1 -
Integration Suite
1 -
Intelligent Services
1 -
internal mobility
1 -
Introduction
1 -
Learning
3 -
LMS
2 -
LXP
1 -
Massively MDF attachments download
1 -
Mentoring
1 -
Metadata Framework
1 -
Middleware Solutions
1 -
OCN
1 -
ODATA
1 -
OData APIs
2 -
ONB USA Compliance
1 -
Onboarding
2 -
Opportunity Marketplace
1 -
Pay Component Management
1 -
PCE
1 -
Performance & Goals
1 -
Performance Form
1 -
Performance Forms
1 -
Platform
1 -
portlet
1 -
POSTMAN
1 -
Predictive AI
2 -
Recruiting
1 -
recurring payments
1 -
RISE PCE
1 -
Role Based Permissions (RBP)
2 -
S4 HANA On-Premise
1 -
SAP Build CodeJam
1 -
SAP Build Marketplace
1 -
SAP CPI (Cloud Platform Integration)
1 -
SAP HCM
1 -
SAP HCM (Human Capital Management)
3 -
SAP HCM ECC
1 -
SAP HR Solutions
2 -
SAP Integrations
1 -
SAP release
1 -
SAP successfactors
7 -
SAP SuccessFactors Customer Community
1 -
SAP SuccessFactors OData API
2 -
SAP Workzone
1 -
SAP-PAYROLL
1 -
self-service migration
1 -
sftp
1 -
SFTP scenario
1 -
Skills
1 -
Skills Management
1 -
sso deeplink
1 -
Stories in People Analytics
3 -
Story Report
1 -
SuccessFactors
3 -
SuccessFactors Employee central home page customization.
1 -
SuccessFactors Onboarding
1 -
successfactors onboarding i9
1 -
SuccessFactors Platform
1 -
Table Report
1 -
talent
1 -
Talent Intelligence Hub
2 -
talentintelligencehub
1 -
talents
1 -
Tax
1 -
Tax Integration
1 -
TIH
1 -
Time Accounts
1 -
Time Management implementation links
1 -
Workflows
1 -
XML Rules
1
- « Previous
- Next »
Related Content
- How to create measure based input control in successfactors people analytics stories in Human Capital Management Q&A
- SAP SuccessFactors and Contingent Workers in Human Capital Management Blogs by Members
- A Deep Dive into Tacking New Hires and Leavers Trends - How to build monthly trending reports by using story report tool in SuccessFactors in Human Capital Management Blogs by Members
- Creating Month Start and End Dates for Headcount Follow-Up in Story Reports in Human Capital Management Blogs by Members
- Structuring the Workforce with Ingentis and SAP in Human Capital Management Blogs by SAP
Top kudoed authors
| User | Count |
|---|---|
| 5 | |
| 5 | |
| 4 | |
| 3 | |
| 2 | |
| 2 | |
| 2 | |
| 2 | |
| 1 | |
| 1 |