
- SAP Community
- Products and Technology
- Product Lifecycle Management
- PLM Blogs by SAP
- Enterprise Analytics for your Supply Chain
Product Lifecycle Management Blogs by SAP
Dive into product lifecycle management news, learn about digitalizing PLM for the digital supply chain, and stay informed with product updates from SAP.
Turn on suggestions
Auto-suggest helps you quickly narrow down your search results by suggesting possible matches as you type.
Showing results for
Advisor
Options
- Subscribe to RSS Feed
- Mark as New
- Mark as Read
- Bookmark
- Subscribe
- Printer Friendly Page
- Report Inappropriate Content
08-31-2021
8:52 PM
Core to the SAP value proposition is the interoperability of processes and industry standard definitions of analytics. The latest iteration of our DSC applications in cloud are no exception to this. We have made lots of progress on the topic and continue to develop new and intuitive ways to leverage this. At the very start of this approach, we see that there are multiple levels that make up the offering to ensure re-use and harmony across the platform. Having everything running on top of the SAP Business Technology Platform is what makes the entire approach possible. This common foundational layer across the applications ensures interoperability, scale, and growth across the entire portfolio for both technology and applications together. The image below highlights how the technology supports the SAP Digital Supply Chain Applications and how the applications support the higher-level analytics capabilities provided by SAP Analytics Cloud.
Figure 1: High-level depiction of the technology and application layers
The foundational layer, running in cloud, is quickly deployed and easily adaptable over time because it is managed entirely by SAP and provided for use by all applications. Each application or pillar running on top of the Business Technology Platform (BTP), shares a common data model and structure but drives it with its own unique business transaction and process value. The transactions drive verticals within the organization and have standardized definitions of performance (Key Performance Indicators or KPIs) specific for those processes.
Alignment on goals, objectives and also visibility into the current state of operations is key to ensuring alignment between the enterprise and plant operations levels within an organization. Weather the purpose is to review strategic goals and production targets to Improve Plant Performance and ROI or to understand how current production KPIs influence the broader topline executive performance goals, having the same data supporting the analysis is key to ensuring consistency and alignment. The vertical integration is key for success within the manufacturing organization (aka pillar) so that when there are questions asked and root cause analysis performed there is alignment at all levels. This singular version of the truth, driven by live processes, provides the clearest picture as possible of the current and historical state of manufacturing and how it relates to the broader supply chain. The vertical visibility of rolling manufacturing upwards to the executive boardroom ensures that the strategic picture of manufacturing health is represented live and broader across all operations. Today we provide this vertical integration with a few simple steps (SAP DMC & SAC Integration Guide) to reinforce the value of Shop-Floor to Top-Floor. From here we see views of SAP DMC data in SAC Stories alongside of other enterprise data which typically consists of reports around overall cost of goods sold and various customer satisfaction indices to name a few:
Figure 2: SAP Analytics Cloud live connection to SAP DMCi KPIs (Standard & Custom)
The consistency at the top levels within the organization ensure that the leadership has their ear to the ground on manufacturing performance as it relates to their overall manufacturing goals and ultimately how well it is aligned to their corporate objectives as well.
The other aspect of this is the ability to take the corporate objectives and views from the SAC Stories and bring them down closer to the plants so that Plant Managers and Line/Operations supervisors can directly see the impact of their current performance on the executive level KPIs. This also helps to align the operations team to understand the impact that various scenarios and decisions have on the top level. This is provided by Visualization of SAC Stories in the SAP DMCi Dashboard Designer and something that is strategic for SAP to deliver to reinforce the Top-Floor to Shop-Floor value. In the screen-captures below you can see exactly how this translates to the side-by-side live views of operational KPIs in SAP DMCi and the embedded SAC Story pushed down from the top level:
Figure 3: SAP Analytics Cloud Stories embedded in SAP DMCi Dashboard Designer
This ability also helps the operations team to better interact with the executives supporting their business cases and ties the events that happen at the real-world operations level to executive level KPIs. The value of being able to associate various operations events with the executive view of analytics means that the business case to reduce or completely resolve these issues can be done in a much clearer and targeted manner.
These KPIs often have horizontal linkages to ensure that end-users are linked together to align on tactical/immediate responses to issues that can arise and ensure alignment and order of priorities to address the issues. One clear example of the horizontal value is how SAP Integrated Business Planning (IBP) aligns to SAP Digital Manufacturing Cloud (DMC) to provide what we call Contextual Navigation. Essentially linking the logistics team to the real-time output of manufacturing so that load plans and deliveries can be coordinated with production actuals:
Figure 4: Contextual Navigation from SAP IBP Control Tower to SAP DMC Plant Insights
The horizontal linkage is provided as a standard option and enabled to be achieved seamlessly for customers to quickly take advantage of. Both SAP IBP and SAP DMC are sharing the same definition of plan, schedule, inventory, yield, and geography so coordination between logistics and production becomes second nature rather than a task around discovery and lookups across many systems.
Growth of any organization is never easy to drive, especially when there are so many different processes and systems in place along with tribal knowledge that may or may not extend across the various verticals (pillars). When we take a step back and really start to grasp what the true power can be for this vertical and horizontal linkage of the enterprise, many opportunities arise for new and powerful ways to analyze your business to foster alignment, collaboration and ultimately continuous improvement. At the top level for an organization the ability to be profitable and to remain profitable in the future is often one of the key goals. It also is the area where opportunity meets investment (CAPEX & OPEX) for manufacturing and one previously discussed regarding the topic of Intelligent Profitability. The concept of proactively funding operations to reduce losses based on forecasted production volumes and planned usage of capacities across your production environment is only possible because manufacturing, planning, and technical analysis are all within reach. The main reason behind this is that the business processes and functions in SAP IBP are linked with the business processes and functions in SAP DMC. The same production plan and inventory information is shared with the orchestration, execution, and production volumes from manufacturing.
Figure 5: Transactional and Analytical Linkages across the systems
Deviations from the plan and ultimately production volumes (aka yield) are shown live and track with the SAP DMC provided OEE Insights which is the way historical losses are shown. When we mix these historical losses with the forecasted production volumes by material, routes, capacities, shift schedules, and locations we can start to identify forecasted losses and turn OEE from a rear-view mirror KPI into a forward looking one. The combination of these systems bring forward a very powerful view of opportunity and allows executives to readily identify the “Cost of Doing Nothing” and build their business cases for strategic investments into operations.
Figure 6: Intelligent Profitability use-case and how it spans supply chain and analytics
Then the next step in the process is to turn the forecasted losses into a business opportunity where we can identify areas that have the largest impact on improvement, and we can start to apply tools to support the improvements in a structured way.
Figure 7: Continuous improvement supported by Intelligent Profitability
From here we have a combination of views that are quickly easily generated at the scale of the entire enterprise for Profit Loss analysis along with investment opportunity along with a means of understanding where the most impact is:
Figure 8: Preview of how SAC, IBP, and DMC support and track this process
This concept of Intelligent Profitability does help to close the all too familiar gap between what the plants are asking for around investment and how the enterprise leadership teams prioritize these asks. With this level of details on actuals, forecast and combined with what-if the action plan and business priorities can be quickly and easily evaluated in real-time so that the organization can quickly adapt and pivot based on need and informed decisions.
For more updates on what we are doing to support the next wave Industry 4.0 in manufacturing see our updates on Intelligent Factories.

Figure 1: High-level depiction of the technology and application layers
The foundational layer, running in cloud, is quickly deployed and easily adaptable over time because it is managed entirely by SAP and provided for use by all applications. Each application or pillar running on top of the Business Technology Platform (BTP), shares a common data model and structure but drives it with its own unique business transaction and process value. The transactions drive verticals within the organization and have standardized definitions of performance (Key Performance Indicators or KPIs) specific for those processes.
Vertical Visibility (Consistency Between Shop-Floor and Top-Floor)
Alignment on goals, objectives and also visibility into the current state of operations is key to ensuring alignment between the enterprise and plant operations levels within an organization. Weather the purpose is to review strategic goals and production targets to Improve Plant Performance and ROI or to understand how current production KPIs influence the broader topline executive performance goals, having the same data supporting the analysis is key to ensuring consistency and alignment. The vertical integration is key for success within the manufacturing organization (aka pillar) so that when there are questions asked and root cause analysis performed there is alignment at all levels. This singular version of the truth, driven by live processes, provides the clearest picture as possible of the current and historical state of manufacturing and how it relates to the broader supply chain. The vertical visibility of rolling manufacturing upwards to the executive boardroom ensures that the strategic picture of manufacturing health is represented live and broader across all operations. Today we provide this vertical integration with a few simple steps (SAP DMC & SAC Integration Guide) to reinforce the value of Shop-Floor to Top-Floor. From here we see views of SAP DMC data in SAC Stories alongside of other enterprise data which typically consists of reports around overall cost of goods sold and various customer satisfaction indices to name a few:
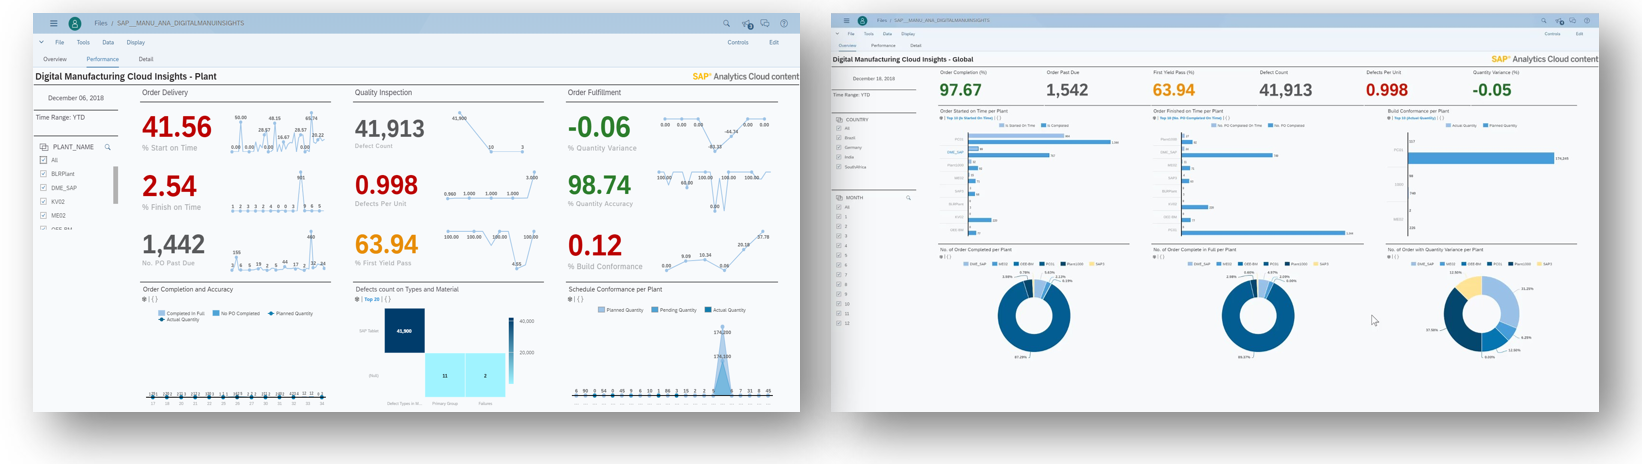
Figure 2: SAP Analytics Cloud live connection to SAP DMCi KPIs (Standard & Custom)
The consistency at the top levels within the organization ensure that the leadership has their ear to the ground on manufacturing performance as it relates to their overall manufacturing goals and ultimately how well it is aligned to their corporate objectives as well.
The other aspect of this is the ability to take the corporate objectives and views from the SAC Stories and bring them down closer to the plants so that Plant Managers and Line/Operations supervisors can directly see the impact of their current performance on the executive level KPIs. This also helps to align the operations team to understand the impact that various scenarios and decisions have on the top level. This is provided by Visualization of SAC Stories in the SAP DMCi Dashboard Designer and something that is strategic for SAP to deliver to reinforce the Top-Floor to Shop-Floor value. In the screen-captures below you can see exactly how this translates to the side-by-side live views of operational KPIs in SAP DMCi and the embedded SAC Story pushed down from the top level:

Figure 3: SAP Analytics Cloud Stories embedded in SAP DMCi Dashboard Designer
This ability also helps the operations team to better interact with the executives supporting their business cases and ties the events that happen at the real-world operations level to executive level KPIs. The value of being able to associate various operations events with the executive view of analytics means that the business case to reduce or completely resolve these issues can be done in a much clearer and targeted manner.
Horizontal Visibility (Ensure data is actionable)
These KPIs often have horizontal linkages to ensure that end-users are linked together to align on tactical/immediate responses to issues that can arise and ensure alignment and order of priorities to address the issues. One clear example of the horizontal value is how SAP Integrated Business Planning (IBP) aligns to SAP Digital Manufacturing Cloud (DMC) to provide what we call Contextual Navigation. Essentially linking the logistics team to the real-time output of manufacturing so that load plans and deliveries can be coordinated with production actuals:

Figure 4: Contextual Navigation from SAP IBP Control Tower to SAP DMC Plant Insights
The horizontal linkage is provided as a standard option and enabled to be achieved seamlessly for customers to quickly take advantage of. Both SAP IBP and SAP DMC are sharing the same definition of plan, schedule, inventory, yield, and geography so coordination between logistics and production becomes second nature rather than a task around discovery and lookups across many systems.
Enterprise Analytics (Bringing it all Together)
Growth of any organization is never easy to drive, especially when there are so many different processes and systems in place along with tribal knowledge that may or may not extend across the various verticals (pillars). When we take a step back and really start to grasp what the true power can be for this vertical and horizontal linkage of the enterprise, many opportunities arise for new and powerful ways to analyze your business to foster alignment, collaboration and ultimately continuous improvement. At the top level for an organization the ability to be profitable and to remain profitable in the future is often one of the key goals. It also is the area where opportunity meets investment (CAPEX & OPEX) for manufacturing and one previously discussed regarding the topic of Intelligent Profitability. The concept of proactively funding operations to reduce losses based on forecasted production volumes and planned usage of capacities across your production environment is only possible because manufacturing, planning, and technical analysis are all within reach. The main reason behind this is that the business processes and functions in SAP IBP are linked with the business processes and functions in SAP DMC. The same production plan and inventory information is shared with the orchestration, execution, and production volumes from manufacturing.

Figure 5: Transactional and Analytical Linkages across the systems
Deviations from the plan and ultimately production volumes (aka yield) are shown live and track with the SAP DMC provided OEE Insights which is the way historical losses are shown. When we mix these historical losses with the forecasted production volumes by material, routes, capacities, shift schedules, and locations we can start to identify forecasted losses and turn OEE from a rear-view mirror KPI into a forward looking one. The combination of these systems bring forward a very powerful view of opportunity and allows executives to readily identify the “Cost of Doing Nothing” and build their business cases for strategic investments into operations.

Figure 6: Intelligent Profitability use-case and how it spans supply chain and analytics
Then the next step in the process is to turn the forecasted losses into a business opportunity where we can identify areas that have the largest impact on improvement, and we can start to apply tools to support the improvements in a structured way.

Figure 7: Continuous improvement supported by Intelligent Profitability
From here we have a combination of views that are quickly easily generated at the scale of the entire enterprise for Profit Loss analysis along with investment opportunity along with a means of understanding where the most impact is:

Figure 8: Preview of how SAC, IBP, and DMC support and track this process
This concept of Intelligent Profitability does help to close the all too familiar gap between what the plants are asking for around investment and how the enterprise leadership teams prioritize these asks. With this level of details on actuals, forecast and combined with what-if the action plan and business priorities can be quickly and easily evaluated in real-time so that the organization can quickly adapt and pivot based on need and informed decisions.
For more updates on what we are doing to support the next wave Industry 4.0 in manufacturing see our updates on Intelligent Factories.
Labels:
1 Comment
You must be a registered user to add a comment. If you've already registered, sign in. Otherwise, register and sign in.
Labels in this area
Related Content
- Top SAP PLM Sessions You Cannot Miss at SAP Sapphire Orlando 2024! in Product Lifecycle Management Blogs by SAP
- Implementation Insights from Experts for SAP Enterprise Product Development in Product Lifecycle Management Blogs by SAP
- Extending SAP Digital Manufacturing with Azure, Part II: Applying the reference architecture to a visual inspection scenario in Product Lifecycle Management Blogs by Members
- Discover SAP Enterprise Product Development – November 2023 Edition in Product Lifecycle Management Blogs by SAP
- Maximizing Profitability: Increase Re-Use in the Discrete Industry in Product Lifecycle Management Blogs by SAP
Top kudoed authors
| User | Count |
|---|---|
| 4 | |
| 3 | |
| 2 | |
| 2 | |
| 1 | |
| 1 |