
- SAP Community
- Products and Technology
- Technology
- Technology Blogs by SAP
- [CPI] CPI-Helper Chrome Extension - Swiss Army Kni...
Technology Blogs by SAP
Learn how to extend and personalize SAP applications. Follow the SAP technology blog for insights into SAP BTP, ABAP, SAP Analytics Cloud, SAP HANA, and more.
Turn on suggestions
Auto-suggest helps you quickly narrow down your search results by suggesting possible matches as you type.
Showing results for
dominic4
Active Participant
Options
- Subscribe to RSS Feed
- Mark as New
- Mark as Read
- Bookmark
- Subscribe
- Printer Friendly Page
- Report Inappropriate Content
09-02-2021
4:07 PM
Hello Integrators,
it is a while since my last post. The CPI-Helper developed and I thought it is a good idea to sum up how the CPI-Helper can make your life easier in case you use Chrome or Edge as Browser. Special thanks goes to Deva Prasad Arava who helped me with this post.
Another special thanks to all the people out there who help to make CPI development more easy and add missing features like Fatih Pense with his GroovyIDE that saved me houres of work.
If you like the CPI-Helper, please follow this post for new features. You can also follow me on LinkedIn for updates
What is the CPI-Helper Plugin?
If you do not know the CPI-Helper, it is an open source Chrome Browser plug-in that extends the Cloud Platform Integration with some cool new features that helps you during development/testing of Integration Flows.
- Sidebar with processed messages
- Activate Inline Trace to see message route in integration flow designer
- Directly see trace messages in integration flow designer
- Pretty print for trace messages in integration flow designer
- Button to switch on trace
- Directly go to traces of specific message
- Directly go to logs and attachments of specific message
- Pop-up with error-message when hovering message in sidebar
- Pop-up with deployment info
- View and delete variables in info pop-up
- Customize the CPI tenant page & icon
Installation
Install directly from Chrome Web Store. After installation, you see the icon in the browser bar. If it is not shown, you must pin this addon by clicking the Extensions

Icon.
![]()
![]()
The above pin Icon can be used to pin this CPI-Helper Extension to make it visible all the time and shows how it looks once it is done.

At first it is grey, but it activates when you are on a CPI page. The new buttons will be added automatically when you are on the integration flow designer.

How does it look like?
If you installed the plugin, you will have three more buttons in the integration flow designer:
Main features of CPI-Helper Plugin
Trace
This button helps you to activate & deactivate trace without navigating away from the Integration flow designer.

When this button is enabled, the trace option will be activated for that artifact and a message notification also will be displayed at the bottom of the screen. Trace highlighted in Red color indicates that the Trace option is enabled and active for the artifact.


To deactivate the trace, click on the Trace button and a message notification at the bottom of the screen will be displayed indicating that Trace will not be triggered anymore automatically.

Messages
This button provide information about Artifact State, Message Log fetch last update time, Deployed timestamp, recent message log details.

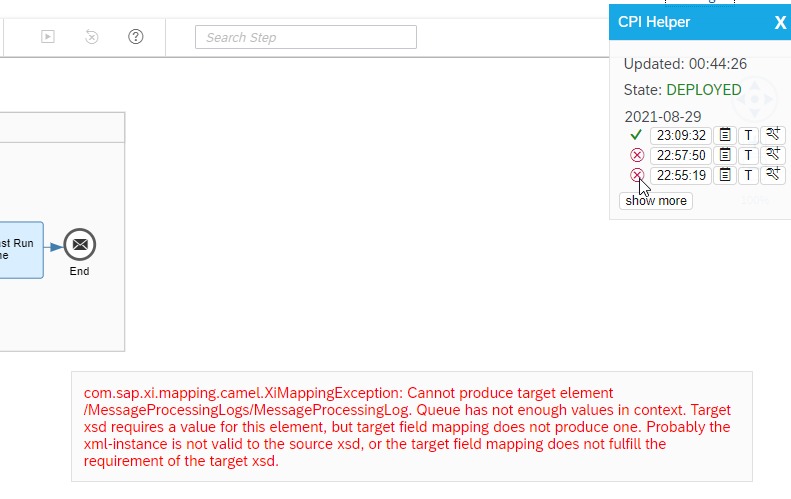
Message Status Symbol
By hovering the cursor over Success or Fail


symbol, It will provide overview of error information of the message in case of failures. Using this option, no need to navigate to monitoring page to find out error details is needed anymore.
Timestamp
This will display the time at which message has been executed.
Message Icon
This will navigate to Message Processing Log Attachments page where we can get Log and Attachment details.
Trace/Info Icon

‘T’ indicates that the artifact has been executed in Trace mode and ‘I’ indicates that the artifact has been executed in Info mode. By clicking on this icon, it will redirect us to the Message Processing Run page where we can find the Integration Flow Model, Log Content & Message Content details depending on the mode it has been executed.

Inline Debugging Mode
Only for Trace mode, the Inline Debugging can be activated by clicking the

icon. This will enable the Inline Debugging which will give option to check the Trace data for each step of the flow.
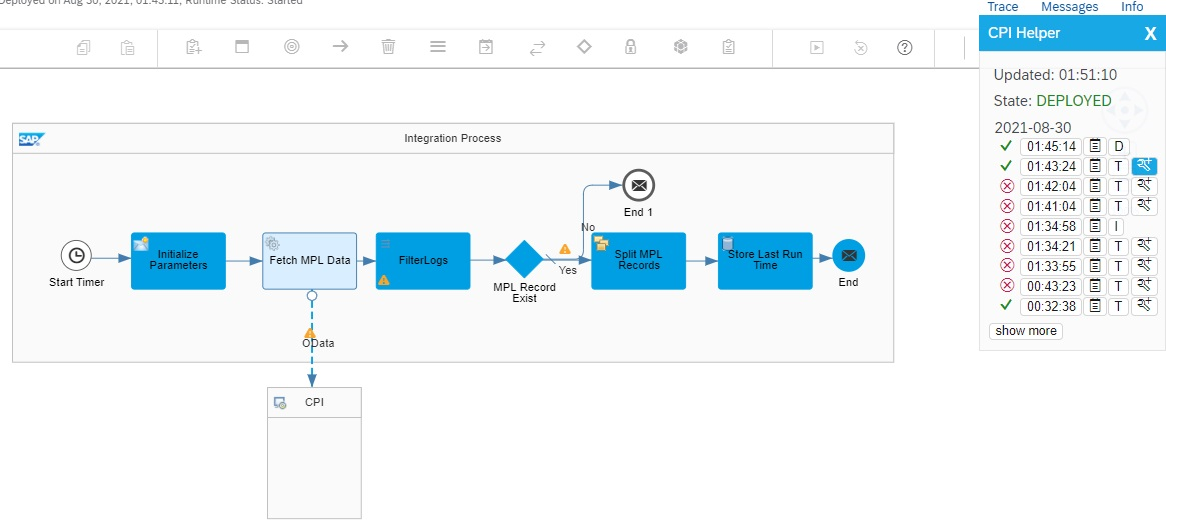
On activating the Inline Debugging mode, the Settings icon will be highlighted, and all the integration flow elements will be highlighted that are part of the message execution.
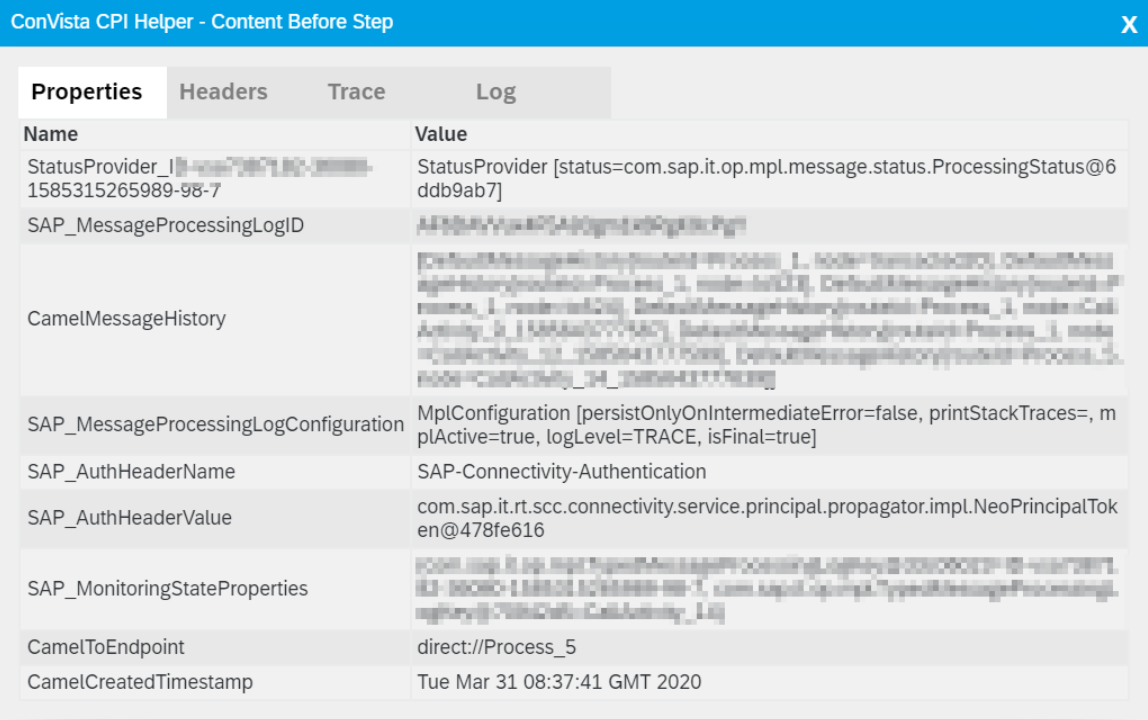
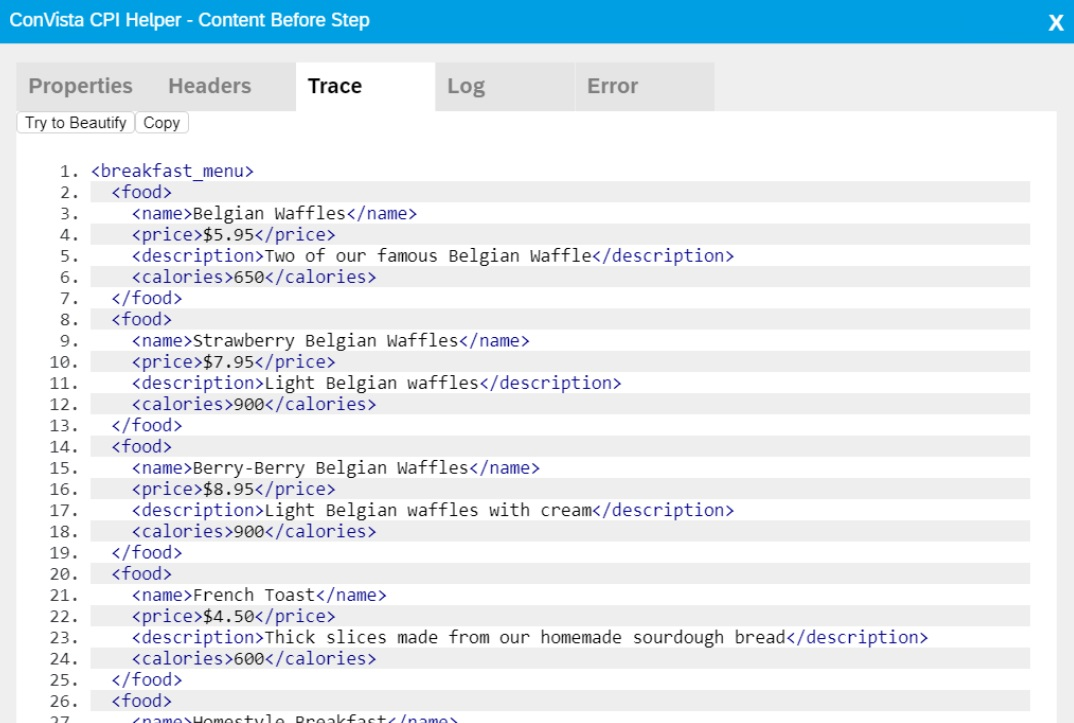
Selecting each highlighted step will throw a pop-up that contains details about Properties, Headers, Body & Log.
XML and Json Payloads can be beautified using “Try to Beautify” button.
Attention: Traces will be deleted by SAP after round about 1 hour. So, you can see the run steps but not the message itself on the next day.
Info: This button provides information about Artifact Name, Symbolic Name, Trace Status, Deployed On, Deployment Status, Semantic State, Deployed by and Global & Local Variable details.
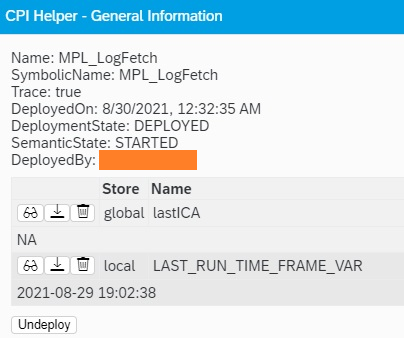
The latest values assigned to these variables can be viewed, downloaded and can be deleted using the above 3 options next to Variable name.
So, if you installed the CPI-Helper in your Chrome Browser, you can easily access variables after pressing the Info button in the Integration Flows designer.
The Extension Popup
This can be opened when clicking the Cloud

Icon in the browser bar. It is colored and working when on CPI page. The popup looks like this:
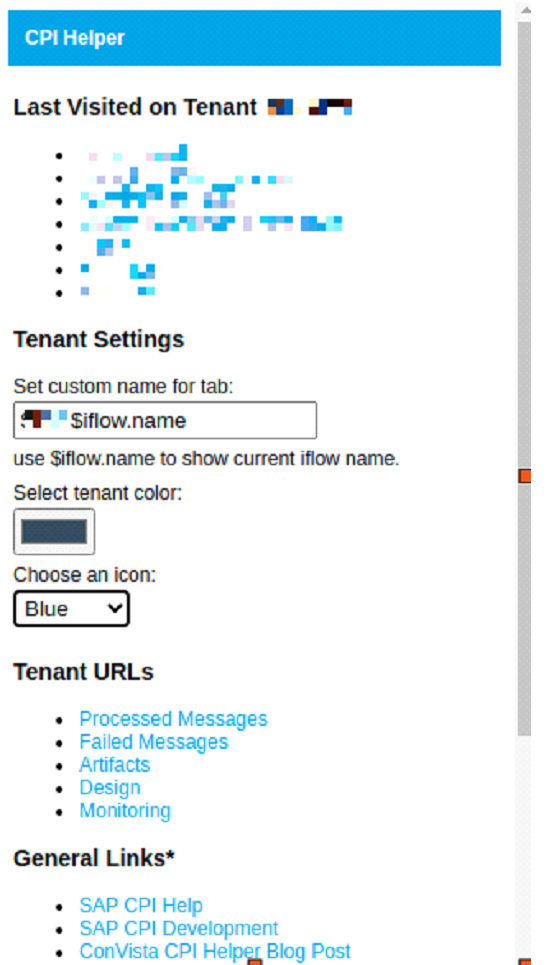
Last Visited on Tenant: Last visited on tenant gives the list of last 10 artifacts viewed/accessed in the current tenant.
All these artifacts will be shown as hyperlinks which will redirect us to the corresponding artifact integration flow designer page.
Tenant Settings: Tenant settings gives options to customize CPI tenant page tab according to our need

Custom Name for Tab: By default, Cloud Integration will be the Tab name. But if you want to change it according to your need you can achieve this by using the below format.
for example, we can have name of client followed by name of the artifact/environment as CPI page tab name
ABCGroup $iflow.name
Tenant Color: By default, the color of the ribbon on the top of the CPI tenant page will be as shown below.

But to differentiate this ribbon according to your need, you can customize this color by choosing the appropriate color according to your requirement from “Select Tenant Color” option and this is how it looks when we changing the color:

CPI Tenant Page Icon: By default, we will be having SAP Icon as part of the tab name.

If we want to change it to CPI-Helper Icon, we can do this by selecting the drop down option under “Choose An Icon” option.
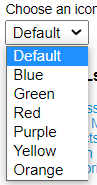
This is how the Custom Icon looks like:

It is a good practice to color prod tenants in red 🙂
Tenant URLs:
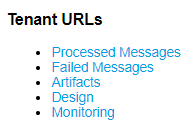
This option gives us hyperlinks to access
- Processed Messages: will be redirected to Message Monitor Processing Page that shows messages with all status in past 1 hour.
- Failed Messages: will be redirected to Message Monitor Processing Page that shows messages in Failed status in past 1 hour.
- Artifacts: will be redirected to Manage Integration Content page.
- Design: will be redirected to Design page of the PCI tenant which shows all the package details.
- Monitoring: will be redirected to the Operations view page of CPI tenant.
General Links: This will provide you links to access to SAP Cloud Integration page, CPI-Helper latest blog and Online IDE to execute Groovy Scripts.

You can access the below links to go through the source code and contribute at our GitHub page links shared below.
It saves a lot of time for me and I hope you like it too. I recommend you install the Chrome Extension directly from Chrome Store to get the newest updates.
You can easily get the CPI-Helper from the Chrome Store. It is free and open source. You can also install from sources if you want. More details on the GitHub Page
If you want to know more about the CPI-Helper, visit my older posts
For more details, see my GitHub page and my first blog post about the CPI-Helper. The CPI-Helper is Open Source. If you want to contribute you are more than welcome.
License and Data Protection
The CPI-Helper is under GNU GPL 3 license. I do not collect any data. If you do not trust me you can always have a look in the source code and build your own chrome extension with it.
If you have any questions or if you traced down some bugs (I know there are some but I do not have the time to fix non letal bugs), leave me a comment here or add me on LinkedIn
Happy Integration to all
Dominic Beckbauer
- SAP Managed Tags:
- Cloud Integration
Labels:
15 Comments
You must be a registered user to add a comment. If you've already registered, sign in. Otherwise, register and sign in.
Labels in this area
-
ABAP CDS Views - CDC (Change Data Capture)
2 -
AI
1 -
Analyze Workload Data
1 -
BTP
1 -
Business and IT Integration
2 -
Business application stu
1 -
Business Technology Platform
1 -
Business Trends
1,658 -
Business Trends
93 -
CAP
1 -
cf
1 -
Cloud Foundry
1 -
Confluent
1 -
Customer COE Basics and Fundamentals
1 -
Customer COE Latest and Greatest
3 -
Customer Data Browser app
1 -
Data Analysis Tool
1 -
data migration
1 -
data transfer
1 -
Datasphere
2 -
Event Information
1,400 -
Event Information
67 -
Expert
1 -
Expert Insights
177 -
Expert Insights
301 -
General
1 -
Google cloud
1 -
Google Next'24
1 -
GraphQL
1 -
Kafka
1 -
Life at SAP
780 -
Life at SAP
13 -
Migrate your Data App
1 -
MTA
1 -
Network Performance Analysis
1 -
NodeJS
1 -
PDF
1 -
POC
1 -
Product Updates
4,577 -
Product Updates
346 -
Replication Flow
1 -
REST API
1 -
RisewithSAP
1 -
SAP BTP
1 -
SAP BTP Cloud Foundry
1 -
SAP Cloud ALM
1 -
SAP Cloud Application Programming Model
1 -
SAP Datasphere
2 -
SAP S4HANA Cloud
1 -
SAP S4HANA Migration Cockpit
1 -
Technology Updates
6,873 -
Technology Updates
430 -
Workload Fluctuations
1
Related Content
- What’s New in SAP Analytics Cloud Modeling Extensions & Integration QRC Q1 2024 Release in Technology Blogs by SAP
- SAP Cloud ALM API & Integration: Several extensions of SAP Cloud ALM with SAP BTP (Part 5): Enrich SAP Cloud ALM content with AI content (SAP Integration Suite, SAP AI Core Services) in Technology Blogs by SAP
- SAP Cloud ALM API & Integration: Several extensions of SAP Cloud ALM with SAP BTP (Part 4): Approve Requirements with Workflow Engine (SAP Build Process Automation) in Technology Blogs by SAP
- SAP Cloud ALM API & Integration: Several extensions of SAP Cloud ALM with SAP BTP (Part 3): Use a mobile application (SAP Build Apps, SAP Cloud ALM) to trigger a requirement approval. in Technology Blogs by SAP
- Partner Enablement for SAP Cloud ALM in Technology Blogs by SAP
Top kudoed authors
| User | Count |
|---|---|
| 27 | |
| 18 | |
| 15 | |
| 13 | |
| 11 | |
| 9 | |
| 8 | |
| 8 | |
| 8 | |
| 7 |