
- SAP Community
- Products and Technology
- Technology
- Technology Blogs by SAP
- Leveraging Influencers to Improve Your Predictive ...
Technology Blogs by SAP
Learn how to extend and personalize SAP applications. Follow the SAP technology blog for insights into SAP BTP, ABAP, SAP Analytics Cloud, SAP HANA, and more.
Turn on suggestions
Auto-suggest helps you quickly narrow down your search results by suggesting possible matches as you type.
Showing results for
Product and Topic Expert
Options
- Subscribe to RSS Feed
- Mark as New
- Mark as Read
- Bookmark
- Subscribe
- Printer Friendly Page
- Report Inappropriate Content
06-30-2021
1:45 PM

Introduction
Time-series forecasting is primarily about finding temporal patterns in the evolution of a KPI to be predicted. Using these patterns, a predictive model can generate predicted values for the future. Does the value follow a trend? Does the predicted value tend to have lower value on some specific month (periodicity analysis)?
For some use cases, accurate predictions can be achieved by relying only on the past values of the KPI to be predicted (please refer to this blog post for a good example of such use case).
But sometimes, the value to be predicted doesn’t only depend on time but also is correlated to other external factors. Probably, the sales for my company’s products are correlated to some extent to the money my company spends in marketing and advertisement. Or the number of bikes hired in my city is correlated to the outside temperature.
In wave 2021.13 (2021 quarterly release 3), Predictive Planning introduces the influencers to the time-series forecasting models, allowing to take such factors into account. In this blog post I will show you how to use the influencers to get more insights from your data and possibly increase the accuracy of your predictive forecasts.
Scenario
I am working for a company that is renting bikes in London. I have a planning model that contains a BikeHires measure that represents the count of hires each day as well as several measures related to the weather. Using Predictive Planning I would like to forecast the amount of bikes that will be hired for the coming 31 days.
In this scenario we will assume that the current day is July 31, 2015: this will allow us to compare the predictive forecasts to the values that really occurred in August 2015.
You can download this dataset if you want to recreate this example. Note that the columns BikeHires, Temp. Min, Temp. Max, Temp. Mean, Humid. Min, Humid. Max, Humid. Mean and Rain are expected to be measures. Other columns should be considered as dimensions.
You can refer to this blog post if you need help to create a planning model from a CSV file.
Baseline Forecasts
Let’s create a “baseline” predictive model that predicts the number of hires using no influencers. We will request 31 forecast points after July 31, 2015 and learn from one entire year of historical data.
To learn more about using Predictive Scenarios, please refer to this blog post.

Request 31 forecast points (1 for each day in August)

Configure a 1-year window of observation ending on July 31, 2015

Do not include any influencer for now
Once the predictive model is trained, we can note the following points in the Forecast modeling report:
- The expected error rate for the trained predictive model is 17.14%.
- When comparing the forecasts to the actuals we can see that some variations are not modelled and some predicted values lie far from the actual value.
- There are 8 outliers (points where the predicted value is very “far” from the actual value).

Please note that you may get slightly different results depending on the evolutions of the predictive engine.
Looking at the Explanation report we can see that the predictive model has found both a trend and some periodical patterns in the time-series.

This shows that the amount of bike hires is for some part, explained by the time. But we could expect that weather-related factors such as the outside temperature or the quantity of rain to have an impact of the bike hires. Predictive Planning can detect such correlations thanks to the Influencers.
Using Influencers to Improve the Predictions
We want to keep the baseline model for reference and use the same settings for the improved predictive model, so let’s use the Duplicate feature.

The Duplicate feature allows creating a new model using the settings of an existing model
Open the newly created predictive model and scroll down to the Influencers section of the settings.
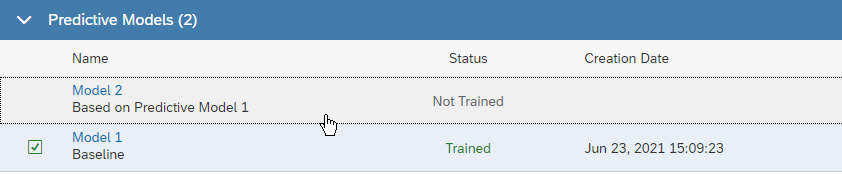
Click to open the Model 2
Let’s validate our assumption about the outside temperature and the rain quantity having an influence on the bike hires by adding the following influencers and training the predictive model:
| Humid. Max | The maximum air humidity in % reached during the day |
| Humid. Mean | The mean air humidity in % during the day |
| Humid. Min | The minimum air humidity in % reached during the day |
| Rain | The amount of rain during the day |
| Temp. Max | The maximum temperature in °c during the day |
| Temp. Mean | The maximum temperature in °c during the day |
| Temp. Min | The maximum temperature in °c during the day |

You can add up to 20 influencers to a time-series forecasting model. The influencers are numeric values of my planning models (accounts, measures…) that I think may help predicting the target
After the model is trained, in the forecast modeling report, we can note the following points.
- The expected error rate for the trained predictive model has decreased to 6.84% (17.14% for the model without influencers)
- When comparing the forecasts to the actuals we can see that the forecast series is closer to the actuals.
- There are fewer outliers (6 outliers compared to 8 in the baseline model).

So, the BikeHires time-series is better modelled on the training data partition but to get a sense of the “true” accuracy of the model, we need to look at the accuracy on the horizon period. Zooming in the Forecast Vs Actual visualization we can see that the Forecast series follows the Actual time-series more closely when the influencers are used:

The predictions without influencers

The predictions with influencers
We can see the relative contribution of the influencers in the Explanation report.

The time components (the trend, the cycles…), represented by the planning date (the Day dimension, here displayed as Day.Date because of a small glitch), contribute for 51.42% of the prediction. Then comes the maximum temperature that contributes for 29.89%, then the quantity of rain with 10.32%... So, as expected the quantity of rain, the maximum temperature and the mean humidity have a strong impact on the number of bikes hired (contributing together for 49% of the predicted value).
Using a Story to visualize BikeHire against the influencers, we can get more insights about the relation that exists between the influencers and the target. We can see that overall, the number of bike hires tends to increase when the outside temperature increases, while it tends to decrease when the humidity and the quantity of rain increase.

One thing to note is that some of the influencers we have selected in the settings (Humid. Min, Humid. Max…) don’t appear in the list. The Predictive Model keeps only the "useful" influencers. It evaluates how much additional performance each influencer would bring to the model and keeps only those that bring enough additional accuracy. So, it’s important to understand that it’s not possible to force an influencer to be used by the predictive model if that influencer doesn’t significantly increases the prediction accuracy.
But why are Temp. Min and Temp. Mean no used by he model? Plotting Temp. Max against Temp. Mean and Temp. Min shows that Temp. Max is highly correlated to Temp. Mean and Temp. Min: these three measures convey almost the same information and using Temp. Min or Temp. Mean would bring no or little information over Temp. Max alone.

Additional Considerations About the Influencers
The Influencers Must be Predictable
The predictive model finds patterns that exists in the data (correlations) between the influencers and the target to be predicted and then applies these patterns in the future to generate the predictions. For the patterns to be properly applied in the future, it requires the future values of the influencers to be provided for the prediction horizon.
If a time-series forecasting model is created with some influencers but the values of the influencers are not provided for the prediction horizon, predictive planning will not generate the forecast and issue an error.
If Temp. Max and Rain have been selected as influencers, the following data won’t allow to get forecasts for August 2015 as the influencers have no value for the horizon period.

The data below will allow generating forecast for August 2015 as values for the influencers are available for the horizon period.

You also need to distinguish between influencers that are under you direct control and those that are not.
Using measures such as “advertisement budget”, “expenses budget” or “sales budget” is straightforward because you (or at least someone in your company) decide of their values and you can provide accurate values for the forecast horizon.
Using influencers such as gas or currency exchange rate, on the other hand, requires to be a little bit more careful. Such factors may have an impact on the KPI you want to predict but they are not under your control: there is no way for you to know their exact future values. If you want to leverage such influencers you should generate several sets of predictions based on different hypothesis for the influencers. For instance, you would generate forecasts for a “likely” hypothesis (using the expected future values for the influencers), an optimistic hypothesis and a pessimistic hypothesis
We will explain that in more details in a future blog post.
How to Identify Potential Influencers?
We tend to think about the outliers (or more generally any value not predicted as well as expected) as unpredictable events. When analyzing the report of a predictive model, spend some time looking at these “not so well predicted” points. Can you find a business reason for the actual not being as expected? You will find one more often than you think. In such cases you may have identified a measure that could be added to your planning model to be used to improve the accuracy of your predictions.
Be Parsimonious when Including Influencers
It may seem like adding to my model all the possible influencers is a clever idea to improve the predictions performance. But it’s not.
We recommend selecting the influencers carefully and not using too many of them simultaneously.
Using "too many" influencers may have negative modelling impacts: when using too many influencers, the predictive model may explain very well the past but may not be able to deliver the same performance on the future data.
Using influencers has also an impact on the total cost of ownership of your planning model. The influencers must be maintained over time: you’ll need to collect data and make it available into your planning model. This is worth the effort only if there is a real gain in term of accuracy or business insights.
There is no rule of thumb to determine the right number of influencers, but you should not try to get a perfect model. Keep in your predictive model the influencers that have a high impact on the accuracy and discard those that have a marginal impact. A good practice is to introduce the influencers one by one in the predictive model to check the impact on the HW-MAPE. It’s up to you to judge what is a marginal and a significant impact depending on you use case.
Conclusion
In this blog post, you learned how to leverage the Influencers to improve the accuracy of your predictive forecasts.
I hope this blog post was helpful to you. If you appreciated reading this, I’d be grateful if you left a comment to that effect, and don’t forget to like it as well. Thank you.
Do you want to learn more on Predictive Planning?
- You can read our other blog posts.
- You can also explore our learning track.
- You can also go hands-on and experience SAP Analytics Cloud by yourself.
Labels:
6 Comments
You must be a registered user to add a comment. If you've already registered, sign in. Otherwise, register and sign in.
Labels in this area
-
ABAP CDS Views - CDC (Change Data Capture)
2 -
AI
1 -
Analyze Workload Data
1 -
BTP
1 -
Business and IT Integration
2 -
Business application stu
1 -
Business Technology Platform
1 -
Business Trends
1,658 -
Business Trends
109 -
CAP
1 -
cf
1 -
Cloud Foundry
1 -
Confluent
1 -
Customer COE Basics and Fundamentals
1 -
Customer COE Latest and Greatest
3 -
Customer Data Browser app
1 -
Data Analysis Tool
1 -
data migration
1 -
data transfer
1 -
Datasphere
2 -
Event Information
1,400 -
Event Information
74 -
Expert
1 -
Expert Insights
177 -
Expert Insights
347 -
General
1 -
Google cloud
1 -
Google Next'24
1 -
GraphQL
1 -
Kafka
1 -
Life at SAP
780 -
Life at SAP
14 -
Migrate your Data App
1 -
MTA
1 -
Network Performance Analysis
1 -
NodeJS
1 -
PDF
1 -
POC
1 -
Product Updates
4,575 -
Product Updates
390 -
Replication Flow
1 -
REST API
1 -
RisewithSAP
1 -
SAP BTP
1 -
SAP BTP Cloud Foundry
1 -
SAP Cloud ALM
1 -
SAP Cloud Application Programming Model
1 -
SAP Datasphere
2 -
SAP S4HANA Cloud
1 -
SAP S4HANA Migration Cockpit
1 -
Technology Updates
6,871 -
Technology Updates
479 -
Workload Fluctuations
1
Related Content
- Understanding Data Modeling Tools in SAP in Technology Blogs by SAP
- New Machine Learning features in SAP HANA Cloud in Technology Blogs by SAP
- Predict, Personalize, Prosper: BTP AI Capabilities Redefining Retail Intelligence - Part 3/3 in Technology Blogs by SAP
- Pioneering Datasphere: A Consultant’s Voyage Through SAP’s Data Evolution in Technology Blogs by Members
- Unleashing the Power of Artificial Intelligence in SAP's Customer Support in Technology Blogs by SAP
Top kudoed authors
| User | Count |
|---|---|
| 17 | |
| 15 | |
| 11 | |
| 10 | |
| 8 | |
| 8 | |
| 8 | |
| 8 | |
| 7 | |
| 7 |