
- SAP Community
- Products and Technology
- Technology
- Technology Blogs by SAP
- Provisioning and Scaling of the SAP Kyma Runtime
Technology Blogs by SAP
Learn how to extend and personalize SAP applications. Follow the SAP technology blog for insights into SAP BTP, ABAP, SAP Analytics Cloud, SAP HANA, and more.
Turn on suggestions
Auto-suggest helps you quickly narrow down your search results by suggesting possible matches as you type.
Showing results for
Advisor
Options
- Subscribe to RSS Feed
- Mark as New
- Mark as Read
- Bookmark
- Subscribe
- Printer Friendly Page
- Report Inappropriate Content
07-15-2022
4:03 PM
The SAP Kyma runtime provides a fully managed Kubernetes runtime based on the open-source project Kyma. The runtime offers a number of cluster configuration options. This blog will explain the different options available when provisioning a SAP Kyma runtime. Additionally, it will explore how the runtime scales as workloads are added to the cluster. Using this information, in conjunction with the estimator, should provide insight into overall costs and an overview of the process to tune your workloads.
What do the AutoScaler Values mean?
What is a MachineType and which one should I choose?
Reviewing a newly provisioned cluster
There’s a few options to view the metrics of the cluster. Most of this information can be found within the Kyma dashboard within the Cluster Details menu option. Grafana also includes many dashboards to view this information in various formats. The CLI tool kubectl also can be used to display the metrics, we can use the following commands to do so
Lets make the cluster scale
To make sense of this, lets create some workloads that request a large amount of CPU to see how this works. In most cases workloads should be defined with a deployment, statefulset, etc, but for simplicity pods can be created directly. Based on the Allocate resources the system currently has about 4843m, 4.8 cores, of CPU allocated. So if a pod is created that requests 2000m, two full cores of CPU, the system will schedule the pod according to the nodes currently available resources.
To view the limits of the containers of the pod run
Which returns
The pod will exist in the Pending state until the node is made available
Checking the events you should observe that a node is not available for the CPU request which triggers an additional node to be added.
PROVISIONING
The provisioning of a paid Kyma runtime presents a number of different options related to the machine size and scaling options including:
"autoScalerMax": 10,
“autoScalerMin": 2,
"machineType": "Standard_D8_v3",
What do the AutoScaler Values mean?
The value autoScalerMin denotes the minimum amount of virtual machines or nodes that will be available in the cluster. This value can not be set lower than two, which ensures that enough capacity is available for all Kyma/K8s components and additional workloads can be added to the cluster before any additional machines are added by the autoscaler. Two nodes also ensures a level of high availability in the case a machine failure occurs. Depending on the workloads to be added to the cluster and the scaling expectations, in productive scenarios it may be preferred to have this set at a higher number based on the use case(s) that would be running on the cluster.
The autoScalerMax denotes the maximum amount of virtual machines or nodes that will be available in the cluster. Defaulting to 10, this value can be adjusted with a maximum value of 40. The basis of this value should be dependent on the cluster’s use, i.e. production or development etc, to restrict max utilization/cost. The process of adding additional nodes is automated and is dependent on the workloads running in the cluster. We will look further into this later in the blog.
What is a MachineType and which one should I choose?
The MachineType refers to virtual machine size. in Kubernetes/Kyma each one of the machines is referred to as a node. There are a number of options for the machine type with the minimum consisting of 8 CPU and 32GB Ram, depending on the provider this translate to the machine type options.
- AWS: m5.2xlarge
- GCP: n2-standard-8
- Azure: Standard_D8_v3
There are also a number of other machine type options available with the max being 48 CPU and 192GB Ram. In most cases the minimum is preferred. As additional machines are added to the cluster, a smaller machine increases capacity at a lesser rate, resulting in a more efficient resource/cost utilization. In the case of a machine failure, applications spread across a number of four smaller machines would also cope better vs if only two larger machines were used. In the case you have an application that requires a high amount of memory or CPU, such as Big Data/AI scenarios, the performance a larger machines offers may be preferred.
Reviewing a newly provisioned cluster
This is best understood by provisioning a cluster and reviewing the tools available to understand the process. With that being said, let's review a newly provisioned Kyma runtime cluster using the default settings for Microsoft Azure
"autoScalerMax": 10,
“autoScalerMin": 2,
"machineType": "Standard_D8_v3",
There’s a few options to view the metrics of the cluster. Most of this information can be found within the Kyma dashboard within the Cluster Details menu option. Grafana also includes many dashboards to view this information in various formats. The CLI tool kubectl also can be used to display the metrics, we can use the following commands to do so
kubectl get nodes
This returns the nodes of the system, which currently is equivalent to the autoScalerMin value of two. To see the current resource usage we can then run
kubectl top nodes
This shows that the system is currently only using 6% of CPU and 15% memory of its capacity. To get details of each node we can then run describe to return the details of each node
kubectl describe node shoot--kyma--c-7dea047-cpu-worker-0-z1-6dbb4-hxssgThis returns a number of different pieces of information, such as the node capacity which displays the CPU and memory details. Once again this is based on the machineType, Standard_D8_v3 which provides the Capacity of 8 CPU and 32GB Ram, requested when the cluster was provisioned minus what the system itself has reserved, the Allocatable amount.
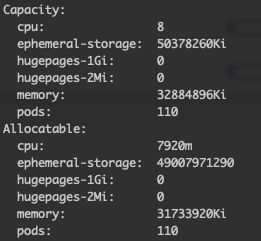
This also lists all of the pods on the node and their set CPU/memory Requests/Limits as well as the overall node Allocated resources.
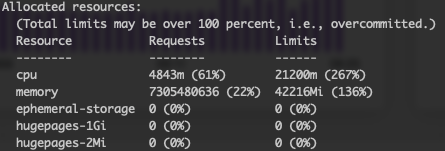
The Allocated resources details the total amount of CPU/memory that is currently reserved of the node. Each workload added to the cluster has the option to reserve resources by setting resource request for memory and CPU which guarantees this amount for the workload. As workloads are then added, they can only use/request the CPU/memory that is free. In this case 39% of CPU is available.
To summarize, the system is currently only using ~6% of CPU and ~15% memory, but has ~61% of CPU and ~22% memory reserved. The runtime will run in this capacity until workloads are applied, or existing workloads attempt to scale out. As this happens there may be a point where the workload can not be scheduled on a node, which will cause the autoscaler to create another node.
Node Scaling overview
If workloads fail to be scheduled due to insufficient resources, the autoscaler will automatically kick in and provision an additional node. This will hold true as more additional workloads are added, additional nodes will be added to meet capacity until it maxes out based on the autoScalerMax. If the workloads are then removed, the additional machines will be de-provisioned, back down to the minimum, if necessary.
As workloads are added to the cluster, the available capacity will be consumed. This is based on either the amount of resources the workload is using or what it has reserved. The reservation of resources is accomplished by setting memory/CPU requests on the workload which guarantees this amount. This is part of the spec when defining a deployment for example. Each workload can also be set to have a limit on the amount of CPU/memory that it can utilize, resulting in an out of memory error if exceeded. If these are not defined then the actual usage of the workload will have no reservation or constraints placed on it unless the namespace it exists in has a default limit. In this case the namespace default limit would be applied to the workload.
The requests and limits are on a per container basis, there can be a number of containers within a single pod. By default any workload added to Kyma will have two containers in it, your workload and the istio-proxy which provides the service mesh functionality.
Lets make the cluster scale
To make sense of this, lets create some workloads that request a large amount of CPU to see how this works. In most cases workloads should be defined with a deployment, statefulset, etc, but for simplicity pods can be created directly. Based on the Allocate resources the system currently has about 4843m, 4.8 cores, of CPU allocated. So if a pod is created that requests 2000m, two full cores of CPU, the system will schedule the pod according to the nodes currently available resources.
kubectl run nginx1 --image=nginx --requests='cpu=2000m'To view the limits of the containers of the pod run
kubectl get pod nginx1 -o=jsonpath='{range .spec.containers[*]}{.name}{"\t"}{.resources}{"\n"}{end}'Which returns
istio-proxy
{"limits":{"cpu":"1","memory":"1Gi"},"requests"{"cpu":"100m","memory":"192Mi"}}
nginx1
{"requests":{"cpu":"2"}}
At this point the node will have about 7843m, 7.8 cores, of CPU allocated, 2 cores from our nginx container and 1 from the istio-proxy container
If we now add another pod that requests 2000m of CPU
kubectl run nginx2 --image=nginx --requests='cpu=2000m'The pod will be scheduled on the other node which results in both nodes being close to 90% committed for CPU requests. This can be seen by running describe on each node to view the Allocated resources.
Adding one more pod with the same CPU request will cause the cluster to scale an additional node because the amount of requested resources is not available, which causes the scheduling of the pod to fail until the new node is added.
kubectl run nginx3 --image=nginx --requests='cpu=2000m'The pod will exist in the Pending state until the node is made available
kubectl get pods
Checking the events you should observe that a node is not available for the CPU request which triggers an additional node to be added.
kubectl get events
Now after a few minutes we see that another node has been added to the cluster
kubectl get nodes
And if it is then deleted
kubectl delete pod nginx3In about an hour the node will be marked for deletion and removed from the cluster which is shown in the events

Tuning workloads
Just as we did with the nodes running we can see the resource usage using
kubectl top pod
This of course only provides the current resource usage. A historical view can be found in the Kyma dashboard within the namespace pod view as well as within Grafana. This information can be used to define appropriate settings for the memory/CPU requests of the workload when a normal amount of load is applied. Of course there are some other aspects to consider such as the number of replicas defined to run as well as a Horizontal Pod Autoscaler which allows the workload to scale up and down. For the sake of brevity, we will leave that for another discussion.
After reading this blog I hope that you better understand the Kyma provisioning process and how scaling is determined. For more information on this topic please reference the official SAP help documentation and stay tuned for more blogs.
- SAP Managed Tags:
- SAP BTP, Kyma runtime,
- SAP Business Technology Platform
Labels:
You must be a registered user to add a comment. If you've already registered, sign in. Otherwise, register and sign in.
Labels in this area
-
ABAP CDS Views - CDC (Change Data Capture)
2 -
AI
1 -
Analyze Workload Data
1 -
BTP
1 -
Business and IT Integration
2 -
Business application stu
1 -
Business Technology Platform
1 -
Business Trends
1,658 -
Business Trends
112 -
CAP
1 -
cf
1 -
Cloud Foundry
1 -
Confluent
1 -
Customer COE Basics and Fundamentals
1 -
Customer COE Latest and Greatest
3 -
Customer Data Browser app
1 -
Data Analysis Tool
1 -
data migration
1 -
data transfer
1 -
Datasphere
2 -
Event Information
1,400 -
Event Information
76 -
Expert
1 -
Expert Insights
177 -
Expert Insights
348 -
General
1 -
Google cloud
1 -
Google Next'24
1 -
GraphQL
1 -
Kafka
1 -
Life at SAP
780 -
Life at SAP
14 -
Migrate your Data App
1 -
MTA
1 -
Network Performance Analysis
1 -
NodeJS
1 -
PDF
1 -
POC
1 -
Product Updates
4,575 -
Product Updates
392 -
Replication Flow
1 -
REST API
1 -
RisewithSAP
1 -
SAP BTP
1 -
SAP BTP Cloud Foundry
1 -
SAP Cloud ALM
1 -
SAP Cloud Application Programming Model
1 -
SAP Datasphere
2 -
SAP S4HANA Cloud
1 -
SAP S4HANA Migration Cockpit
1 -
Technology Updates
6,871 -
Technology Updates
486 -
Workload Fluctuations
1
Related Content
- How to Connect a Fieldglass System to SAP Start in Technology Blogs by SAP
- SAP BTP FAQs - Part 2 (Application Development, Programming Models and Multitenancy) in Technology Blogs by SAP
- SAP BTP FAQs - Part 1 (General Topics in SAP BTP) in Technology Blogs by SAP
- On the lookout with SAP BTP Core services. Cis patrol. in Technology Blogs by SAP
- The 2024 Developer Insights Survey: The Report in Technology Blogs by SAP
Top kudoed authors
| User | Count |
|---|---|
| 14 | |
| 11 | |
| 10 | |
| 10 | |
| 10 | |
| 9 | |
| 8 | |
| 7 | |
| 7 | |
| 6 |