
- SAP Community
- Products and Technology
- Technology
- Technology Blogs by SAP
- SAP BI 4.3 SP3: What’s New In Web Intelligence and...
Technology Blogs by SAP
Learn how to extend and personalize SAP applications. Follow the SAP technology blog for insights into SAP BTP, ABAP, SAP Analytics Cloud, SAP HANA, and more.
Turn on suggestions
Auto-suggest helps you quickly narrow down your search results by suggesting possible matches as you type.
Showing results for
Advisor
Options
- Subscribe to RSS Feed
- Mark as New
- Mark as Read
- Bookmark
- Subscribe
- Printer Friendly Page
- Report Inappropriate Content
12-07-2022
3:07 PM

As announced in the SAP Analytics Business Intelligence Statement of Direction, a new major version of the SAP BusinessObjects BI suite is already planned.
In the meanwhile, after the Support Package 2 released last year, the Support Package 3 of SAP BI 4.3 comes with great innovations (like the Data mode), incremental features (like prompts or hyperlinks) and usability enhancements requested by customers.
This article is a complement of the official SAP documentation. It is part of the
What’s New in Web Intelligence and Semantic Layer series and summarizes the following changes:
- Web Intelligence: Data Mode - View Data
- Web Intelligence: Data Mode - Prepare Data
- Web Intelligence: Data Mode - Combine Data
- Web Intelligence: Microsoft OneDrive Repository
- Web Intelligence: Reporting
- Web Intelligence: Charts
- Web Intelligence: Prompts and Variants
- Web Intelligence: Hyperlinks
- Web Intelligence: Formula Language
- Web Intelligence: Change Source
- Web Intelligence: Mobile Interface
- Web Intelligence: Usability Enhancements
- Web Intelligence: Rich Client
- Web Intelligence: Expose OData
- Semantic Layer: Data Sources
- Semantic Layer: Information Design Tool
Web Intelligence: Data Mode - View Data⤒
Like SAP Web Intelligence Rich Client in SAP BI 4.2, the Data mode allows you to view the current document’s dataset (Request 121535). To switch to Data mode, select Data in the drop-down menu in the toolbar.
This mode contains two new components:
- The Dataset View where the dataset can be seen as a table or through facets.
- The Graph Panel that displays a graph of the document’s data sources, queries and cubes.
Like other modes, the Data mode has also the Main and Build side panels that contain contextual commands.
Dataset View
If it is not yet open, click the Main button in the toolbar to open the Main side panel. Its tab Objects (
 ) displays the list of cubes of the documents. You can expand these cubes to see their objects.
Dataset View
When you select a cube in the Main > Objects tab or in the Graph Panel, a tab opens in the Dataset View to display the selected cube’s dataset. Clicking another cube opens a new tab if it is not yet open or put it in focus. Click the Close icon (
 ) on the tab to close this tab.
You may maximize the Dataset View display and hide the Graph Panel by clicking the Maximize button (
 ).
). In a tab, the dataset is displayed as a table or through facets, depending on the Facets view toggle button (
 ).
).Table Display
In Data mode, the cube dataset is displayed as a flat table by default. This table can show a huge number of rows very quickly since it does not have to take any reporting and formatting capabilities into consideration.
The first column of the table contains the row’s number in the table.
Click the Distinct values toggle button (
 ) to show or hide duplicate rows.
 In the Build > Data > Feeding tab, you may define what column(s) to display and in which order:
- Click the Delete icon () on an object to remove it from the table.
- Drag and drop the objects to change their order in the table.
- Click the Reset button (
 ) to restore the initial display.

Dataset View Feeding
Facets Display
To display the dataset using facets in the Dataset View panel, select the Facets view toggle button. To return to table display, unselect this button.
This view shows one facet per dimension of the selected cube. A facet is made of two columns:
- The first column contains the list of values of the dimension. Its header contains the dimension name and the number of its distinct values.
- In the second column, the facet displays by default the number of occurrences in the dataset for each value (Count).

Facets Display
Click the More menu (
 ) in the facet’s first column to sort the values in ascending or descending order or apply a transformation on these values.
Click the More menu (
) in the facet’s second column to open a contextual menu, where you can select:- A sort to the displayed measure (Count by default) in ascending or descending order.
- Another measure of the cube to display its aggregation for each value, instead of Count.

Facets Measure Selection
As for Table Display, in the Build > Data > Feeding tab, you may define what facet(s) to display and in which order.
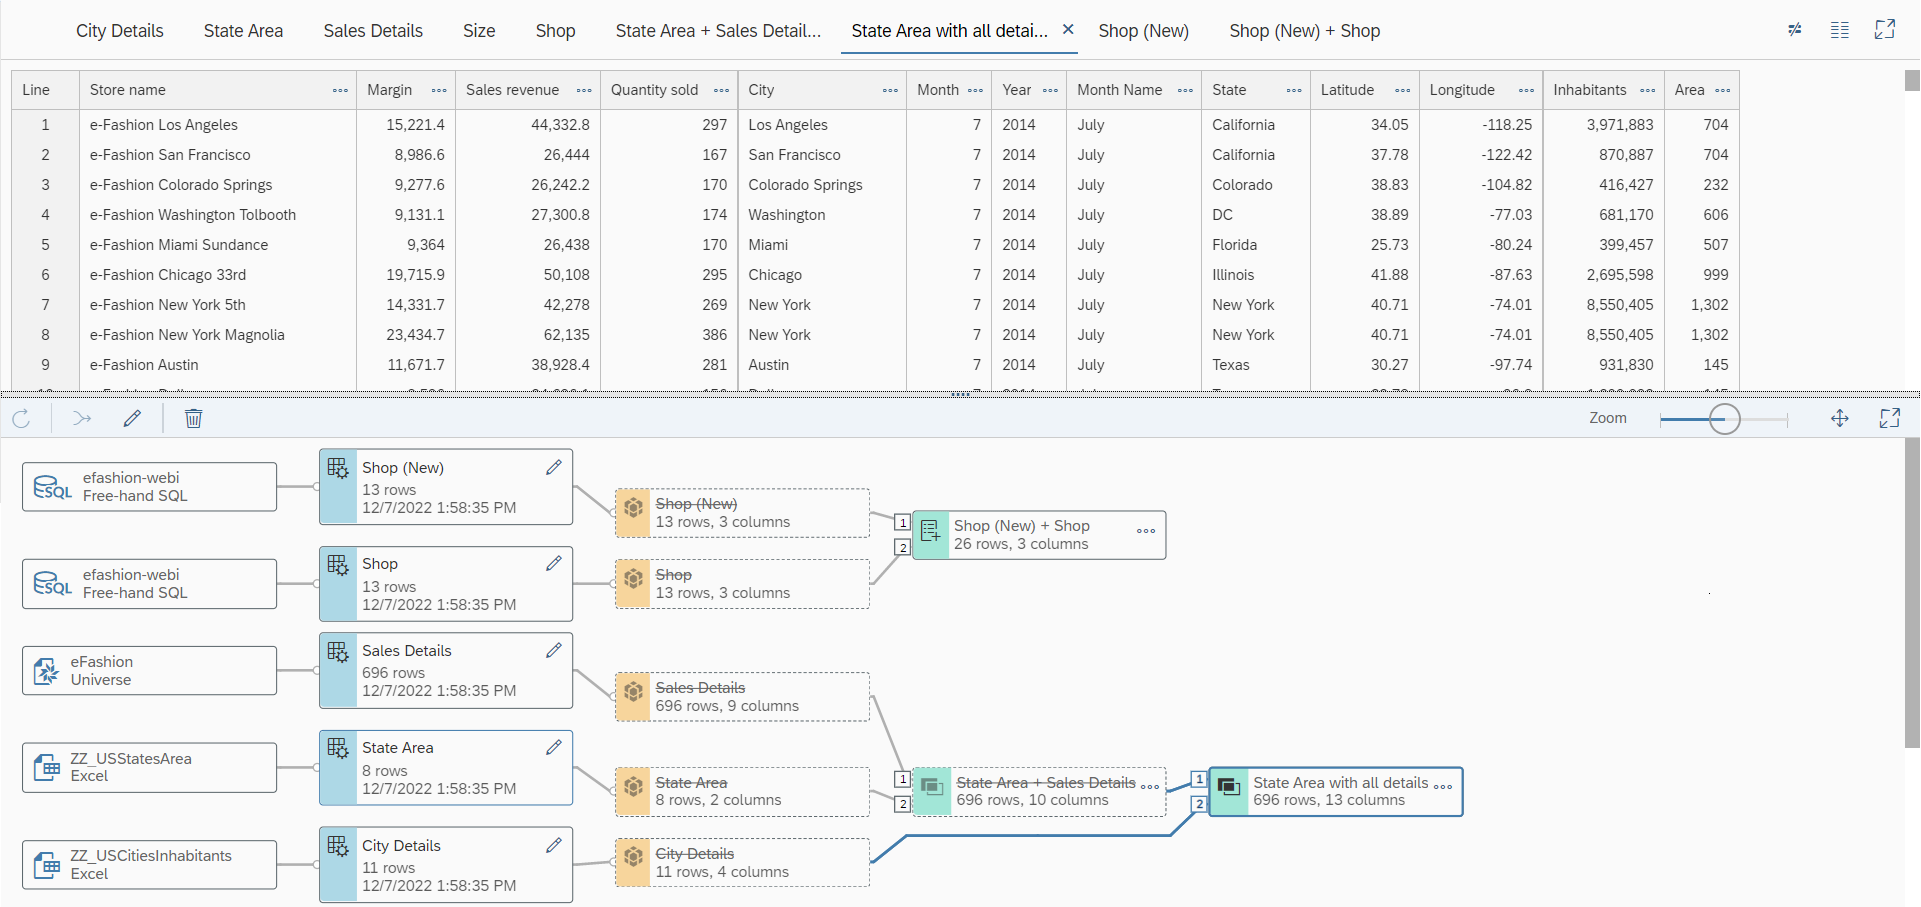
Graph Panel
The Graph Panel is a visual component that displays the document’s data sources, queries and cubes and their relationships. The nodes representing the queries or the cubes contain some statistics about them, like the refresh date or the number of rows (Request 271102).
If a query is multi-flow, then it shows the different flows of this query. This graph can become very useful if your document has many data sources and if you have combined them.

Data Mode Graph
The Graph Panel contains its own toolbar with the following actions:
- Refresh: To refresh the selected query.
- Combine: To combine two selected cubes (disabled by default).
- Edit: To edit the selected query in the Query Panel or the selected combined cube (disabled by default).
- Delete: To delete the selected combined cube (disabled by default).
- Zoom: To zoom in and out the Graph Panel.
- Fit: To dynamically zoom in and out the graph so that the content fits the Graph Panel’s height.
- Maximize: To hide the Dataset View and maximize the Graph Panel. Click this icon a second time to restore the Graph Panel size.
Web Intelligence: Data Mode - Prepare Data⤒
The second objective of the Data mode is to propose some data preparation capabilities and simple object values modifications without creating additional variables.
Adding a Transformation
In the Dataset View, you can apply some transformations by clicking the More button (
) on a table or facet header (Request 211692). This opens a contextual menu. If the object’s data type is String, you can select one of these transformations:
- Upper case or Lower case to turn all values in upper or lower case.
- Trim to remove a character (by default space) from the beginning of the string, its end or both.
- Replace to replace a specific string in a string by another one.
- Fill to add some characters (by default space) at the beginning or the end of the string so that it can reach at least a specified length.
- Group to replace some values by another value.

Transformations Menu
You can also right-click a value in a cell to open a menu containing only Replace. Selecting this transformation opens the Replace dialog box filled by default with the selected value.
These transformations apply directly to the object’s values; the changes of which are immediately reflected in the Dataset View.
Managing Transformations
When transformations have been defined on an object, an icon (
 ) is displayed beside this object in the Main > Objects tab. Select this object in the Main > Objects tab to list these transformations in the Build > Properties > Transformations tab. This tab offers more actions and you can:
 - Click the Add button and select a transformation to apply to the object’s values.
- Click the Edit button (
 ) beside a Replace, Fill, Trim or Group transformation to change its parameters.
 - Click the Delete button () to remove a transformation.
- Select a transformation and use the Move Up (
 ) or Move Down (
 ) button to change the order in which it is applied. You can also drag and drop a transformation to change this order.
![]()
Transformations Tab
In the General section, this tab also displays the Qualification and the Data Type of the object defined for this cube.
Web Intelligence: Data Mode - Combine Data⤒
Through merged objects, you can already synchronize data coming from different data sources. But this must be done for each object involved in this synchronization and there are some constraints. The Data mode proposes an easier way to synchronize datasets thanks to the Combine Cubes feature.
Warning: For the moment, this feature is not visible by default. It must be explicitly enabled (see SAP Note 3270462) until a future patch that will correct some known issues and will enable it by default.
Combine Cubes
You may need to synchronize cubes/datasets in these two cases:
- Left join (Request 101276😞 To extend a dataset with columns from another dataset. For example, a dataset containing only sales facts might be extended with details of the buyers.
- Append: To append the rows of a dataset after the rows of another one. For example if a query retrieves a dataset for a given week whereas another query retrieves a dataset for another week. Appending these two datasets generates a single dataset for the two weeks.
The Data mode allows you to perform these two use cases through the Combine Cubes features. In the two cases, you need to define a primary and a secondary cube and a set of objects to map between the two cubes.
To combine cubes:
- Select two nodes in the graph and click Combine in the toolbar.
- In the Create cube dialog box, add a Name and if needed, a Description for the new cube.
- Select the operator to apply: Left join or Append.
- Click the Add keys button to open a dialog box where you can select the objects used as keys for the operation. By default, objects with the same name are used as keys.
- Click OK.

Create Cube Dialog Box

Select Object Used As Keys
A combined cube is created and is displayed in the Objects tab and in the Graph Panel.

New Cube
To edit or delete a combined cube, you may select it in the graph and select the Edit (
) or Delete ( ) button in the graph’s toolbar or the corresponding command in the node’s contextual menu.
 As for cubes coming from a query, you may:
- Display its dataset in the Dataset View by selecting it in the Graph Panel or the Objects tab.
- Apply transformations to its objects.
- Use it as parent for another combined cube.
Deprecated Cubes and Objects
A cube used as parent (primary or secondary cube) of a combined cube will be deprecated:
- This cube and its objects are replaced by the combined cube and its objects.
- It is not possible to use it as parent of another combined cube.
- In the Graph Panel, the name of this cube is crossed out.
- When you return to Design mode, this cube is no longer available and is replaced by the combined cube. In Data mode, you can see which cubes are available in Design mode by selecting the Main View option instead of the All Cubes in the Main > Objects tab.
Deprecated Cubes in Data Mode

Main View in Data Mode
Once the combined cube has been created, the objects of the parent cubes return values resulting from the operation (Left join or Append) that defines the combined cube. If these objects were already used in document report elements, this may impact the values they return.
Web Intelligence: Microsoft OneDrive Repository⤒
Following the support of Google Drive in SAP BI 4.3 SP2, Microsoft OneDrive can be also used as a data source repository or a schedule destination.
Configuring Authentication
As for Google Drive, to authorize the BI Platform to access and use your resources on Microsoft OneDrive, you must configure the OAuth 2.0 protocol. This is done in the CMC > Applications page > Authentication Server Configuration.
Once done, each user must generate its token from BI Launch Pad either in the Settings dialog box of the SAP BI Launch Pad, or when he tries to access the Microsoft OneDrive.
Data Source
The Data Source dialog box contains a new category Cloud Storage, with two options: Google Drive and Microsoft OneDrive.

Data Source Cloud Storage
If the Microsoft OneDrive has been configured in the CMC, then click Microsoft OneDrive to open the Microsoft Drive dialog box where you can browse your folders and select the Excel, Text or CSV file to use as data source (Request 266034).
If the token allowing you to authenticate to Microsoft OneDrive has not been created, you will get an error message before Web Intelligence generates it from your Windows session. Once your token is generated, re-start your workflow.
In the Microsoft OneDrive dialog box, the OneDrive folder contains the files stored in your personal space in OneDrive, whereas the Shared with me folder contains the files and folders that have been shared with you through Microsoft OneDrive or SharePoint Online.

Browsing Microsoft OneDrive
To harmonize the user interfaces, a similar dialog box has been re-used for Google Drive. It replaces the dialog box previously used in SAP BI 4.3 SP2.

Browsing Google Drive
Scheduling
When you schedule a Web Intelligence document, you may select the configured Microsoft OneDrive as destination and select the folder for the generated output (Request 253212).
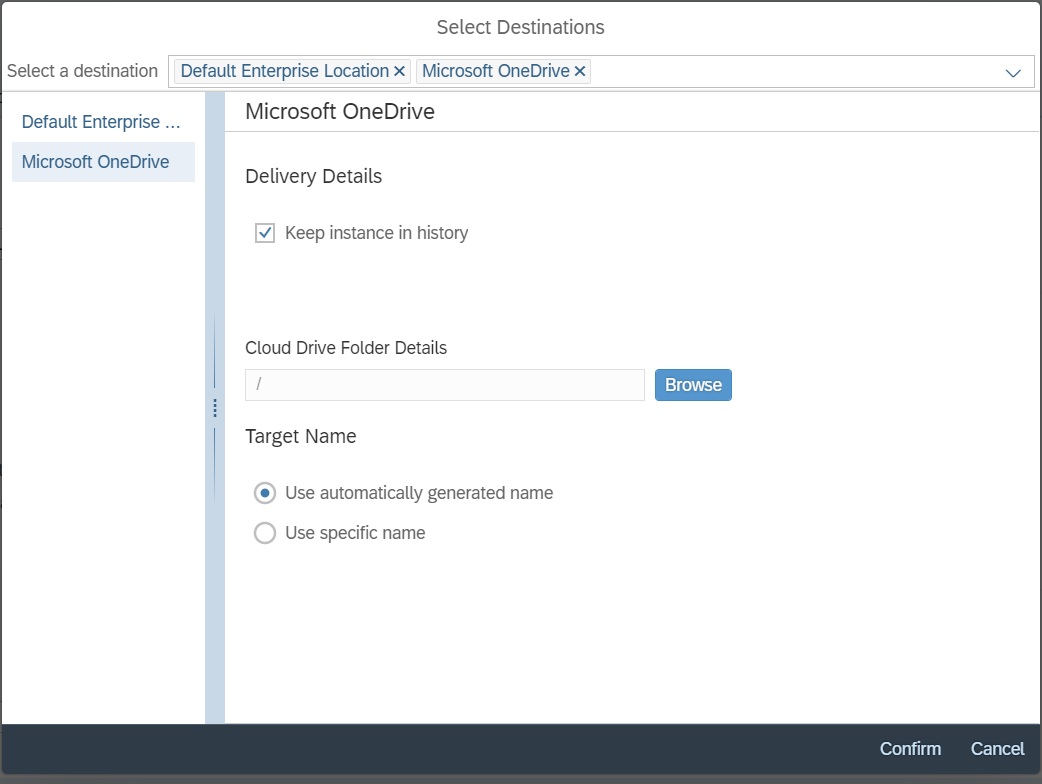
Microsoft OneDrive Schedule Destination
Web Intelligence: Reporting⤒
For users who simply consume documents, new features to enrich your documents and to add interactions to the Reading mode have been added.
Icons
Web Intelligence embeds the SAP Fiori font. Ihis font contains more than 600 icons that you can use in your documents.
In Design mode, in the toolbar’s Insert section, select the Insert cell > Icon command. In the displayed Insert an icon dialog box, you can select an icon among the ones proposed.
![]()
Insert an Icon Dialog Box
- Use the Search text field to narrow down the list of icons by name, categories, or tags (only the categories have been translated).
- Select a category in the drop-down menu to display only the icons in this category.
- Click the Details view toggle-button (
 ) button to display all icons’ details, especially their code.
![]()
Insert an Icon Dialog Box: Details View
Once you have selected an icon, click Insert and click in the report to add a new cell containing this icon at the location of your choice. This cell’s font is SAP-Icon and contains the formula
=Char (IconCode)
Where IconCode is the code of the icon you have selected.
![]()
Cell Icon Format Side Panel
This means you can manually add an icon in a cell by using this formula with the icon code and by setting the SAP-Icon font in the Format > Text Settings tab.
As these icons are provided in a font, you can change their size, color, and apply the Bold, Italic, Underline and Strikethrough properties. (The underline may not be displayed properly on icons whose body is too large.)
These icons can also be used in cells defined as hyperlinks or in Formatting Rules to display visual indicators depending on values.
![]()
Formatting Rules using Icons
To see these icons when exporting a Web Intelligence document to Excel, you need to install the version 4.13 of the SAP-Icon font in your client machine. This font can be downloaded from the SAP FIORI web site.
Justify Text
You may justify a text in a cell (Request 107620). In Design mode, select a cell, a column, or a row. In the Build > Format > Text Settings tab, click the Justify button (
 ) to apply this alignment to the selected item.
Text Formatting Options
This option is also available when defining conditional formatting through Formatting Rules.
Background: Gradient
You can add a gradient color effect in your report or any report element (header, footer, chart, cell…) background.
In the Build > Format > Appearance Settings tab, select the Linear Gradient option in the Background > Pattern section, and use the drop-down menus to choose:
- Two colors, including their transparency.
- The gradient direction: Horizontal, Vertical, Diagonal, …
Once applied, this effect will prettify your document!
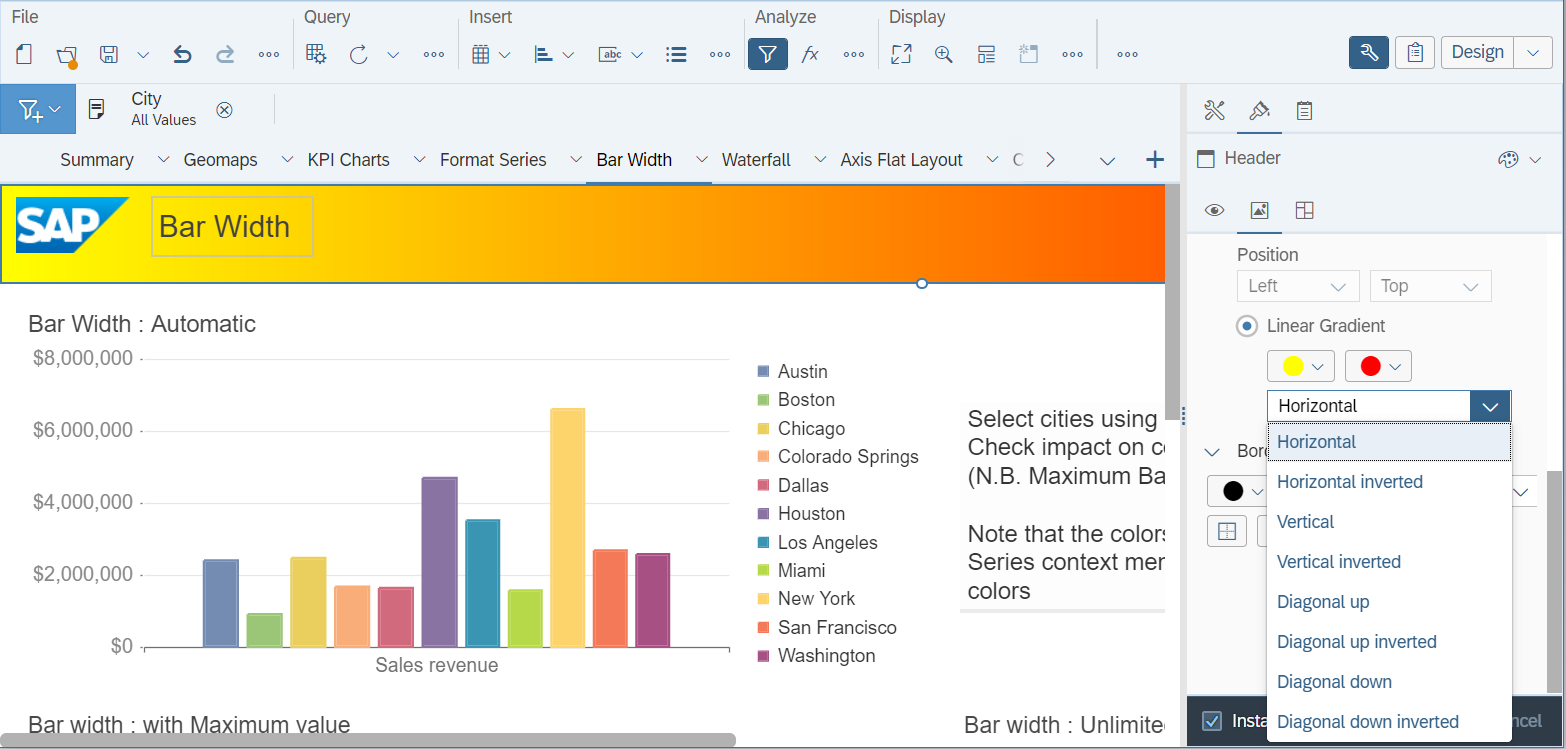
Gradient Definition
For the moment, this property is not yet available in Formatting Rules.
Background: Skin
New skins that can be used for report, table and cell background have been added to the default list available in the Build > Format tab and the Formatting Rules dialog box.

Skins Default List
As in SAP BI 4.2, you can manually add your own skin to this list (Request 285598) if you have access to the file system of the machine running SAP BI 4.3 server. To do so, copy the picture of the skin in the folder $INSTALLDIR/SAP BusinessObjects Enterprise XI 4.0\images.
In this folder, edit the SkinConfig.xml file and add a new entry to declare this new skin. Its syntax must be:
< SKIN NAME="SkinName" KEY="cell,report,section,bloc">
< PVAL NAME="background-fill">bitmapAndColor </PVAL>
< PVAL NAME="background-type">tile</PVAL>
< PVAL NAME="background-color">#ffffff</PVAL>
< PVAL NAME="background-image">boimg://skin_sap.png</PVAL>
</SKIN>
Where:
- SkinName is the name of the skin to display in Web Intelligence user interface. This name cannot be localized.
- KEY is a list defining where this skin can be used (cell, report, section and/or bloc)
- background-fill: Defines if a background color must be added if the picture is transparent:
- bitmap: Do not add a background color.
- bitmapAndColor: Add a background color.
- background-color: The background color of the container, if the picture background is transparent and if background-fill is set to bitmapAndColor. The color must be indicated in hexadecimal format.
- background-type: Defines how the picture is displayed:
- stretch: Stretched to fit the container size, but this may distort it
- tile: Tiled to display multiples occurrences of the picture without modifying it to fill the container.
- background-image: The name of the picture saved in the images/ folder, prefixed with "boimg://".
Reading Mode Interactivity
In addition to hyperlinks, document interactivity in Reading mode has been extended with the following capabilities.
You can sort and rank table and chart values. Click the Build button (
 ) in the toolbar to open the side panel containing the Sort and Ranking tabs. Right-click a table or a chart to select it and use the Sort and Ranking tabs as in Design mode.
Build Side-Panel in Reading Mode
Right-click a chart and select the Maximize icon (
) in the contextual menu to enlarge it. The chart now fills the complete report space. When a chart is maximized, you can:- Use the mouse wheel button to zoom in and zoom out the chart.
- Drag and drop in the chart to scroll in it.
- Click the Close icon (
 ) to restore the graph initial size.
This feature, especially useful in the Mobile user interface, is not yet supported by custom elements.

Maximized Chart in Reading Mode
As in Design mode, if the document contains custom elements, you can select events to be caught by Web Intelligence rather than the custom element itself. To do so, unselect the Custom Element Interactions button in the toolbar. When interactions are managed by Web Intelligence, right-click a custom element to open the contextual menu through which you can add a comment (
 ) on this custom element.
Section and Sub-Section
From SAP BI 4.3 SP3 Patch 4 on, if you have defined sections with sub-sections, you can define the space after the last instance of this sub-section. In Design mode, select the section, and open the Build > Format > Layout Settings sub-tab. This space can be defined in the new parameter Last sub-section spacing.

Last Sub-Section Spacing Parameter
Web Intelligence: Charts⤒
For charts, the main new feature is the trellis chart, that can be described as chart with sections. Two enhancements are also added to geo-maps.
Trellis
Trellis is a new category of charts that display multiple sub-charts, one for each value of a set of dimensions.
In Design mode, to turn a report element into a trellis, select it and:
- In the Build > Feeding tab, in the Turn To section, open the Multiple drop-down menu and select the sub-chart type (Pie Chart, Column Chart…)
- In the Data Assignment > Chart Multiplier section, add the objects the values of which will define the charts the trellis will display.
- Fill the other Data Assignment sections. Note that these sections depend on selected sub-chart type.
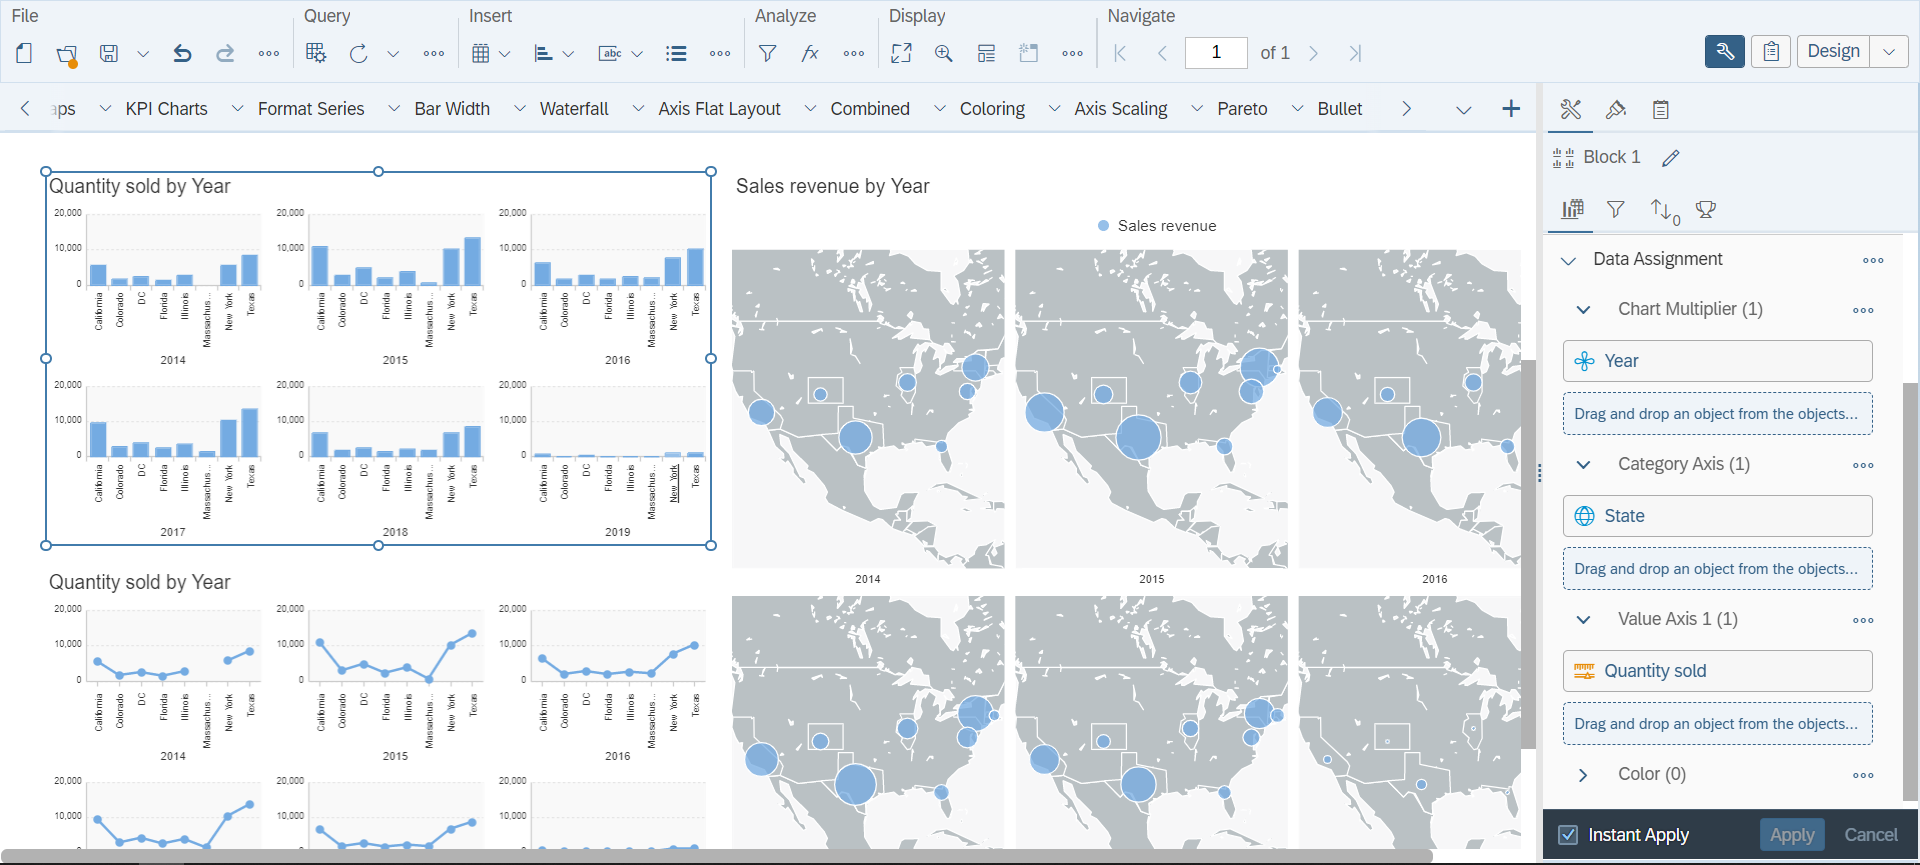
Trellis Feeding
Via the the Insert > Insert Chart > Multiple menu available from the toolbar, you can also directly add a trellis chart type in a report and then add the objects to feed this chart.
These trellises have specific parameters that can be set in the Build > Format > Display settings sub-tab. In the Display > Layout section:
- Use the Multi Charts Layout to define how the sub-charts must be organized in the trellis (Automatic, Row Layout, Column Layout, Dimensional Layout).
- Unselect the Partial display checkbox to display all sub-charts. This option is selected by default to prevent the display of too many sub-charts. The last occurence is then replaced by a tile with three dots.

Trellis Properties
Geographical Database
From SAP BI 4.3 SP3 Patch 2 on, the geographical database used by Web Intelligence has been updated.
The 100 000-inhabitant cities limit for other countries than United States of America has been removed and this geographical database contains about 10 times more cities.
The geo-mapping by name process has also been optimized and is faster, even if the database contains more cities.

Geo-Mapping by Name
Disabling Geographic Maps
If the default map conflicts with your country’s map standard, you may disable the geographic map support.
- Log into the CMC and select Web Intelligencein the Applications page.
- Open the Properties dialog box and unselect the Geographic Maps Support > Enable geographic maps in applications checkbox.

CMC - Web Intelligence Properties
Then in Web Intelligence, a warning is displayed instead of the geographic map(s).

Warning in Web Intelligence Geographic Map
Geographic Map Margins
By default, a geographic map may miss some margins to show all labels. To add some vertical margins to it, in Design mode, select the reserve space option for this chart in the Build > Format > Plot Area > Data label > Text Alignment section.
Web Intelligence: Prompts and Variants⤒
Several enhancements have been made to prompts and BI variants.
Prompt Hint
Prompts support a new text property named hint. This hint is displayed when the user must answer these prompts in the Prompts dialog box. It can be used by document designers to help their users answer these prompts (Request 109470).

Hint in Prompts Dialog Box
In Design mode, you can define this hint in the Prompt hint text field available when creating or editing:
- A filter prompt in the Edit Prompt dialog box.
- A member prompt in the Member Selector dialog box > Prompt tab.
- A ranking prompt, in the Prompt Properties dialog box when defining a ranking in the Query Panel.

Prompt Hint in Prompt Properties Dialog Box
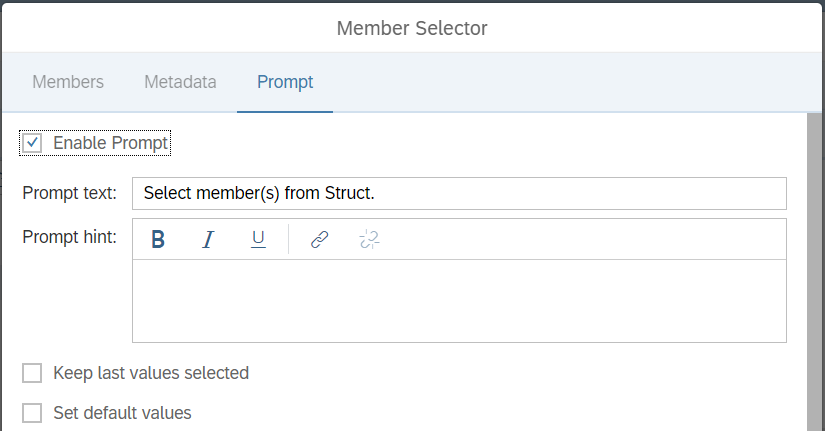
Prompt Hint in Member Selector Dialog Box

Prompt Hint in Ranking Prompt Properties Dialog Box
The buttons in this text field toolbar allow you to bold, italicize or underline the selected text or add an hyperlink.
Prompt hint can also be defined in Information Design Tool.
Prompt Order
In Design mode, the Main side panel contains a new tab named Prompts listing all the prompts of the document. If you select a prompt, the Build > Properties tab displays the properties of this prompt, including its hint and the queries it is coming from (this may be useful if the prompt has been factorized).
If your document contains prompts coming from several queries, you can define in which order they are displayed in the Prompts dialog box (Request 130222). Use the Move Up (
 ) and Move Down (
 ) buttons and click Apply to change the prompts default order. Click the Reset All button () to restore the default order.
Prompts Tab in Design Mode
If variants have been defined for your prompts, you can click the Shared Variants button (
 ) to open a dialog box where you can decide the ones to be public or to remain personal.
 This Prompts tab is also available in Reading mode but it displays only the prompts answers and you cannot change the prompts properties.

Prompts Tab in Reading Mode
Public Variant
Variants are lists of predefined answers to prompts. Since their release in SAP BI 4.1, they are only available to the users who have created them. In SAP BI 4.3 SP3, you can also share your variants so they can be used by any users (Request 130737).
When you save your answers as a variant, select its type in the drop-down list of the Create Variant dialog box:
- Personal: To be the only one to use it, as in previous releases.
- Public: To share it so that it can be used by any users.

Create Variant Dialog Box
In the Prompts > Available Variants dialog box, when you select a variant to answer some prompts, click:
- The Personal tab to see only your personal variants.
- The Public tab to see all variants that have been saved as Public.

Available Variants
In Design mode, you can also change the type of a variant. In the Prompts tab, click the Share Variants icon (
) in the toolbar. A window opens with the list of variants. Select the toggle to select it as a personal or public variant.
Share Variants in Prompts Tab
Scheduling and Variant
Variants are available when scheduling a document (Request 130738).
In BI Launch Pad, when you schedule a Web Intelligence document, select the Report Features tab in the Schedule screen and go to the Prompts section.
Click Edit Prompt Values to open the Prompts dialog box. In the header, click the Variants icon to open the Available Variants dialog box and select a variant to answer the prompts before creating the schedule.
Prompts' List of Values
If the prompt contains default values, you can open the menu beside the Reset to Default button in the Prompts dialog box and select Remove all values to remove all selected values.
When refreshing a list of values, a warning icon is displayed if the refresh is partial (Request 277838).
From SAP BI 4.3 SP3 Patch 1 on, in Reading mode, the Prompts dialog box is no longer modal. When it is displayed, you can use the BI Launch Pad header to display another document or return to the BI Launch Pad home page.
Web Intelligence: Hyperlinks⤒
Hyperlinks have become widely used to add interactivity in Web Intelligence documents. In SAP BI 4.3 SP3, hyperlink creation has been simplified. There are now less dialog boxes and less steps. For consistency purposes with inter-document links and prompts, intra-document links have been improved and can filter the target report through input controls.
Inter-Document Usability Enhancements
In Design mode, the Hyperlink item of a cell’s contextual menu offers the following options:
- Add hyperlink to another document
- Add hyperlink to this document
- Add hyperlink through URL
If you select Add hyperlink to another document, the Select a document dialog box opens and you can directly select the target document. Once selected, the document is automatically analyzed. All possible Opendoc URL parameters and all
prompts of this document are displayed.
Inter-Document Link Creation
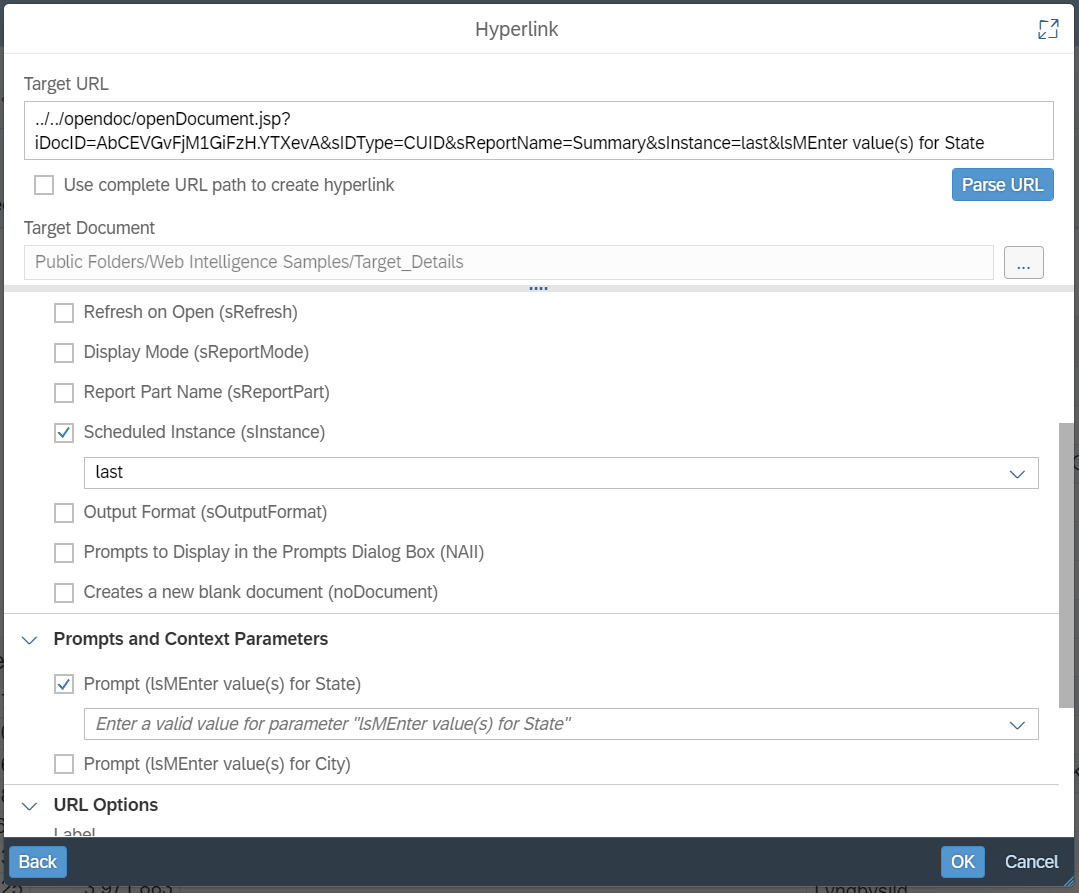
You can modify these parameters and prompts by explicitly typing a value in the corresponding text field or opening the drop-down menu to select one of the possible values (e.g. for the Report Name parameter, the drop-down menu displays also the list of reports of the document), an object or type a formula. Once you have modified any of them, the URL is updated in the Target URL text field to reflect your change.
You can directly modify the URL in the Target URL text field. Click the Parse URL button to analyze this URL and update the values of the Opendoc URL parameters and prompts.
Click OK to validate the URL and close the Hyperlink dialog box.
Intra-Document Link Input Control
When creating an intra-document link, if the target report contains input controls based on a relational object the type of which is List or Entry field, you can set their values to filter this report (Request 215286).
In Design mode, right-click a cell and select Hyperlink > Add hyperlink to this document from the contextual menu to add a link to another report of the same document.
When you select your target report in the Hyperlink dialog box, the input controls of this report are displayed. A warning is displayed beside the input controls that are not yet supported.
Select the checkbox beside a supported input control to set its value. As for prompts in inter-document links, you can set a static value, or pass the value of an object or a formula that will be evaluated in the context of the value clicked to follow the link.

Intra-Document Creation HyperLink
Passing multiple values to one input control is not supported; a string containing semi-colons is considered as one single value.
Click OK to validate the link and close the Hyperlink dialog box.
When you follow this hyperlink, the target report is displayed and filtered by input controls with the values that were passed.
OpenDocument URL
From SAP BI 4.3 SP3 Patch 5 on, the OpenDocument URL feature has been reviewed to behave as in SAP BI 4.2 when the document must be refreshed (Refresh on Open, sRefresh=Y).
- If the document contains only optional prompts, then they are prompted in the Prompts dialog box.
- If at least one prompt has been answered in the OpenDocument URL, then mandatory prompts with previous values (assuming the document has already been refreshed) or default values are considered as answered and are not prompted.
For more details on these changes, refer to the SAP Knowledge Base Article 3357866.
Web Intelligence: Formula Language⤒
New functions and options have been added to the Web Intelligence formula language.
Input Controls and Element Linking Selection
To retrieve values selected in input control (Request 102655) or element linking (Request 111613), two new functions have been introduced.
- string InputControlFilter ( string ic_name; [string sep[; string report_name]])
- string ElementLinkingFilters ( string block_name; [string sep[; string report_name]])
With:
- ic_name: the name of the input control.
- block_name: the name of the block for which the element linking has been defined.
- sep: the string that separates the returned values. Its default value is "-".
- report_name: the name of the report containing the input control or the element linking.
If the input control (resp. the element linking) is not found, then InputControlFilter (resp. ElementLinkingFilters) returns an empty string.
Because of the document format change, in documents created in previous releases, you must first select a value in the input control or the element linking and save the document at least once before these functions return a correct answer.
ReportFilter Separator
The function ReportFilter has a new parameter which defines the separator between the returned values. In some cases, this may simplify how you parse the result string.
- string ReportFilter ( Object obj [; string sep] )
With:
- obj: the name of the object.
- sep: the string that separates the returned values. Its default value is ";".
Auto-Documentation Functions
For auto-documentation purposes, two functions have been added: one to return the description of an object or a variable (Request 213611) and another one to return the formula of a variable.
- string DescriptionOf ( Object obj )
- string FormulaOf ( Object obj )
With:
- obj: the name of the object.
Next
The Next function has been added for consistency with the Previous function (Request 137320). It returns the next values of an object.
- input_type Next ( Object obj; [;Row|Col][;reset_dims][;Integer offset][;NoNull])
With:
- obj: the name of the object. Unlike the Previous function, the self parameter is not supported.
- Row or Col: defines if the next value must be retrieved in the row or the column.
- reset_dims: a list of dimensions that resets the calculation.
- offset: the distance of the next value to return. Its default value is 1.
- NoNull: used to return the first non-null value.
Refer to the Web Intelligence Functions Guide for more details about the constraints to use the Next function.
Reverse
The Reverse function has been added to reverse a string (Request 120009); which may be useful for complex string processing.
- string Reverse ( string str )
With:
- str: the string to reverse.
ToDate Year Cut-Off
By default, the ToDate function considers that a two-digit year is in the XXIst century if this year is lower or equal to 29 or in the XXth century otherwise. To explicitly define this century, a new parameter has been added to this function (Request 281159😞
- string ToDate ( string date ; string format [;integer year] )
Where:
- date: the string containing the date to convert.
- format: the date’s format.
- year: this new cutoff year parameter.
For example:
| Formula | Year |
| ToDate("12/15/30 11:00:00";"INPUT_DATE_TIME") | 1930 |
| ToDate("12/15/30 11:00:00";"INPUT_DATE_TIME";2040 ) | 2030 |
| ToDate("12/15/30 11:00:00";"INPUT_DATE_TIME";1640) | 1630 |
| ToDate("12/15/30 11:00:00";"INPUT_DATE_TIME";1625) | 1530 |
Web Intelligence: Change Source⤒
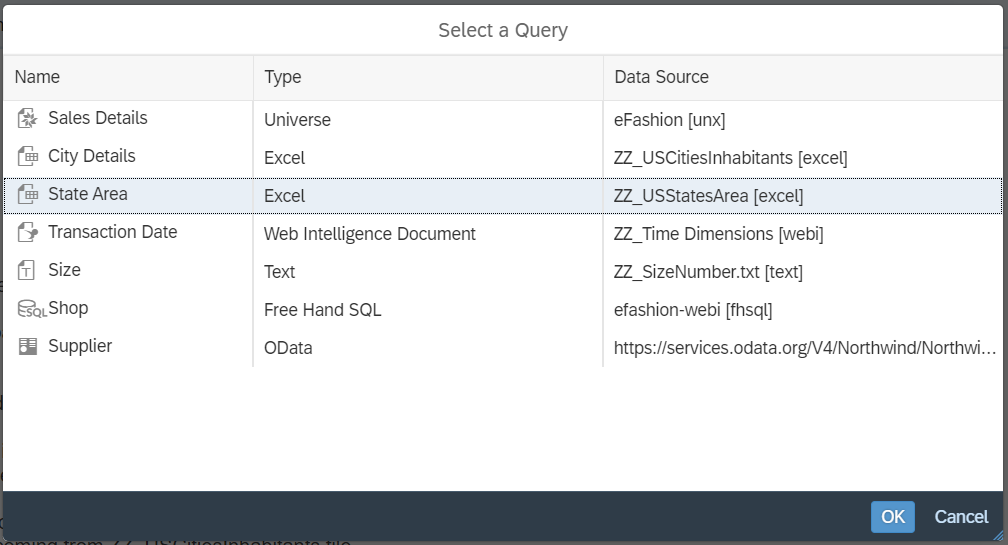
Changing the data source of a document is no longer limited to universe, SAP BW and SAP HANA data sources. In SAP BI 4.3 SP3, you can do it even for query based on a Web Intelligence, Excel (Request 137585), Text or Free-Hand SQL (Request 285061) data source. The target query can be another existing query or a query created on the fly on a universe, an SAP BW or an SAP HANA data source.
When you click Query > Change Source in Design mode, you can select any query from the document in the Select a Query dialog box. In previous releases, you could only select a query based on a universe, SAP BW or SAP HANA.
Select a Query
Then, in the Change Source dialog box, for the target query, you can select the:
- Choose an existing data source from the document radio-button to select another query of the document.
- Specify a new data source radio-button to create another query. The Select a Data Source dialog box introduced in SAP BI 4.3 SP2 opens but only with the Universe, SAP BW and SAP HANA options. For other data source types, you need to first create the target query before running the Change Source and then select Choose an existing data source from the document radio-button to select this query.

Change Source Dialog Box
For Excel, Text or FHSQL data sources, it is recommended to use this new Change Source functionality rather than the Change Path. This is especially true when the two data sources differ since you can explicitly map objects; which cannot be done through the Change Path.
You need the Edit Query security right to do a Change Source (Request 283525). This change has also been released in SAP BI 4.3 Support Package 2 Patch 8.
Web Intelligence: Mobile Interface⤒
If you access your Web Intelligence documents from a mobile device, an optimized interface is available for easier navigation on such small screen. This optimized interface does not require to install a specific application on your mobile. It is available through a browser but can only be accessed if you open your document from an Opendoc URL, to skip the BI Launch Pad pages that have not been optimized for mobile devices. You only need to authenticate to the BI Platform repository through the SAP BI Launch Pad login page.
This mobile mode is proposed only for Reading mode, since it would be too cumbersome to edit a document on a mobile device. The mobile interface is identical to the one available when accessing on a non-mobile device, with some updates for a better display on mobile devices. Only the interface is adaptive, the document content is not and is displayed as it has been designed.
Toolbar, Dialog Boxes and Side Panels
If you open a Web Intelligence document using an Opendoc URL in a mobile browser, the document is displayed in a user interface adapted to the smaller screen once you have authenticated.
This interface is available only in Reading mode, but proposes all features available through a desktop access. When the screen is displayed horizontally, the toolbar contains only the most common commands: Refresh, Undo, Redo, Filters. You may tap the More icon button (
) to open a side panel with the other commands available in Reading mode. When the screen is displayed vertically, the toolbar contains only the More button () you may tap to open the side panel with all commands.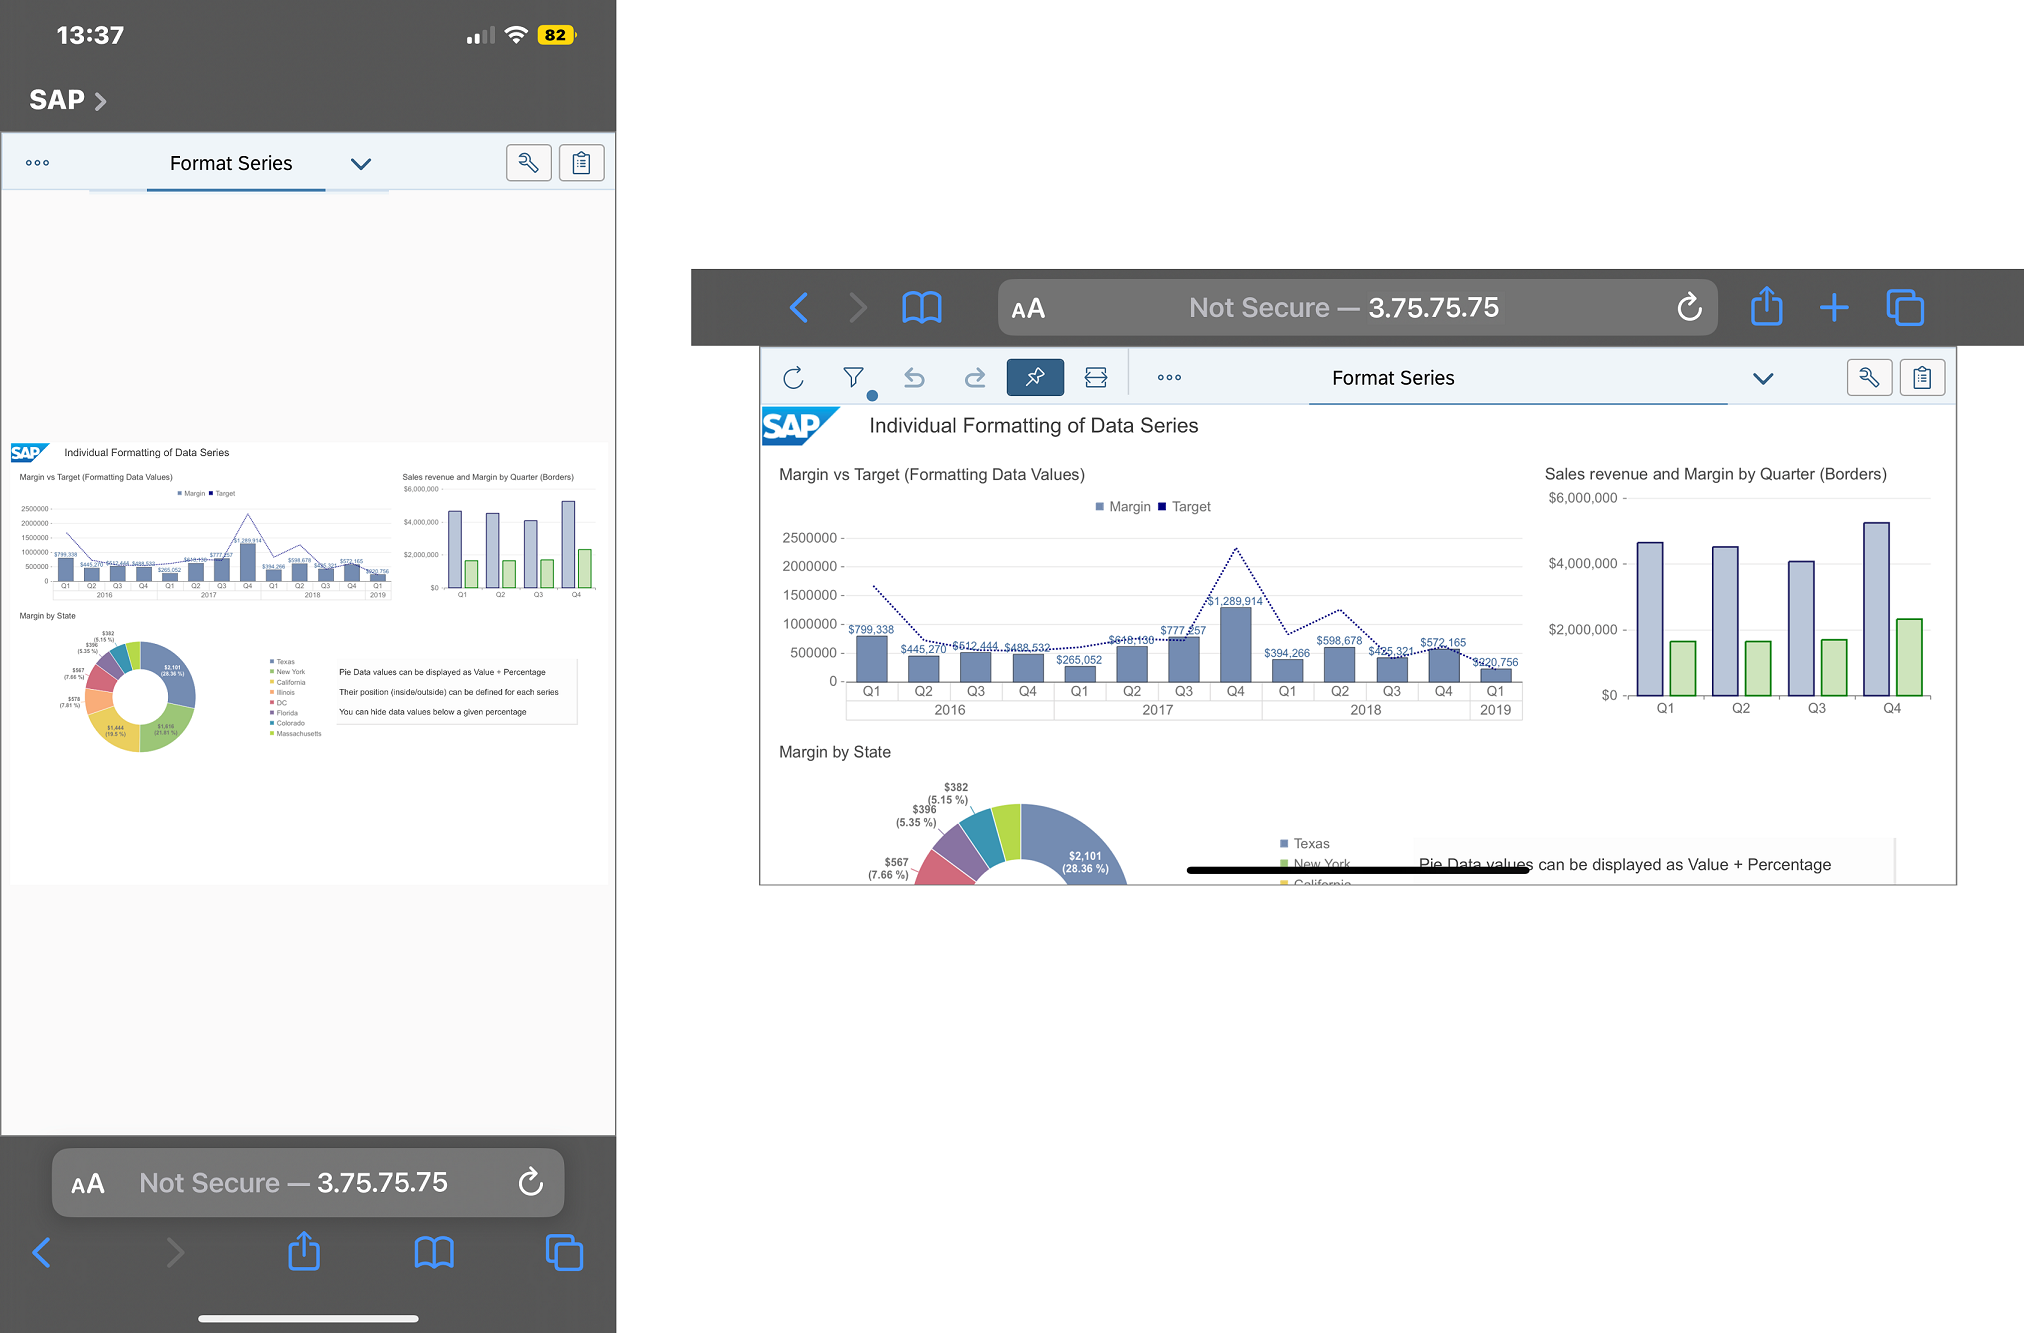
Landscape and Portrait Display in Mobile Interface

More Toolbars in Mobile Interface
The dialog boxes (Prompts, Input Controls, …) and side panels (Properties, Navigation Maps, …) have been adapted to the mobile screen.
For example, changing from one report to another is done through a drop-down menu.

Report Selection
Document Interactions
Like in Reading mode, some specific interactions are possible with the mobile interface. But they slightly differ on the mobile screen:
- You must press a table or a chart more than 2 seconds to select it. This is the equivalent to the left click on a desktop. You can then open the Build side panel to rank and sort it.
- If you have selected a chart, you can click the Maximize button from the contextual menu to maximize it. You can then:
- Swipe to scroll in the chart.
- Pinch or pan to zoom in or zoom out.

Maximized Chart
Web Intelligence: Usability Enhancements⤒
For better productivity when using or creating Web Intelligence documents, several optimizations have been made in the user interface.Toolbar: Open, New and Favorites Actions
The Web Intelligence toolbar proposes new buttons to perform common actions without having to return to the BI Launch Pad home page:

Reading Mode Toolbar
- Click the New button (
 ) to create a new document and open the Select a Data Source dialog box (Request 281798).
 - Click the Open button (
 ) to select and open another document through the Open a Web Intelligence Document dialog box:
 - In the Folders tab, you can browse documents in your BI Inbox, Recent Documents or Favorites in addition to Personal Folders and Public Folders.
- In the Categories tab, you can browse documents by categories.
- In the Recovered Documents tab, you can open auto-saved documents. If such a recovered document exists, a yellow bullet is displayed in the toolbar on the Open button (
 ). By default, the documents are auto-saved every 10 minutes and the clean-up is done every 24 hours. These settings can be changed in the CMC, in Web Intelligence Properties, in the Auto-save Settings.
 - You can mark or unmark the current document as favorite:
- In Reading mode, by clicking the Mark as Favorite (
 ) or Remove from Favorites button (
 ) in the toolbar.
 - In other modes, by selecting the Mark as Favorite or Remove from Favorites command in the File > More () menu.

Open Dialog Box
Send to and Export to
From SAP BI 4.3 SP3 Patch 1 on, the Send to Inbox command in the toolbar has been replaced by the Send to command. Use it to open the Send to dialog box and send your document into one of the destinations configured by your administrator, as in SAP BI 4.2.
Select your destination in the left panel (BI Inbox, Email, FTP Server, SFTP Server or File System) and select Use default settings to use the configuration defined by your administrator for this destination or enter your own parameters.

Send to Dialog Box
Also in SAP BI 4.3 SP3 Patch 1, when you export a document content into CSV, the Options tab in the Export to dialog box contains the Set as default values checkbox.
As in SAP BI 4.2, select this checkbox to save the options you may have changed so that they will be preset the next time you export to CSV.

Set as Default Values
Data Source Selection
In the Select a Data Source dialog box, the Recents section keeps the history of the last 20 data sources you’ve used. Select one of them to directly open it the Query Panel and avoid browsing the BI Platform repository or the local file system (for the Rich Client) to select it.

Recents Data Source
When you select a Text, CSV or Excel file as a data source, you can browse the BI Platform repository through your Favorites, your Recent Documents or the categories. When you select a Web Intelligence document as a data source, you can also browse the BI Platform repository through your Recent Documents.
Select, Move, and Resize
In Design mode, interactions with the document, such as moving and resizing blocks have been simplified:
- When you move a block, temporary guides appear to help you align and snap this block with/to other close blocks. You can disable these guides by pressing the [Alt] key while moving the block.
- You can click anywhere on the report and drag your mouse to select all blocks within the generated lasso.

Guides for Alignment
- You can move multi-selected blocks at the same time.
- Clicking on a column on a table selects this column. Clicking it a second time selects the table.
- When you select a vertical table, horizontal anchors appear to resize it horizontally. Likewise, selecting an horizontal table displays vertical anchors.
- You can resize a table column or row by dragging and dropping its border without having to first explicitly click and select it.
- When several columns are selected, the contextual menu contains the Formatting Rules command. Click it to open the Apply Formatting Rules and select the rule(s) to apply to these columns (Request 202143).
- When you resize a cell, press the [Shift] key for a proportional resize of its length, height, and text.
Optimized Interface
The user interface has been optimized to reduce empty space:
- In the Query Panel, in the Results and Filters sections, the size of the objects matches the object name, and is no more a fixed size.
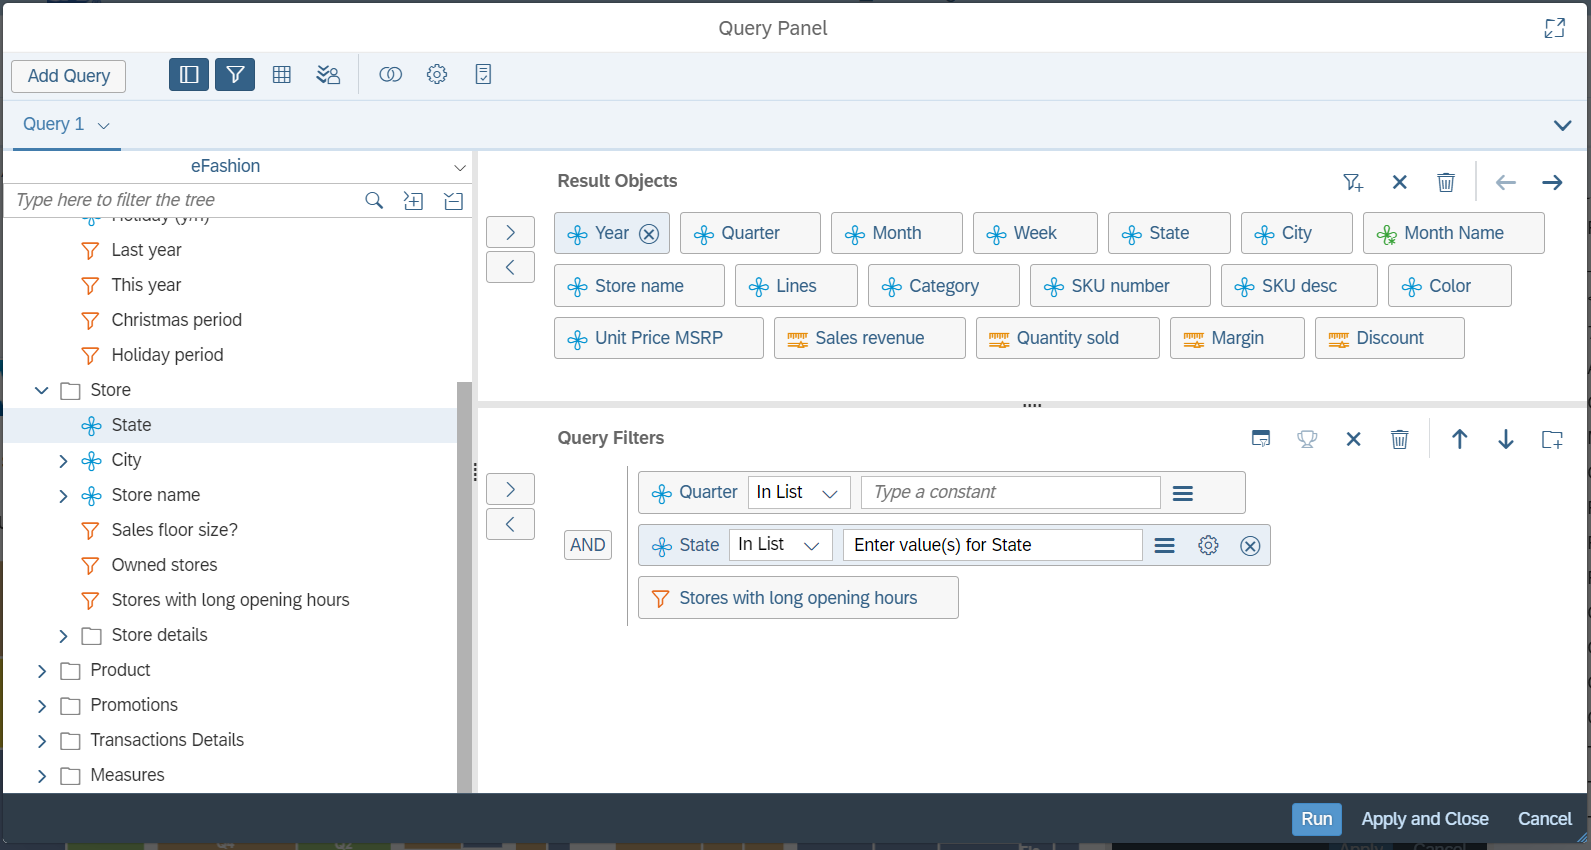
Objects in Query Panel
- When objects are listed (in the Query Panel, the Main > Objects tab…), the space between the objects has been reduced.
- In the toolbars, the space between the buttons has been reduced.
- The SAP BI Launch Pad header height has been reduced.
- To maximize the display of document content in the browser (Request 283731), click the Hide main toolbars toggle button () in the Display section of the main toolbar, or use the [Ctrl]+[M] shortcut for Windows (⌘ M for Mac). This hides the BI Launch Pad header and auto-hides the Web Intelligence toolbar.
To keep the toolbar visible, click the Pin toolbar button ( ) in the Display section of the toolbar.
To return to a normal display, unselect the toggle-button. - The Web Intelligence Rich Client and the Opendoc URL interface do not propose the Hide main toolbars toggle button. But you can click the Pin toolbar button to auto-hide the Web Intelligence toolbar.
- A Web Intelligence widget displayed in BI Workspace has a toolbar containing the Undo, Redo, Export (Request 286657), Print, Refresh and Hide main toolbars buttons. From SAP BI 4.3 SP3 Patch 1 on, the widget toolbar is identical to the Web Intelligence application toolbar.
Formula Editor and Formula Bar
In the Formula Editor, you can click the Description button (
 ) in the toolbar to hide the variable’s description or display it to edit it.
Variable Description in Formula Editor
In Design mode, the Formula Bar height is no longer limited to 3 lines. You can drag it to resize its height or double click its bottom border to autofit its height. The new Code Editor introduced in SAP BI 4.3 SP2 with syntax coloring and improved auto-completion is used in the Formula Bar and in side panels.

Formula Bar
In the Formula Editor and Formula Bar, when you validate a formula and an error is found, the cursor is moved to the location of this error and the erroneous token is highlighted (Request 241585).
Copy From XLS/Text
You can copy a column from an Excel or Text file and paste it to add multiple values at once in a text field:
- When selecting default values for a filter from a list in the Query Panel.
- When selecting default values in the Prompt Properties dialog box.
- When defining an input control’s restricted list of values in the Select Values for dialog box.
- When defining a report filter’s values in the Report Filter dialog box.
Multiple values are separated by semicolons (";").
In SAP BI 4.3 SP2, this capability has been introduced only in the Filters section of the Query Panel.
Side Panels
In the Main > Comments tab, user’s initials are used in the avatar to identify him or her.
In Design mode, when you select a merged object, a reference or a calendar in the Main > Objects tab, you can edit the corresponding definition in the Build > Properties tab.
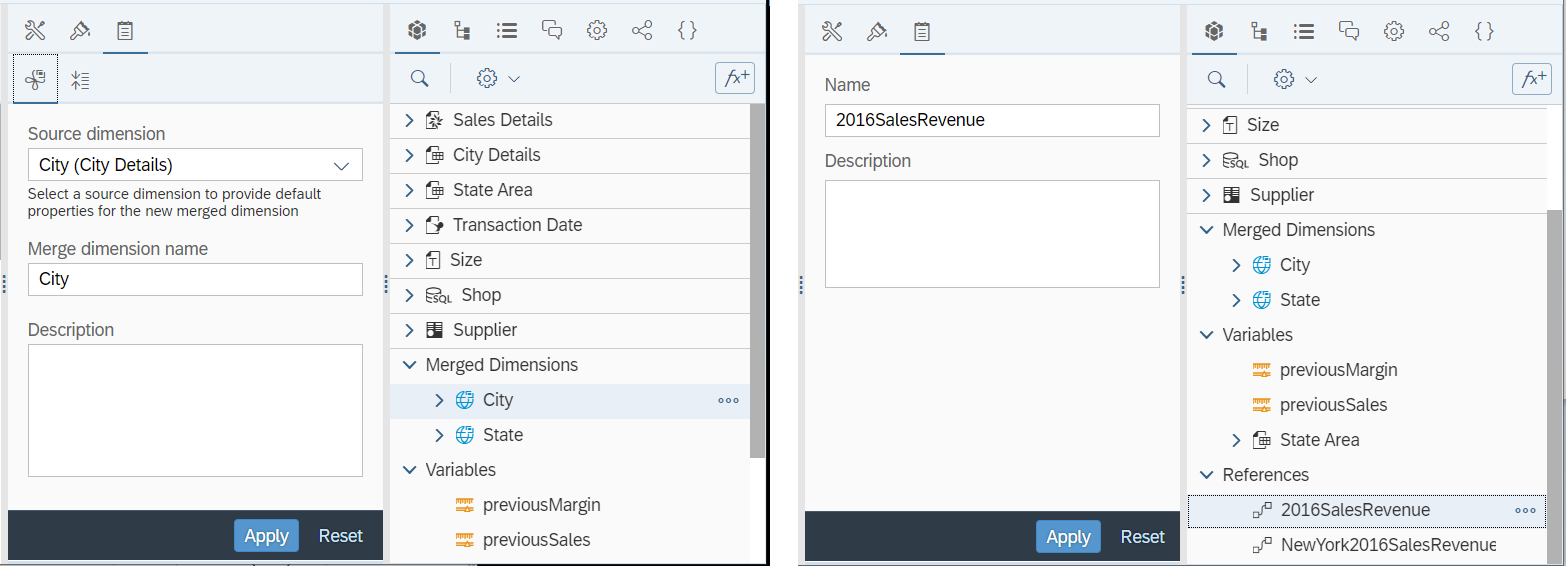
Side Panels: Merged Object and Reference Properties
If you select a dimension, you can also directly edit its custom order in the the Build > Properties > Custom order tab.

Side Panels: Calendar Properties and Custom Order
These side panels display the same content as the corresponding dialog boxes but are easier to access. These dialog boxes remain available from the object contextual menu.
In Design mode, when you select a custom element that has more than one section in the Build > Format > Extended parameters tab, these sections are collapsed by default. Two buttons in the toolbar can be used to collapse or expand all these sections at once.
Pixel Measurement
In addition to centimer and inch, you can select pixels as measurement unit (Request 105019), as in previous releases. In the BI Launch Pad Settings dialog box, go to Application Preferences > Web Intelligence and select Pixels as Measurement unit.
![]()
Web Intelligence in BI Launch Pad Settings
Log out and log back in to have the measurement displayed in pixels is Design mode.
Input Control: Search Objects
When creating or editing an input control, the Object drop-down menu has a Search field to quickly find an onject by its name.

Input Control Search Object
Shortcuts ⤒
Several new shortcuts have been implemented:
| Windows | iOS | Actions |
| [Alt]+4 | ⌥ 4 | Switch to Data mode |
| [Ctrl]+R | ⌘ R | Refresh all refreshable data providers |
| [Ctrl]+M | ⌘ M | Show/hide the toolbars |
| [Ctrl]+[Alt]+T | ⌘ ⌥ T | Open the Send to dialog box |
| [Ctrl]+E | ⌘ E | Opens the Export dialog box |
Web Intelligence: Rich Client⤒
As in SAP BI 4.2, Web Intelligence Rich Client supports the Standalone mode in which you can use Web Intelligence without authenticating against a repository. In the Start Session dialog box, select the Standalone button and click Start.
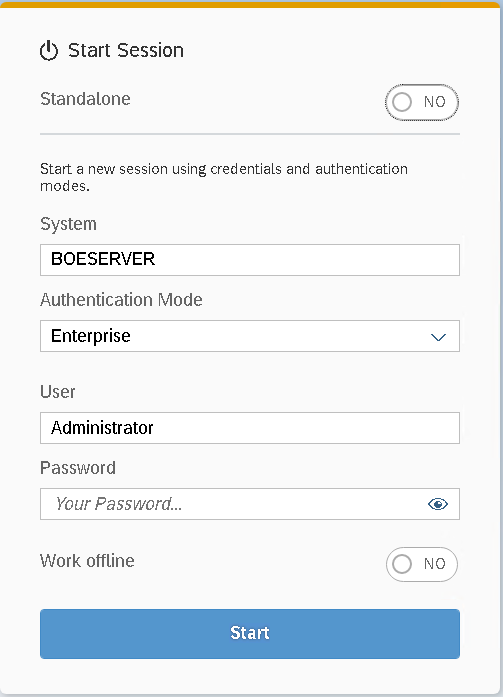
Web Intelligence Rich Client Login Dialog Box
In this mode, you can only open unsecured, local Web Intelligence documents and local data sources.
In the Settings dialog box, you can select the General > Launch Web Intelligence Rich Client in Standalone mode checkbox to always start the Web Intelligence in this mode.
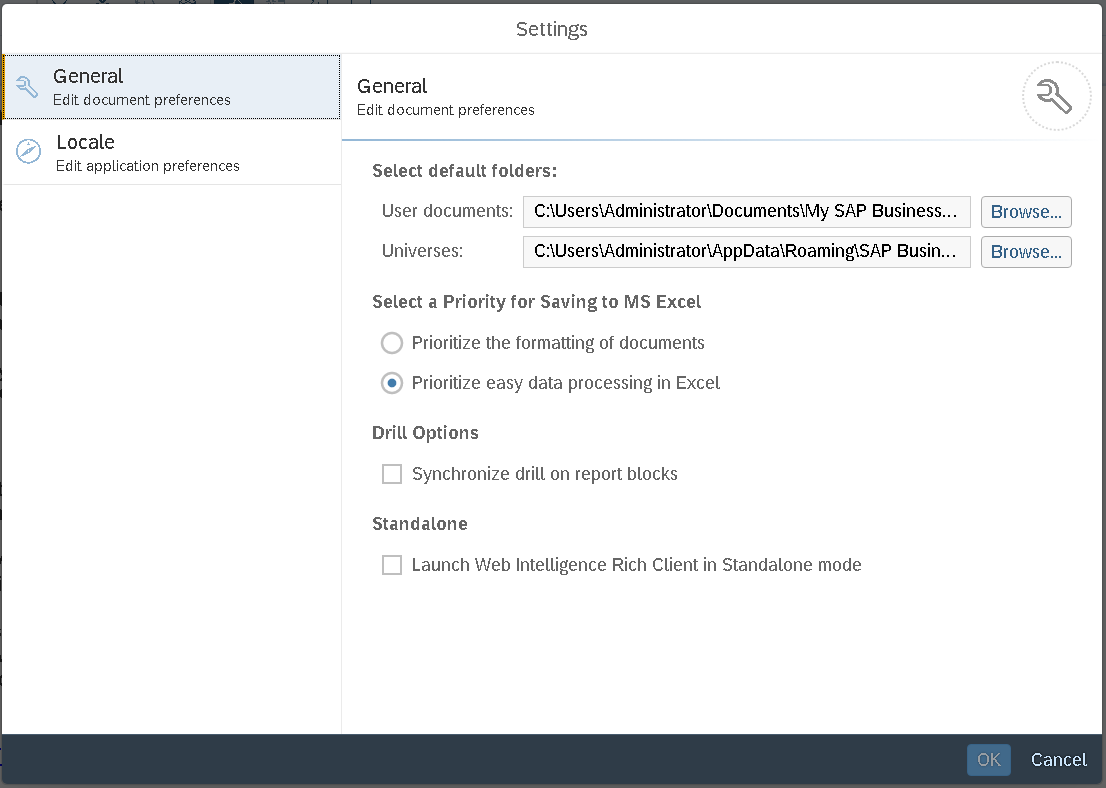
Web Intelligence Rich Client Settings Dialog Box
In the same Settings dialog box, you can also set pixels as measurement unit by selecting the Locale > Pixels checkbox.
When Web Intelligence Rich Client is online, the cluster name is displayed in the Web Intelligence header rather than the server’s IP address (Request 282688).
When you import a document from a repository, like in BI Launch Pad, you have more options to browse the repository: Categories (Request 274265), Favorites, Recent Documents, BI Inbox…
Web Intelligence: Expose OData⤒
New OData APIs are available in SAP BI 4.3 SP3 to complete the OData APIs introduced in SAP BI 4.3 SP2 to retrieve the content of a Web Intelligence document.
Document Base Root URL
In SAP BI 4.3 SP3, the Web Intelligence document is considered as an OData service with its own base-root URL. This URL is:
http://<server>:<port>/biprws/raylight/v1/documents/cuid_{docCUID}/datamodel/data.svc/
Use it to retrieve a JSON listing the service’s list of entities, i.e. the document’s report elements and cubes. The previous endpoints available in SAP BI 4.3 SP2 (one for each report element) remain supported, but it is recommended to use this new one.
You can suffix this new base-root URL with /$metadata to retrieve an XML with the detailed metadata returned by the service or with the path to query a specific report element or cube.
Recurring Instance Base Root URL
In SAP BI 4.3 SP3, Web Intelligence document’s recurring instances are also considered as OData services with their own base-root URL. These services return the data of the schedule’s last instance. This allows you to get refreshed data since the document OData URL can only return the document’s last saved data.
The base-root URL of a recurring instance is:
http://<server>:<port>/biprws/raylight/v1/documents/cuid_{docCUID}/schedules/cuid_{scheduleID}/datamodel/data.svc/
This URL can be found In BI Launch Pad by selecting the recurring instance’s Details dialog box.

Web Intelligence Recurring Instance Details
You can suffix these base-root URLs with /$metadata to retrieve an XML with the detailed metadata returned by the service or with the path to query a specific report element or cube.
Cube and Report Element Content
To get a document’s cube dataset, you can suffix the base-root URLs with /cube_{dataProviderID}-{flowID}, with:
- {dataProviderID}: the ID of the data provider.
- {flowID}: the ID of the flow.
This URL can be generated in Data mode, in the Main > Objects tab, by selecting the Copy OData Web Services Link command in the cube’s contextual menu.

Generate OData Link in Data Mode
To get a document’s report element dataset, you can suffix the base-root URLs with /re_{reportID}-{reportElementID}, with:
- {reportID}: the ID of the report containing the report element.
- {reportElementID}: the ID of the report element.
This URL can be generated as in SAP BI 4.3 SP2 in Design mode by selecting the Copy Link For > OData Web Services in the contextual menu of the report element.
In the user interface, the commands to generate the OData URL to a cube or a report element can be hidden through the Generate Link > OData customization set in the CMC.
OData Operators
In addition to the $count, $top and $skip operators supported since SAP BI 4.3 SP2, you can specify your OData API requests thanks to these operators:
- $select: to select the objects in the query. For example $select=Country,Year,Margin
- $filter: To filter the returned dataset. The filter can use the OData keywords for eq (equal), ne (non equal), gt (greater than), lt (less than), in (in list) and null (null)
Several filters can be aggregated with the and and or operators. For example: $select=Country eq 'US' and Year gt 2019 - $orderby. To sort the dataset based on an object’s values. You may use asc or desc to define if the sort is done in ascending or descending order. For example: $orderby Year asc
If the dataset is too large to be returned in one call, then the response returns another URL through the odata.nextLink annotation.
These new operators are also leveraged to enhance and optimize the OData calls when a Web Intelligence document queries OData as a data source.
Semantic Layer: Data Sources⤒
New Data Sources
In addition to the data sources supported in previous releases, the following additional data sources have been added to the SAP BI 4.3 Product Availability Matrix.
New data sources:
- Google BigQuery (JDBC and ODBC drivers)
- HP Vertica 11 (JDBC and ODBC drivers)
- IBM Informix 14 (JDBC and ODBC drivers)
- MariaDB (JDBC driver)
- Microsoft Analysis Services 2019
- MongoDB 5 (ODBC driver)
- Oracle 21c (JDBC, ODBC and Oracle OCI drivers)
- PostgreSQL 14 (JDBC and ODBC drivers)
- SQLite (native SQLite driver)
- Trino (JDBC driver) (Request 276312)
New big data and cloud databases:
- Amazon RDS
- PostgreSQL
- MySQL
- SQL Server
- Oracle
- MariaDB
- MapR MEP 8.00
- Apache Hive
- Spark
- Oracle Cloud (JDBC, ODBC and Oracle OCI drivers)
New SAP data sources:
- SAP BW 7.5 SP24+
- SAP BW/4HANA 2.0 SPS12+
- SAP HANA 2.0 SP06+
- SAP S/4HANA 1909 SP06+
- SAP S/4HANA 2020 SP04+
- SAP Sybase IQ 16.1 (JDBC and ODBC drivers)
New Single Sign-On authentication
- OAuth 2.0 for Google BigQuery
Oracle Public Synonyms
In Oracle databases, synonyms help administrators to create aliases for schema objects such as tables, views, materialized views, sequences, procedures and stored functions. Until now, public synonyms are not supported by Information Design Tool, only private synonyms can be read and used in Information Design Tool.
In SAP BI 4.3 SP3, public synonyms are also supported through Oracle OCI connections and you can use their contents (tables) in data foundations.
This support has not been extended to Oracle ODBC or JDBC connections.
In the oracle.sbo file located in the <INSTALLDIR>\connectionServer\oracle folder, a new line has been added:
<Parameter Name="Include Public Synonyms">False</Parameter>
By default, this flag is set to False and the public synonyms are not supported.
To support public synonyms:
- Modify this oracle.sbo file on the server or the client side, depending on the targeted Connection Server.
- Set both "Include Synonyms" and "Include Public Synonyms" parameters to True in the following lines:
<Parameter Name="Include Synonyms">True</Parameter>
<Parameter Name="Include Public Synonyms">True</Parameter>
When these flags are set, a new user PUBLIC folder containing the public synonyms is listed in the table browser.
You can add these tables to the data foundation. These tables have then an empty owner name.
Semantic Layer: Information Design Tool⤒
Active Directory Single Sign-On
If your BI Platform has been configured to authenticate against Active Directory, Information Design Tool can automatically retrieve the Windows session to log the user into the BI Platform repository (Request 138444).
When the login page opens, leave the User Name and Password text fields empty, set Active Directory in the Authentication drop-down menu and click OK.
Single Sign-On OAuth Token
For databases that supports Single Sign-On authentication through OAuth (Snowflake, Google BigQuery, ...), you can directly create the token for the authentication system from Information Design Tool.
When creating or editing the connection, click the Generate token button.
Prompt Hint
Prompt hints can also be defined in universes created in Information Design Tool:
- When editing a prompt object, you can add a text in the Prompt Hint text field.
- When defining a prompt using the @Pompt syntax, the hint can be added in the expression.

Prompt Object Definition
You can use HTML to format the hint when it is displayed in Web Intelligence. Only the following HTML tags are supported:
- <a href="">: Hyperlink
- <em>: Italic
- <strong>: Bold
- <u>: Underline
- <br>: Single line break
Other tags are not evaluated in Web Intelligence.
The Information Design Tool Query Panel can display these prompt hints, but it no does not support any HTML tag.

Prompt Hint in Information Design Tool
Multiple Joins
In Universe Design Tool, you can create several joins that link the same columns and convert them in Information Design Tool. But it was not yet possible to directly create them in Information Design Tool (Request 235856). In SAP BI 4.3 SP3, in the Data Foundation editor, you can create a join between two columns, even if a join between these two columns already exists.
You can create this join from the menu or in the data foundation schema by dragging a join from one column to another one. In both cases, the join condition is equal by default. If another join with the same equal condition already exists between the two columns, edit the condition of the new join to avoid two duplicate joins.
When several joins between the same two columns exist, they overlap in the graph of the Data Foundation or Aliases and Contexts editor. As it is difficult to identify and select a specific join, select it from the Joins list to make sure to select the correct one.
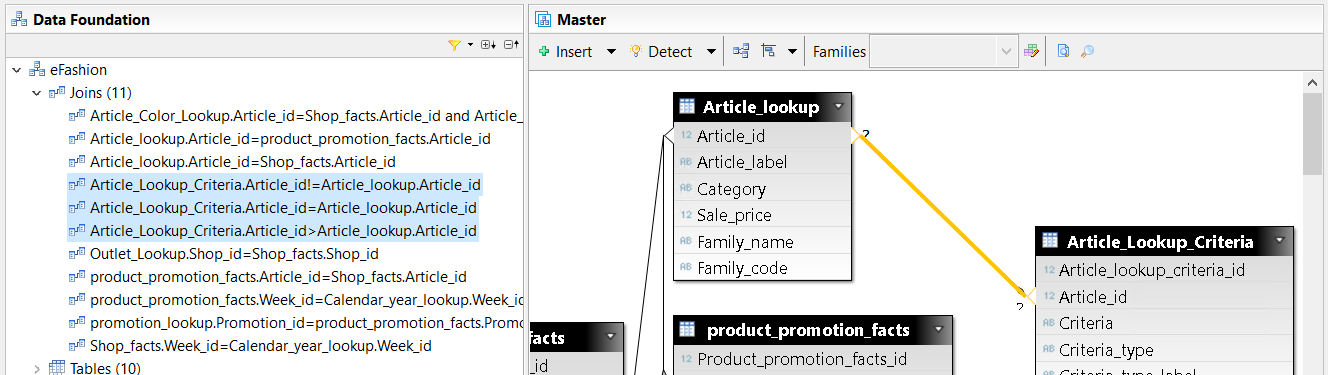
Multiple Joins Between Two Columns
Labels:
26 Comments
You must be a registered user to add a comment. If you've already registered, sign in. Otherwise, register and sign in.
Labels in this area
-
ABAP CDS Views - CDC (Change Data Capture)
2 -
AI
1 -
Analyze Workload Data
1 -
BTP
1 -
Business and IT Integration
2 -
Business application stu
1 -
Business Technology Platform
1 -
Business Trends
1,658 -
Business Trends
107 -
CAP
1 -
cf
1 -
Cloud Foundry
1 -
Confluent
1 -
Customer COE Basics and Fundamentals
1 -
Customer COE Latest and Greatest
3 -
Customer Data Browser app
1 -
Data Analysis Tool
1 -
data migration
1 -
data transfer
1 -
Datasphere
2 -
Event Information
1,400 -
Event Information
72 -
Expert
1 -
Expert Insights
177 -
Expert Insights
340 -
General
1 -
Google cloud
1 -
Google Next'24
1 -
GraphQL
1 -
Kafka
1 -
Life at SAP
780 -
Life at SAP
14 -
Migrate your Data App
1 -
MTA
1 -
Network Performance Analysis
1 -
NodeJS
1 -
PDF
1 -
POC
1 -
Product Updates
4,575 -
Product Updates
384 -
Replication Flow
1 -
REST API
1 -
RisewithSAP
1 -
SAP BTP
1 -
SAP BTP Cloud Foundry
1 -
SAP Cloud ALM
1 -
SAP Cloud Application Programming Model
1 -
SAP Datasphere
2 -
SAP S4HANA Cloud
1 -
SAP S4HANA Migration Cockpit
1 -
Technology Updates
6,872 -
Technology Updates
472 -
Workload Fluctuations
1
Related Content
- Architectural Insights into SAP NFT Management in Technology Blogs by SAP
- Understanding Data Modeling Tools in SAP in Technology Blogs by SAP
- SAP Datasphere + SAP S/4HANA: Your Guide to Seamless Data Integration in Technology Blogs by SAP
- Exploring Integration Options in SAP Datasphere with the focus on using SAP extractors - Part II in Technology Blogs by SAP
- Unify your process and task mining insights: How SAP UEM by Knoa integrates with SAP Signavio in Technology Blogs by SAP
Top kudoed authors
| User | Count |
|---|---|
| 17 | |
| 14 | |
| 12 | |
| 10 | |
| 9 | |
| 8 | |
| 7 | |
| 7 | |
| 6 | |
| 6 |