
- SAP Community
- Products and Technology
- Technology
- Technology Blogs by SAP
- SAP BTP Data & Analytics Showcase - Empower Data S...
Technology Blogs by SAP
Learn how to extend and personalize SAP applications. Follow the SAP technology blog for insights into SAP BTP, ABAP, SAP Analytics Cloud, SAP HANA, and more.
Turn on suggestions
Auto-suggest helps you quickly narrow down your search results by suggesting possible matches as you type.
Showing results for
Employee
Options
- Subscribe to RSS Feed
- Mark as New
- Mark as Read
- Bookmark
- Subscribe
- Printer Friendly Page
- Report Inappropriate Content
12-06-2021
8:28 AM
Introduction
This is the 4th of 5 blog posts which are part of the “SAP BTP Data & Analytics Showcase” series of blog posts. I recommend you to look into our overall blog post to gain a better understanding of the end-to-end scenario, which involves multiple SAP HANA Database & Analytics solutions in the cloud.
Nowadays, we experience and talk a lot about artificial intelligence, machine learning, predictive analytics, and data science in both our daily life and business. Experts like data scientists play an essential role in implement value-added data and analytics use cases for firms. However, data scientists are still facing some pain points, which hinder their ability to work effectively and derive business value from data in real-world environments. You can look into the blog post from one top data scientist expert by SAP and gain more insights from her perspective.
To demonstrate how our unified data and analytics solutions from SAP HANA Database & Analytics address a few pain points of data scientists and assist their daily work in an end-to-end way, with flexibility, motivates me to create this blog post.
In the upcoming sections of this blog post, I'd like to highlight how data scientists can choose solutions they want, combine capabilities from our portfolio and solve a specific problem end-to-end:
- Data Preparation - To close the gab between Data Scientists and IT, we recommend that data scientists could be involved early in the phase of data integration & preparation. One single place (SAP Data Warehouse Cloud) is offered to combine all necessary data from different sources, across the company's real IT landscape.
- Model Creation - Open source (e.g., Python or R) is an important pillar of data science projects. Data scientists can continue using Python script in Jupyter Notebook, where the connection to artefacts of SAP Data Warehouse Cloud has been established, and train ML models.
- Model Inference - The trained ML models are reused to make a prediction. The prediction results are easily written back to SAP Data Warehouse Cloud (via so-called Open SQL Schema), which can be consumed later to enhance your data models.
- Result Visualization - As a last step - to show findings/patterns behind data in a consumable way, e.g., to business users, a nice dashboard combining predictive results is created or enhanced via self-service tools in SAP Analytics Cloud.

Figure 1: End-to-End Data Science Scenario
Most of you have heard of the 80/20 dilemma: It roughly says that data scientists spend about 80 % of their time for generating and preparing data and only 20 % of their time for building and training models! We understand what matters most is NOT about algorithms. Therefore, we're intending to demonstrate how our unified solutions can assist data scientists in data preparation phase, with real-world data, and develop a data science project in an end-to-end way.
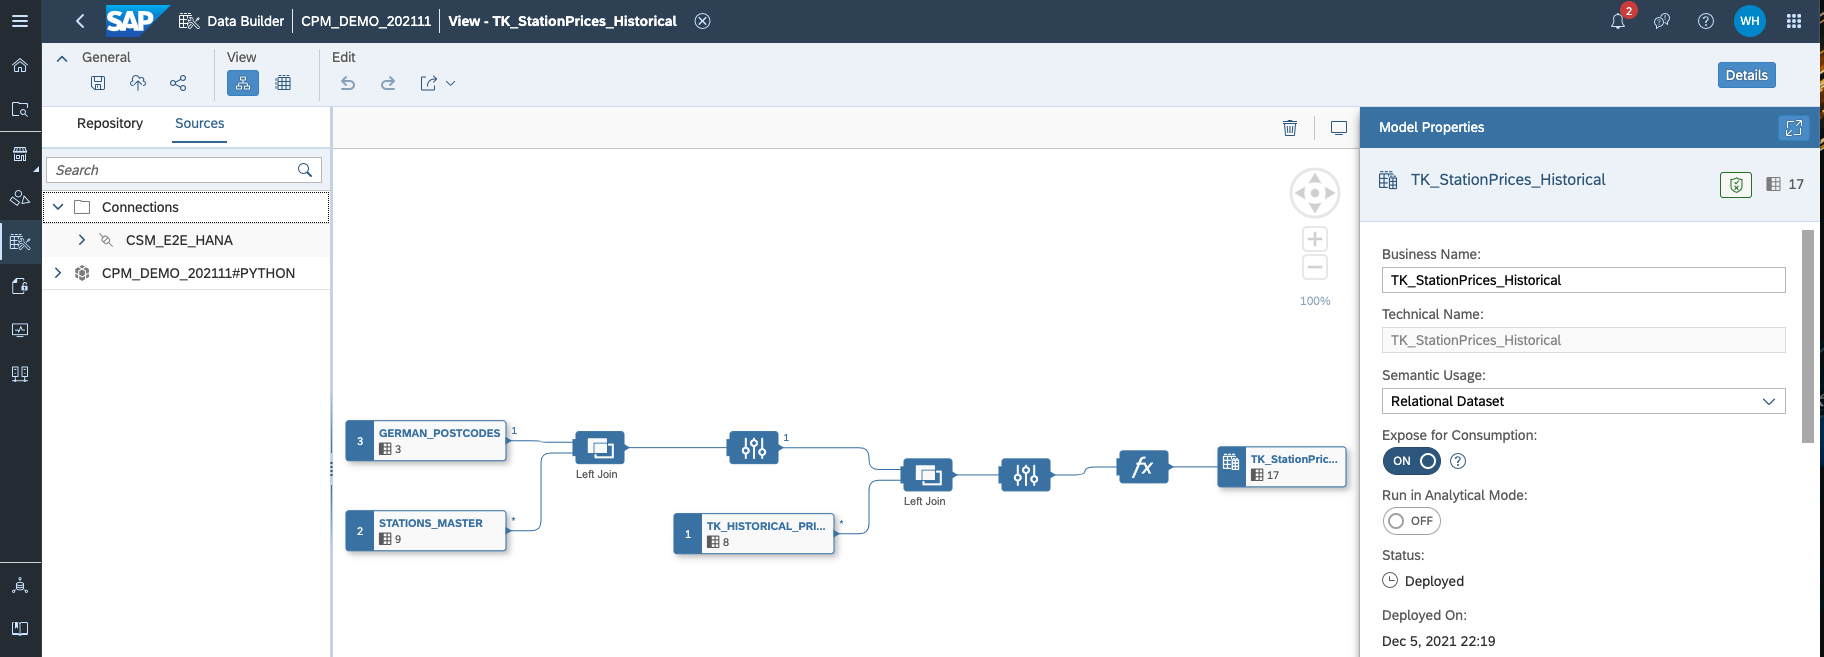
Figure 2: Data Preparation in SAP Data Warehouse Cloud

Figure 3: Model Creation & Inference via Python in Jupyter Notebook
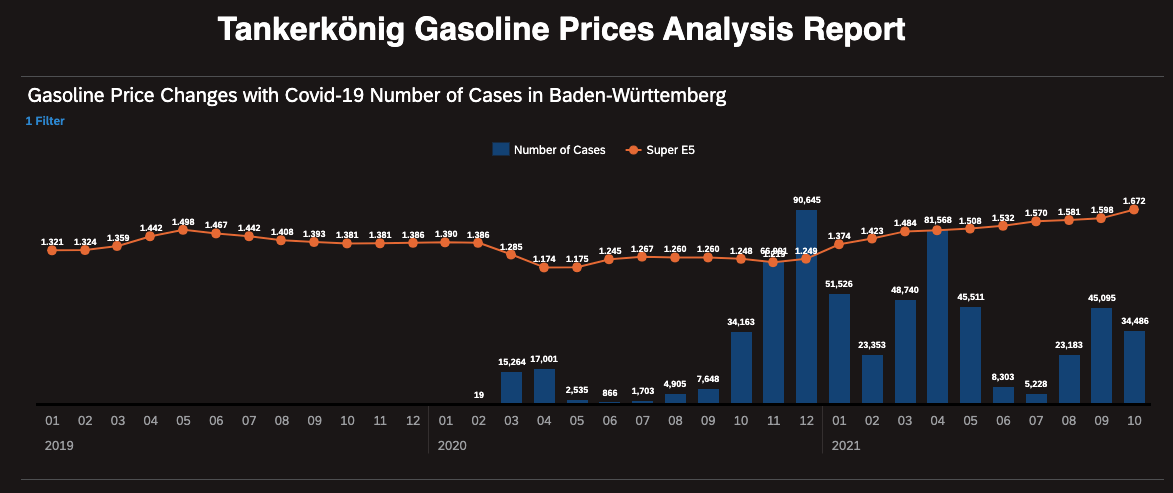
Figure 4: Data & Result Visualization in SAP Analytics Cloud
Key Scenario
This data science scenario is implemented base on our famous "Tankerkönig" data model. We utilise the historical gasoline prices data (2017-2021) in Germany from this public website, where prices data is stored in CSV files. We use the data in this website only for blog posting and demonstration purpose.
As you may be aware, the gasoline prices in Germany have been increased dramatically this year, compared to the same time periods of previous years. The pandemic of Covid-19 has changed the way business is operating today. In our scenario, we are intending to conduct the time series forecasting for the gasoline prices in Germany, by taking the factor - "Covid-19 Number of cases" - into consideration. We think this could help firms or individuals better plan to fuel vehicles, depending on predicted gasoline price trends. We get the information about Covid-19 cases from this public repository under RKI institute.
To solve the above-mentioned problem, the following three sub-scenarios are defined and implemented.

Figure 5: High-level solution map and implementation steps
Part 1: Data Preparation
- Utilise SQL-on-Files capability of SAP HANA Cloud to query files of the recent 5 years historical prices
- Integrate data from different sources in SAP Data Warehouse Cloud, using Federation or Replication capability
- Build harmonised views combining all necessary data via Self-Service Modelling features in SAP Data Warehouse Cloud
Part 2: Model Creation & Inference
- Enable HANA Cloud Script Server for Machine Learning and read-access all views of SAP Data Warehouse Cloud via Python Script
- Consume algorithms from HANA Python Client API - APL Library and create ML models for Multiple Time Series Forecasting
- Run the trained ML model to predict gasoline prices for the next 7 days
- Write predictive result directly back to SAP Data Warehouse Cloud via the so-called Open SQL Schema and enhance data models
Part 3: Result Visualization
- Create a Dashboard to show historical gasoline price changes (2017-2021) in SAP Analytics Cloud
- Analyse the correlation between gasoline prices and Covid-19 case numbers by leveraging Business Intelligence capability of SAP Analytics Cloud
- Enhance the dashboard with Prediction Results from ML models
Meanwhile, I share the following use cases of SAP Data Warehouse Cloud with you and hope this can give some insights and ideas how to leverage such capabilities in your individual data science scenario.

Figure 6: Use Cases of SAP Data Warehouse Cloud
Implementation
We have prepared the following sub-blog posts, which can explain implementation in more details.
- Blog 1 - Data Preparation for a Data Science Scenario in SAP Data Warehouse Cloud: How to prepare data in a typical data science scenario, taking advantages of different capabilities in SAP Data Warehouse Cloud, e.g., federation & replication, self-service modelling and seamless integration with SAP Analytics Cloud.
- Blog 2 - Machine Learning via Python in SAP Data Warehouse Cloud: how to use Python Script to access training data set from SAP Data Warehouse Cloud, create machine learning models, run prediction through ML models and write results back to SAP Data Warehouse Cloud (for modelling and visualisation purpose).
In the blog 1, we skipped the SQL-on-Files part and started directly with data preparation in SAP Data Warehouse Cloud. If you are interest how to query 5 years historical data, I recommend you to look into this blog post from my colleague Jacek, who describes the data management concept and SQL-on-Files very well in his blog post.
At the end of both blog posts, the visualisation part is shown via stories in SAP Analytics Cloud, as we have established the data models (views) by consuming prepared data and prediction in SAP Data Warehouse Cloud. However, the step-by-step guidelines for implementation in SAP Analytics Cloud are skipped, as we are aiming to share the end-to-end approach with you.
Conclusion
We hope this blog post could give you a comprehensive overview how unified data and analytics solutions from SAP HANA Database & Analytics area can facilitate data scientists with their daily work in an end-to-end way, with flexibility. Thank you for your time, and please stay tuned and curious about our upcoming blog posts!
At the very end, I would like to say thank you to my colleagues Yann Le Biannic, Antoine Chabert, Andreas Forster, Axel Meier and Jacket Klatt, who share their expertise and help make this end-to-end demo story happen!
We highly appreciate for all your feedbacks and comments! In case you have any questions, please do not hesitate to ask in the Q&A area as well.
- SAP Managed Tags:
- SAP Analytics Cloud,
- SAP Datasphere,
- SAP HANA Cloud,
- SAP Business Technology Platform
Labels:
3 Comments
You must be a registered user to add a comment. If you've already registered, sign in. Otherwise, register and sign in.
Labels in this area
-
ABAP CDS Views - CDC (Change Data Capture)
2 -
AI
1 -
Analyze Workload Data
1 -
BTP
1 -
Business and IT Integration
2 -
Business application stu
1 -
Business Technology Platform
1 -
Business Trends
1,658 -
Business Trends
112 -
CAP
1 -
cf
1 -
Cloud Foundry
1 -
Confluent
1 -
Customer COE Basics and Fundamentals
1 -
Customer COE Latest and Greatest
3 -
Customer Data Browser app
1 -
Data Analysis Tool
1 -
data migration
1 -
data transfer
1 -
Datasphere
2 -
Event Information
1,400 -
Event Information
76 -
Expert
1 -
Expert Insights
177 -
Expert Insights
348 -
General
1 -
Google cloud
1 -
Google Next'24
1 -
GraphQL
1 -
Kafka
1 -
Life at SAP
780 -
Life at SAP
14 -
Migrate your Data App
1 -
MTA
1 -
Network Performance Analysis
1 -
NodeJS
1 -
PDF
1 -
POC
1 -
Product Updates
4,575 -
Product Updates
392 -
Replication Flow
1 -
REST API
1 -
RisewithSAP
1 -
SAP BTP
1 -
SAP BTP Cloud Foundry
1 -
SAP Cloud ALM
1 -
SAP Cloud Application Programming Model
1 -
SAP Datasphere
2 -
SAP S4HANA Cloud
1 -
SAP S4HANA Migration Cockpit
1 -
Technology Updates
6,871 -
Technology Updates
486 -
Workload Fluctuations
1
Related Content
- Unleashing the Power of Custom Widgets in SAP Analytics Cloud in Technology Blogs by Members
- Exploring ML Explainability in SAP HANA PAL – Classification and Regression in Technology Blogs by SAP
- SAP BTP FAQs - Part 1 (General Topics in SAP BTP) in Technology Blogs by SAP
- DevOps with SAP BTP in Technology Blogs by SAP
- SAP Datasphere News in April in Technology Blogs by SAP
Top kudoed authors
| User | Count |
|---|---|
| 14 | |
| 11 | |
| 10 | |
| 10 | |
| 10 | |
| 8 | |
| 8 | |
| 7 | |
| 7 | |
| 6 |