- SAP Community
- Products and Technology
- Technology
- Technology Q&A
- SAPUI5 Odata V4 -> Intermittent 500 internal serve...
- Subscribe to RSS Feed
- Mark Question as New
- Mark Question as Read
- Bookmark
- Subscribe
- Printer Friendly Page
- Report Inappropriate Content
SAPUI5 Odata V4 -> Intermittent 500 internal server error when making request to CAP server
- Subscribe to RSS Feed
- Mark Question as New
- Mark Question as Read
- Bookmark
- Subscribe
- Printer Friendly Page
- Report Inappropriate Content
on 10-20-2022 2:15 AM
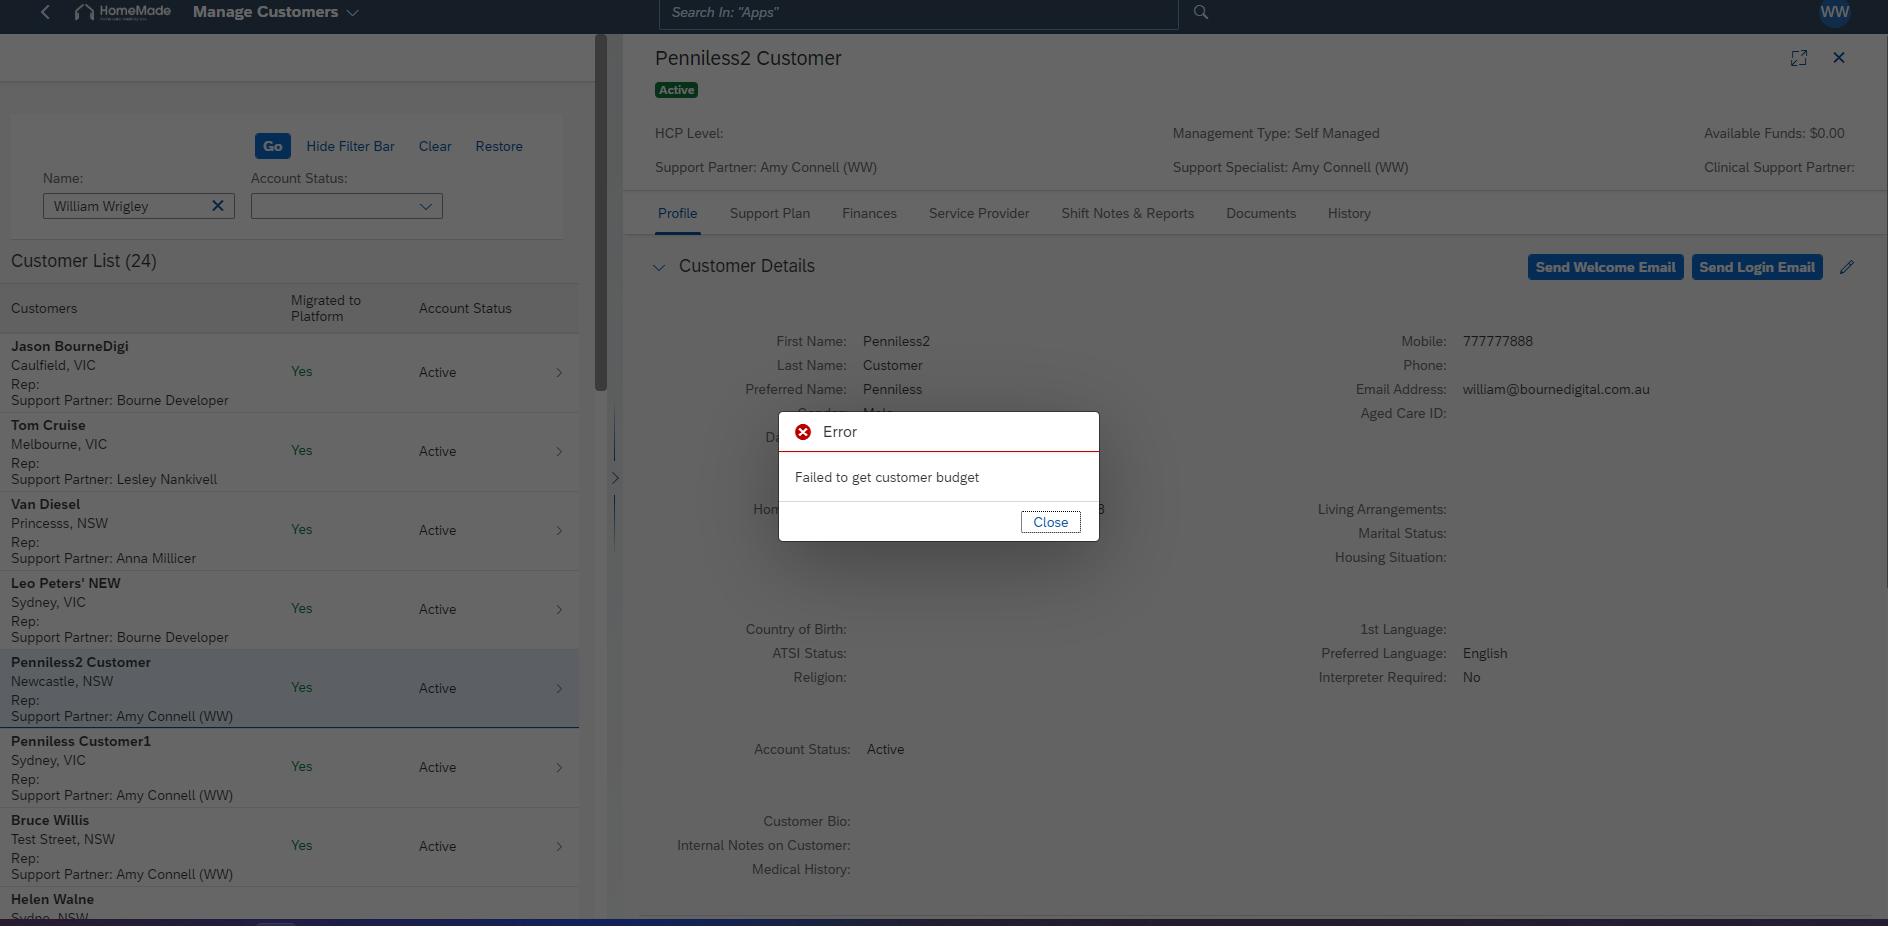
l am struggling with an intermittent issue where batch request from oData v4 service to CAP server is failing with 500 internal server error.
However is no error in the server logs.
It is happening in all our environments (DEV, TEST, PROD) It just return the error message attached. I also attached the calls which trigger the error. The app is a master detail app displaying customers, these batch calls are made upon opening a customer's profile.
Basically these calls will work perfectly then after opening up a few profiles one will error (its like 1 in 20 times). If it errors for a customer you can just refresh the app and the same profile will load up again. It seems to be completely random in that it doesn't seem to always happen for any particular customer


- SAP Managed Tags:
- SAP Cloud Application Programming Model,
- JavaScript,
- SAPUI5,
- SAP Business Technology Platform
- Mark as New
- Bookmark
- Subscribe
- Subscribe to RSS Feed
- Report Inappropriate Content
Have a look in the server logs in Kibana around the time the error happens. There will be a more detailed error message there.
I've seen issues like this when doing multiple batch calls with multiple writes into a CAP Server, some of the requests would fail randomly/intermittently. We fixed it by changing the DB connection pool settings in the package.json. Essentially having a longer timeouts between cap and the HANA db and a larger connection pool. Your problem may be the same. The error log will give you more details.
You must be a registered user to add a comment. If you've already registered, sign in. Otherwise, register and sign in.
- Mark as New
- Bookmark
- Subscribe
- Subscribe to RSS Feed
- Report Inappropriate Content
Hi Tiago, thank you for your response. I checked Kabana and could not find any error message there. Do you have an example of the error message you would see there?
Our scenario may be different for yours as you mention it is caused by multiple write requests - in our case the errors are being triggered by read requests only
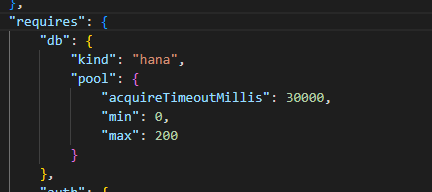
Below is our DB connection pool settings, can you please advise your settings and we can try them and see if it resolves the issue?
- Mark as New
- Bookmark
- Subscribe
- Subscribe to RSS Feed
- Report Inappropriate Content
The settings are documented here: https://cap.cloud.sap/docs/node.js/databases?q=acquireTimeout#pool
You can play around with increasing the acquireTimeoutMillis and the max setting. Or bringing more obscure settings described above in the docs.
What you have above says up to 200 connections and a max wait time of 30s. If you have lots of connections it may happen that (some) have to wait more than 30s and so from the CAP perspective, the Database operation would fail.
I would try doubling or tripling that acquireTimeoutMillis and seeing if it helps at all.
On kibana if it is inadequate pool settings you see an error like a "connection timeout", I don't know exact wording. You also see the HTTP 500 error that CAP then sends to the requester.
- Mark as New
- Bookmark
- Subscribe
- Subscribe to RSS Feed
- Report Inappropriate Content

- Mark as New
- Bookmark
- Subscribe
- Subscribe to RSS Feed
- Report Inappropriate Content
- DYNAMIC SEARCH help F4IF_INT_TABLE_VALUE_REQUEST not showing all the values from internal table in Technology Q&A
- SAP BTP FAQs - Part 3 (Security) in Technology Blogs by SAP
- Calling Fragment Form & Send it as an attachment using ABAP Walk-Through in Technology Blogs by Members
- First steps to work with SAP Cloud ALM Deployment scenario for SAP ABAP systems (7.40 or higher) in Technology Blogs by SAP
- Unveiling SAP Analytics Cloud Performance Analysis Insights for Optimal Performance in Technology Blogs by Members
| User | Count |
|---|---|
| 72 | |
| 9 | |
| 8 | |
| 6 | |
| 6 | |
| 6 | |
| 6 | |
| 5 | |
| 5 | |
| 4 |
You must be a registered user to add a comment. If you've already registered, sign in. Otherwise, register and sign in.