- SAP Community
- Products and Technology
- Technology
- Technology Q&A
- Show a row of subtotals for Currency Key field
- Subscribe to RSS Feed
- Mark Question as New
- Mark Question as Read
- Bookmark
- Subscribe
- Printer Friendly Page
- Report Inappropriate Content
Show a row of subtotals for Currency Key field
- Subscribe to RSS Feed
- Mark Question as New
- Mark Question as Read
- Bookmark
- Subscribe
- Printer Friendly Page
- Report Inappropriate Content
on 01-05-2023 9:22 AM
Hi,
I have a table widget used in SAC analytics application.
Currency Key column is needed to be placed on the left hand side of Amount in Transaction Currency column, as seen in the screen picture that is given below.
It is desired to show subtotals at the change of each Currency Key value.
Somehow features like Add Row, Add Calculation, Show Totals (on Currency Key dimension from builder panel) does not seem to work as desired in this case.
Appreciate your inputs please!
Note: HANA Live connection is leveraged to create the analytic data model for this application (if that matters).

- SAP Managed Tags:
- SAP Analytics Cloud
Accepted Solutions (0)
Answers (1)
Answers (1)
- Mark as New
- Bookmark
- Subscribe
- Subscribe to RSS Feed
- Report Inappropriate Content
As you said, features like Add Row, Add Calculation, and Functions are not working, I would advise you to use the Grid Page if possible.
On the grid page, first, insert a table consisting of your desired fields, then filter it by the 'Currency Key' = 'CAD'. After filtering the table will only show the values for CAD. After that, use the SUM formula to find the subtotal for CAD.
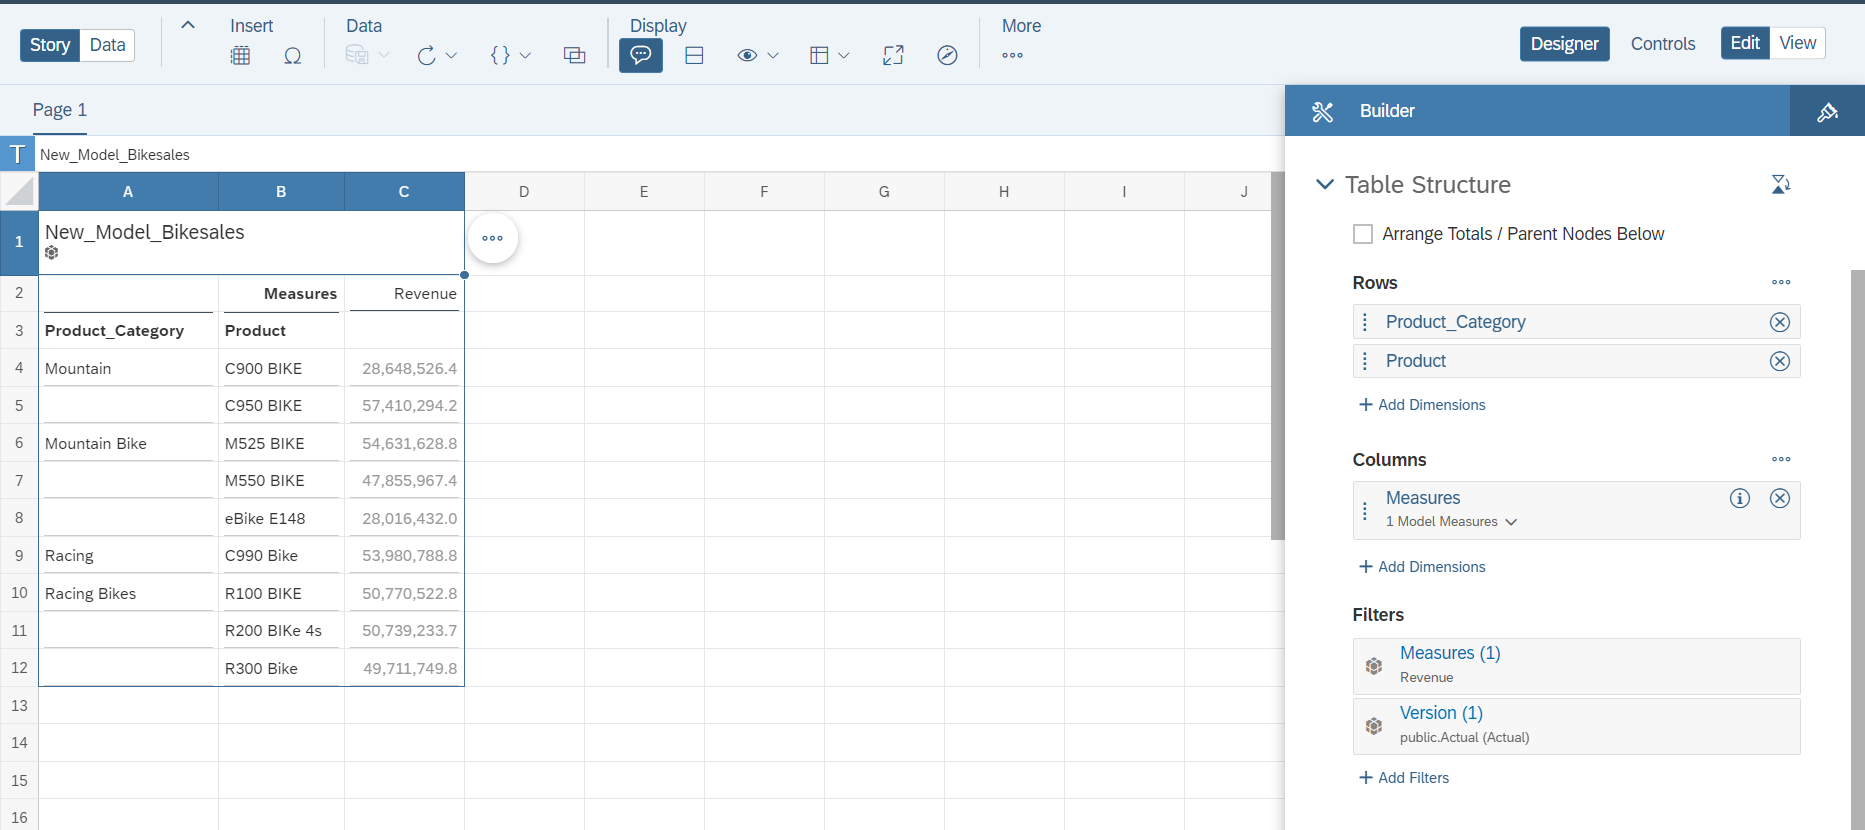
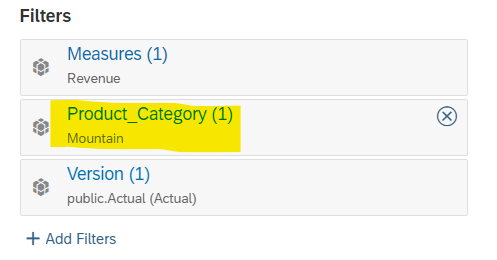
For example, here I inserted a table on the grid page and used 'Product_Category' and 'Product' as the rows and Revenue as the Measure. I want to create sub-totals by the Product_Category. Therefore, I apply a Filter on the Product_Category by the value Mountain.

Here, we can see the table gets filtered by Product_Category 'Mountain', and then on the A6 cell, we can enter a text called 'Sub-Total' and on the C6 cell, we use the SUM formula, to find the value of the sub-total.
Again, after that, we insert another table and use the same model and fields on the table. After that, we filter the Product_Category by Mountain Bike and get something like this.

As we can see, the name of the model and the filters applied are visible on the Heading of the table, so we need to disable the Table Title, Subtitle, etc, from the Show/Hide options of the table, which will result in this.

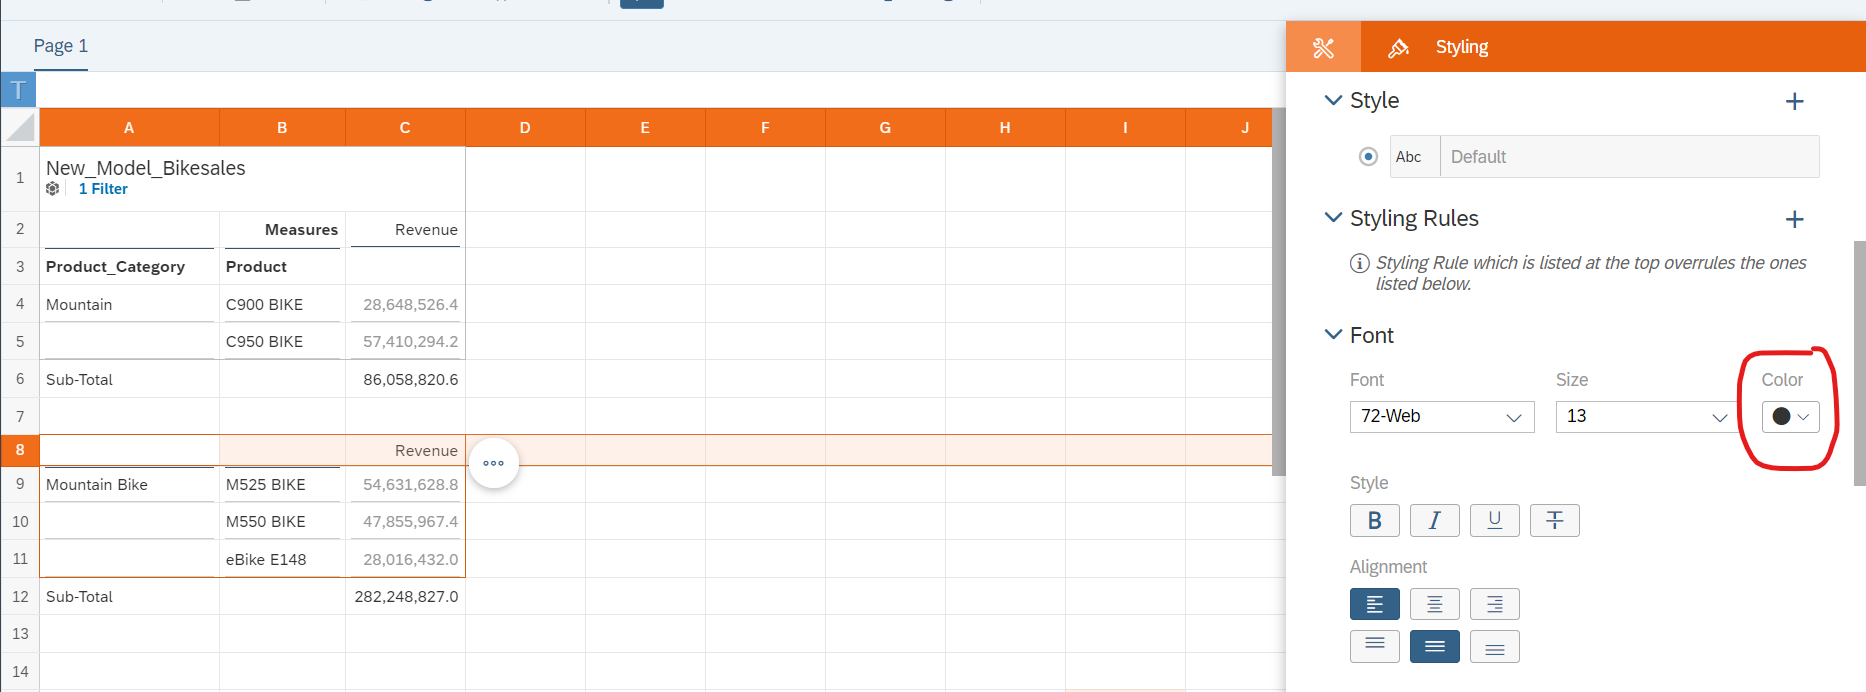
But, to make all the tables look like they are a part of the same table, we need to make the name of the measure (Revenue) invisible, which can be done in the 'Styling' panel of the table.
We first need to select the row which contains Revenue, and then change the 'font color' to White or the background of the Table.
After that delete the above row of the Measure.
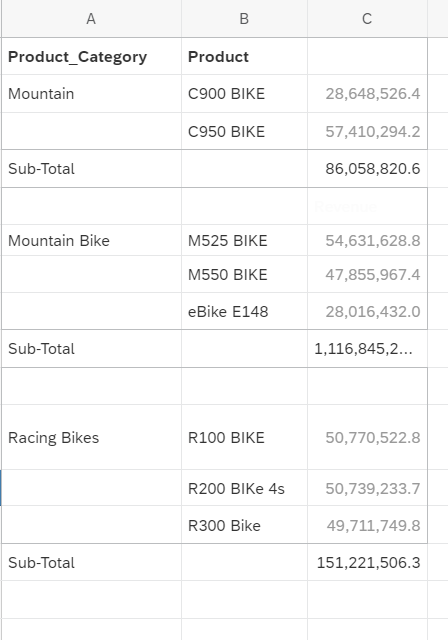
After, repeating this process with all the Tables, we get something like this.
If this answer helps you, please give it an upvote.
You must be a registered user to add a comment. If you've already registered, sign in. Otherwise, register and sign in.
- Mark as New
- Bookmark
- Subscribe
- Subscribe to RSS Feed
- Report Inappropriate Content
- How to Customize SAC UI Themes: A Basic Guide in Technology Blogs by SAP
- ABAP RAP - Managed scenario - Create Supplier invoice by Action using EML and I_SUPPLIERINVOICETP in Technology Q&A
- CDS View: Hierarchy node sign reversal in Technology Blogs by SAP
- How to do the total or sub total in RAP custom query in Technology Q&A
- Beginner's Guide to Integration Advisor in Technology Blogs by Members
| User | Count |
|---|---|
| 80 | |
| 9 | |
| 9 | |
| 7 | |
| 7 | |
| 6 | |
| 6 | |
| 6 | |
| 5 | |
| 4 |
You must be a registered user to add a comment. If you've already registered, sign in. Otherwise, register and sign in.