- SAP Community
- Groups
- Interest Groups
- Application Development
- Discussions
- Reusable technique/pattern for Monthly/Weekly CDS ...
- Subscribe to RSS Feed
- Mark Topic as New
- Mark Topic as Read
- Float this Topic for Current User
- Bookmark
- Subscribe
- Mute
- Printer Friendly Page
Reusable technique/pattern for Monthly/Weekly CDS calculations for graphing/date range purposes
- Mark as New
- Bookmark
- Subscribe
- Mute
- Subscribe to RSS Feed
- Permalink
- Report Inappropriate Content
10-25-2022 6:27 AM
I find myself needing to product a number of analytical cards for an overview page which shows a rolling real-time full year KPI calculation, but below that, shows a historic view of the same calculation taken at the end of each previous month (simple mock-up of what I'm talking about below).
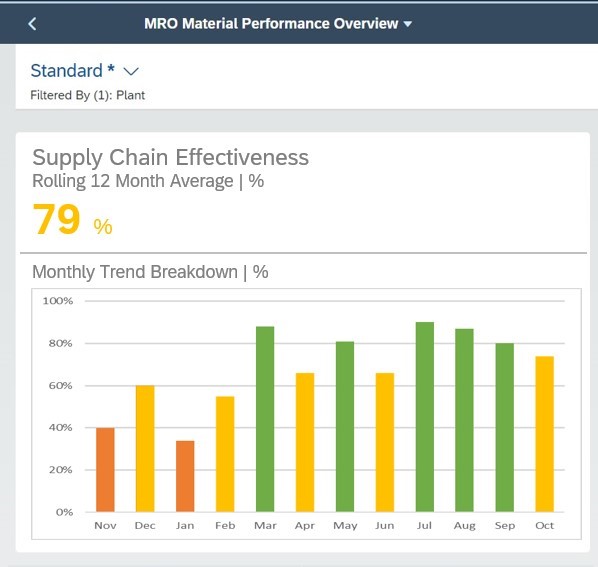
e.g. Today is the 25th of October so:
Main KPI calculation date range is:
- 26th of October, 2021 to 25th of October, 2022
And the graph is made of 12 separate date ranges going from latest to oldest like so:
- 1st of October, 2021 to 30th of September, 2022
- 1st of September, 2021 to 31st of August, 2022,
- etc.
So let's say the Main KPI calculation CDS is called ZI_SupplyChainEffectiveness. I'm assuming the only way to make this dynamic for use in other CDS definitions is to use a parameter.
A couple of options come to mind:
a) Provide a CalculationDate parameter which is used via a dedicated CDS view like ZI_CalculatePast12MonthsDateRange to use as the initial select so we can inner join to the resultant start and end date and get our KPI result
b) Provide a MonthOffset parameter which is used via a dedicated CDS view like ZI_CalculatePast12MonthsDateRangeOffset to use as the initial select so we can inner join to the resultant start and end date and get our KPI result
The advantage of the 2nd solution is that I can use hard coded values to get the last 12 months so I'm leaning towards that approach.
e.g. ZI_SupplyChainEffectiveness(0) could return the Main KPI Calculation
And I could get the graph by doing:
ZI_SupplyChainEffectiveness(-1) union all ZI_SupplyChainEffectiveness(-2) union all ZI_SupplyChainEffectiveness(3)...etc.
I don't love the union all's so one slight change to the 2nd approach is to remove the MonthOffset and just have it return all 12 ranges and current date range in one go with a property called ReportingDateMonthOffset. The super added bonus here is I don't need a parameter anymore so I'm liking the sound of this.
This way we just filter what is required - Main KPI just looks at ReportingDateMonthOffset 0, while Graph looks at ReportingDateMonthOffset < 0.
Note - For some cards, I'll be showing the weekly calculations for the last 8 weeks so I assume I'll need to do a similar approach for that with a CDS view like ZI_CalcuationPastWeekDateRangeOffset.
In terms of other solutions, maybe Table Functions or AMDP could be more useful but I tend to avoid those since it complicates the readability in my opinion and the HANA query engine gets less of a chance to optimise it.
Any thoughts on this approach, or if there is a better (preferably standard) way to do this?
Thanks,
Matt
- SAP Managed Tags:
- ABAP Development
- Mark as New
- Bookmark
- Subscribe
- Mute
- Subscribe to RSS Feed
- Permalink
- Report Inappropriate Content
10-25-2022 7:17 AM
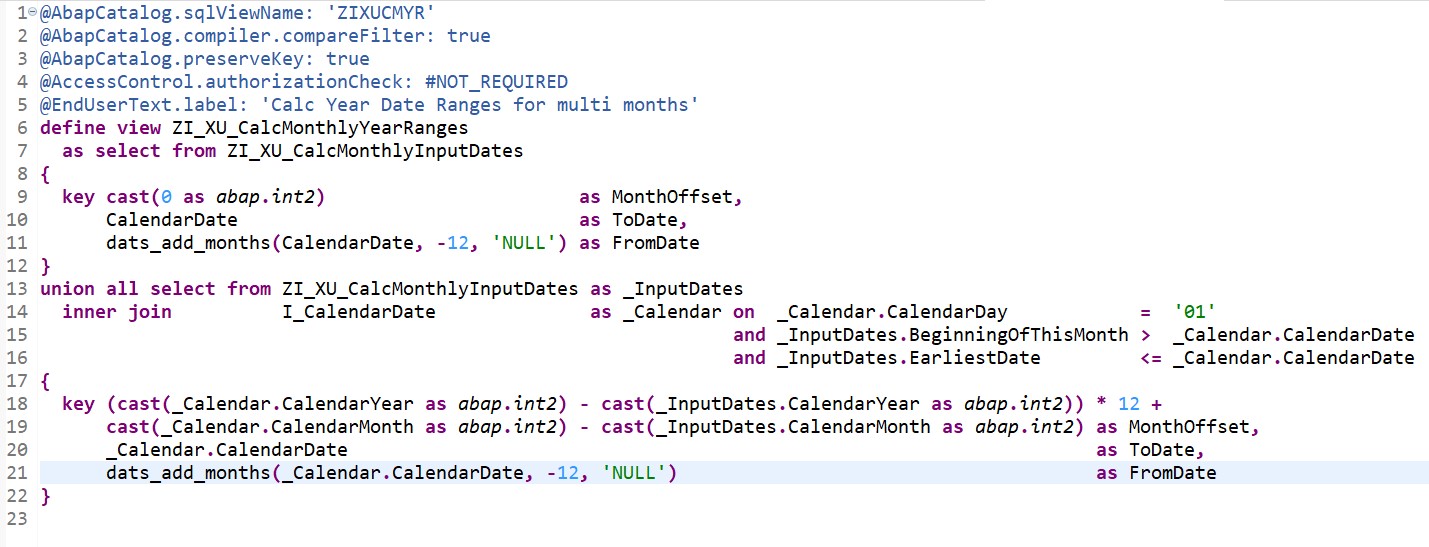
Here's the underlying reusable date ranges that I can leverage (didn't bother with getting end of month as figured it's easier to do less than in logic when joining):

- SAP Managed Tags:
- ABAP Development