
- SAP Community
- Products and Technology
- Enterprise Resource Planning
- ERP Blogs by SAP
- Monitoring an MDI Integration with SAP Cloud ALM
Enterprise Resource Planning Blogs by SAP
Get insights and updates about cloud ERP and RISE with SAP, SAP S/4HANA and SAP S/4HANA Cloud, and more enterprise management capabilities with SAP blog posts.
Turn on suggestions
Auto-suggest helps you quickly narrow down your search results by suggesting possible matches as you type.
Showing results for
Former Member
Options
- Subscribe to RSS Feed
- Mark as New
- Mark as Read
- Bookmark
- Subscribe
- Printer Friendly Page
- Report Inappropriate Content
12-28-2023
11:35 AM
Introduction
In the ever-evolving world of SaaS, the spotlight is shifting from a single monolithic solution to an integrated suite of applications. This shift, however, introduces complexities, stemming from a multitude of landscape variations and an increased number of integrations. A key driver in enabling such a modular architecture is the introduction of ‘SAP Master Data Integration (MDI)’ as a central replication layer, between all your SAP and non-SAP applications.
In my role as Product Manager for SAP S/4HANA Cloud Public Edition contributing to the ‘Hire-to-Retire’ workstream I and many other colleagues have supported an Early Adopter Care program to introduce MDI for the integration between SAP S/4HANA Cloud Public Edition and SAP SuccessFactors Employee Central. Some of the feedback was with regards to documentation being scattered across the various applications. Hence as a first step we have started to consolidate the various implementation guides in a central document on the SAP help portal, called ‘Master Data Integration – Cross Product Guide’.
Having the implementation part covered, the operations part needs to follow as well, and is currently being designed. Until the official guide can be published, I plan to publish a set of 3 blogs for the monitoring aspects. For the sake of simplicity, I will focus on Workforce Person and Cost Center integration between SAP S/4HANA Cloud Public Edition and SAP SuccessFactors Employee Central only. Hopefully you can adapt the processes described here to other applications and/or objects.
In this first blog, I will focus on how the monitoring within CALM works, giving in detail instructions for all the relevant steps. In subsequent blogs I plan to describe:
- How to define the Business Services in CALM for specific scenario, that will allow you to access the information in an easier fashion.
- How to use the local monitoring tools in SAP S/4HANA Cloud Public Edition and SAP SuccessFactors Employee Central.
- Give some insights into frequent issues and error messages.
Please leave comments if you have additional ideas or questions that you would like me to answer in one of these blogs.
Handling of SAP Cloud ALM for operations
Setup of CALM
I will not go into details here, and rather point to the official documentation on the SAP Cloud ALM for Operations Expert Portal; for our purposes the following guides are relevant: S4HC, SFSF and MDI, which are all part of said page.
Monitoring in CALM (exemplified by Workforce Person)
CALM comes with very extensive in-app-help capabilities, and I urge you to check it frequently, by clicking the question mark in the top right corner!
But now for the step-by-step description and guidance:
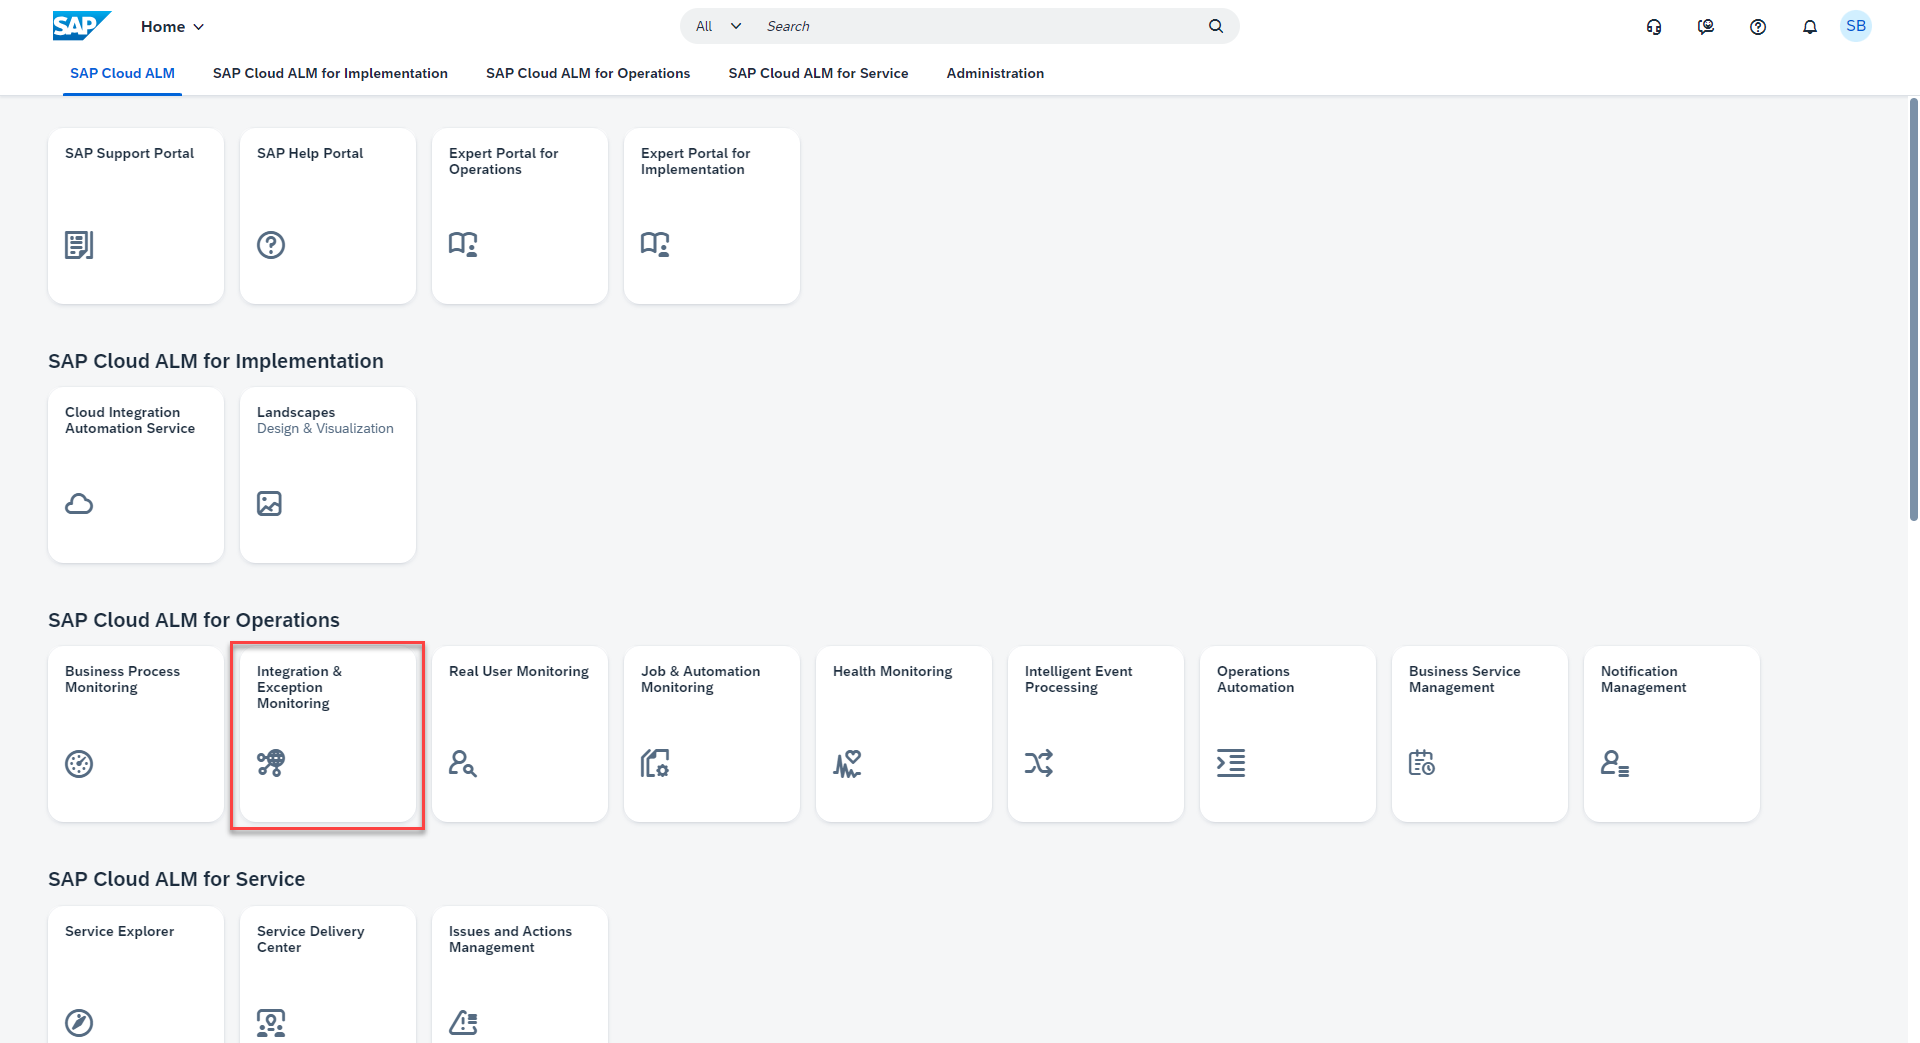
- Go to your SAP Cloud ALM launchpad and select “Integration and Exception Monitoring”
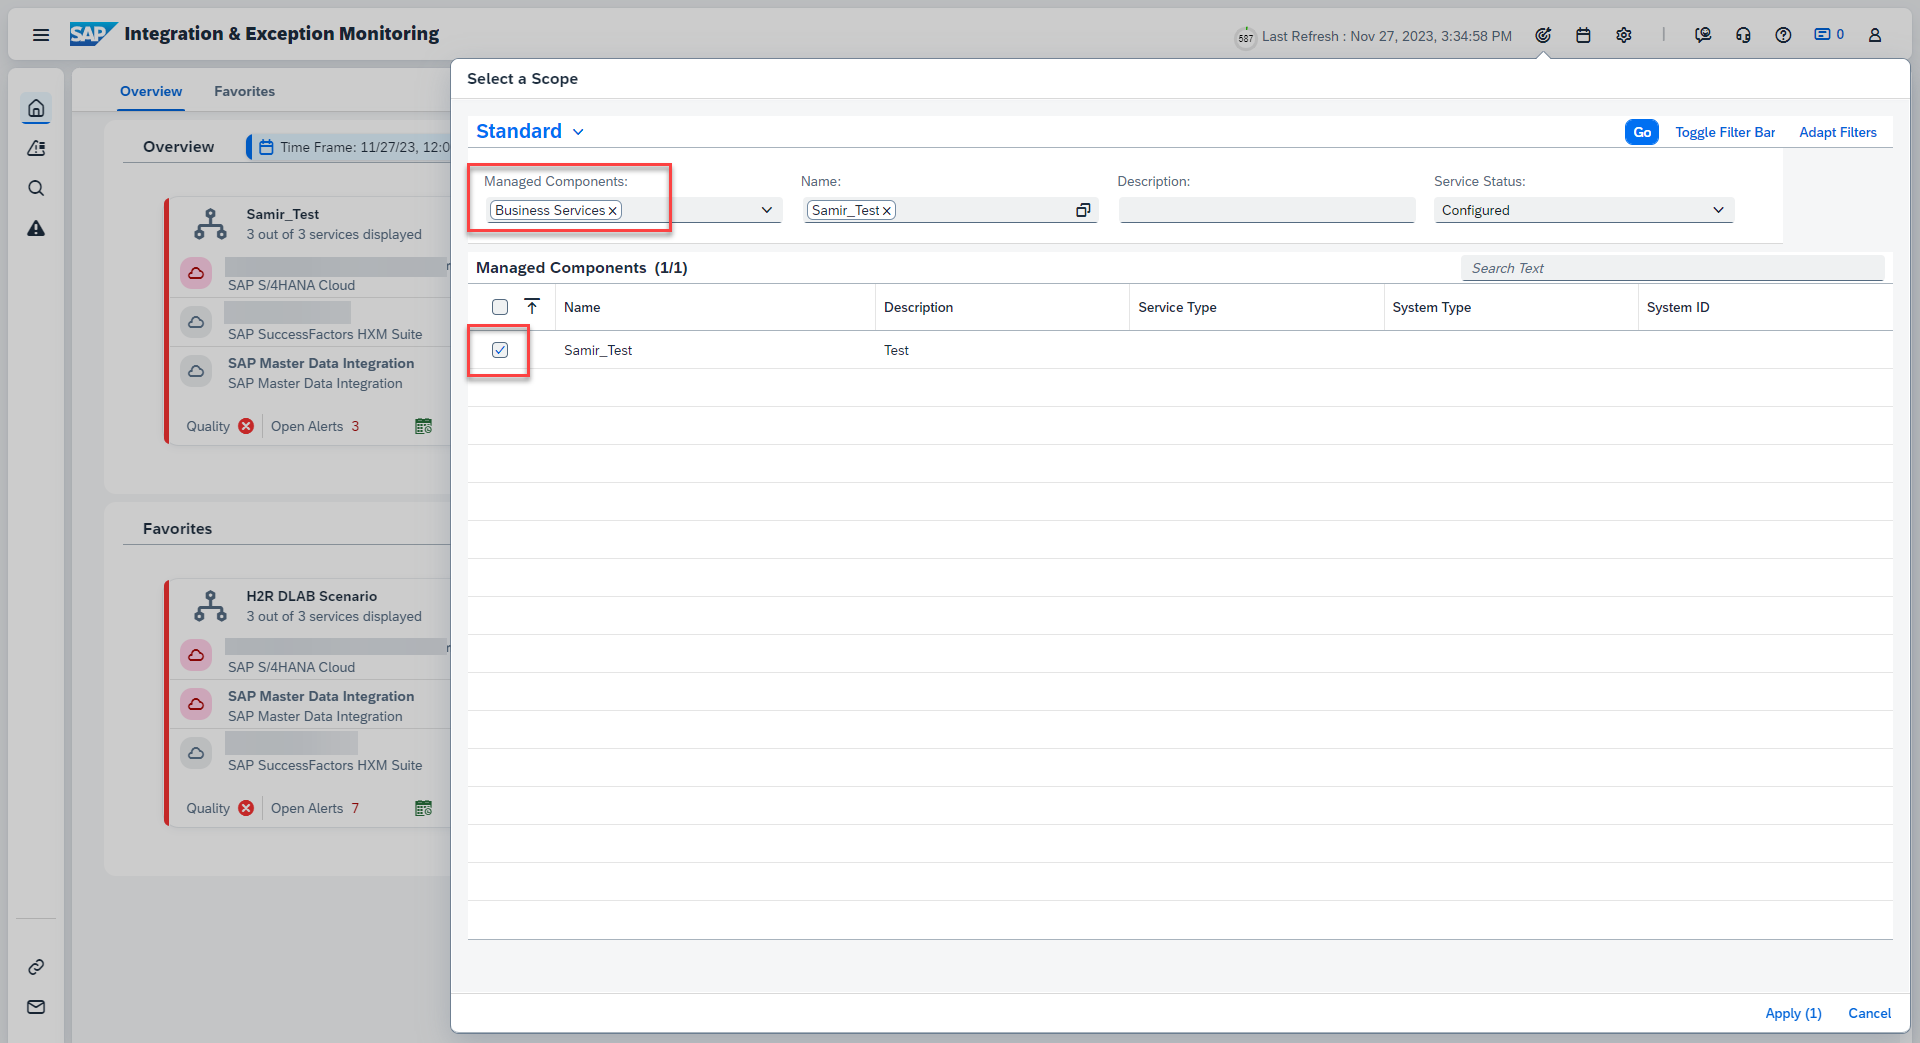
- The ‘Integration and Exception Monitoring” opens in a new tab. Go to “Select a Scope” (Arrow hitting a target in the top right or via the information tab).

- Select the desired component; narrow down the list by using appropriate filters.
Services represent connected Cloud applications, Systems are connected onPremise applications, and finally Business Services are scenarios you can define based on connected Services and systems; we will cover Business Service creation later in in this guide. Continuing we will work with Business Services as these cover Services and Systems implicitly as well
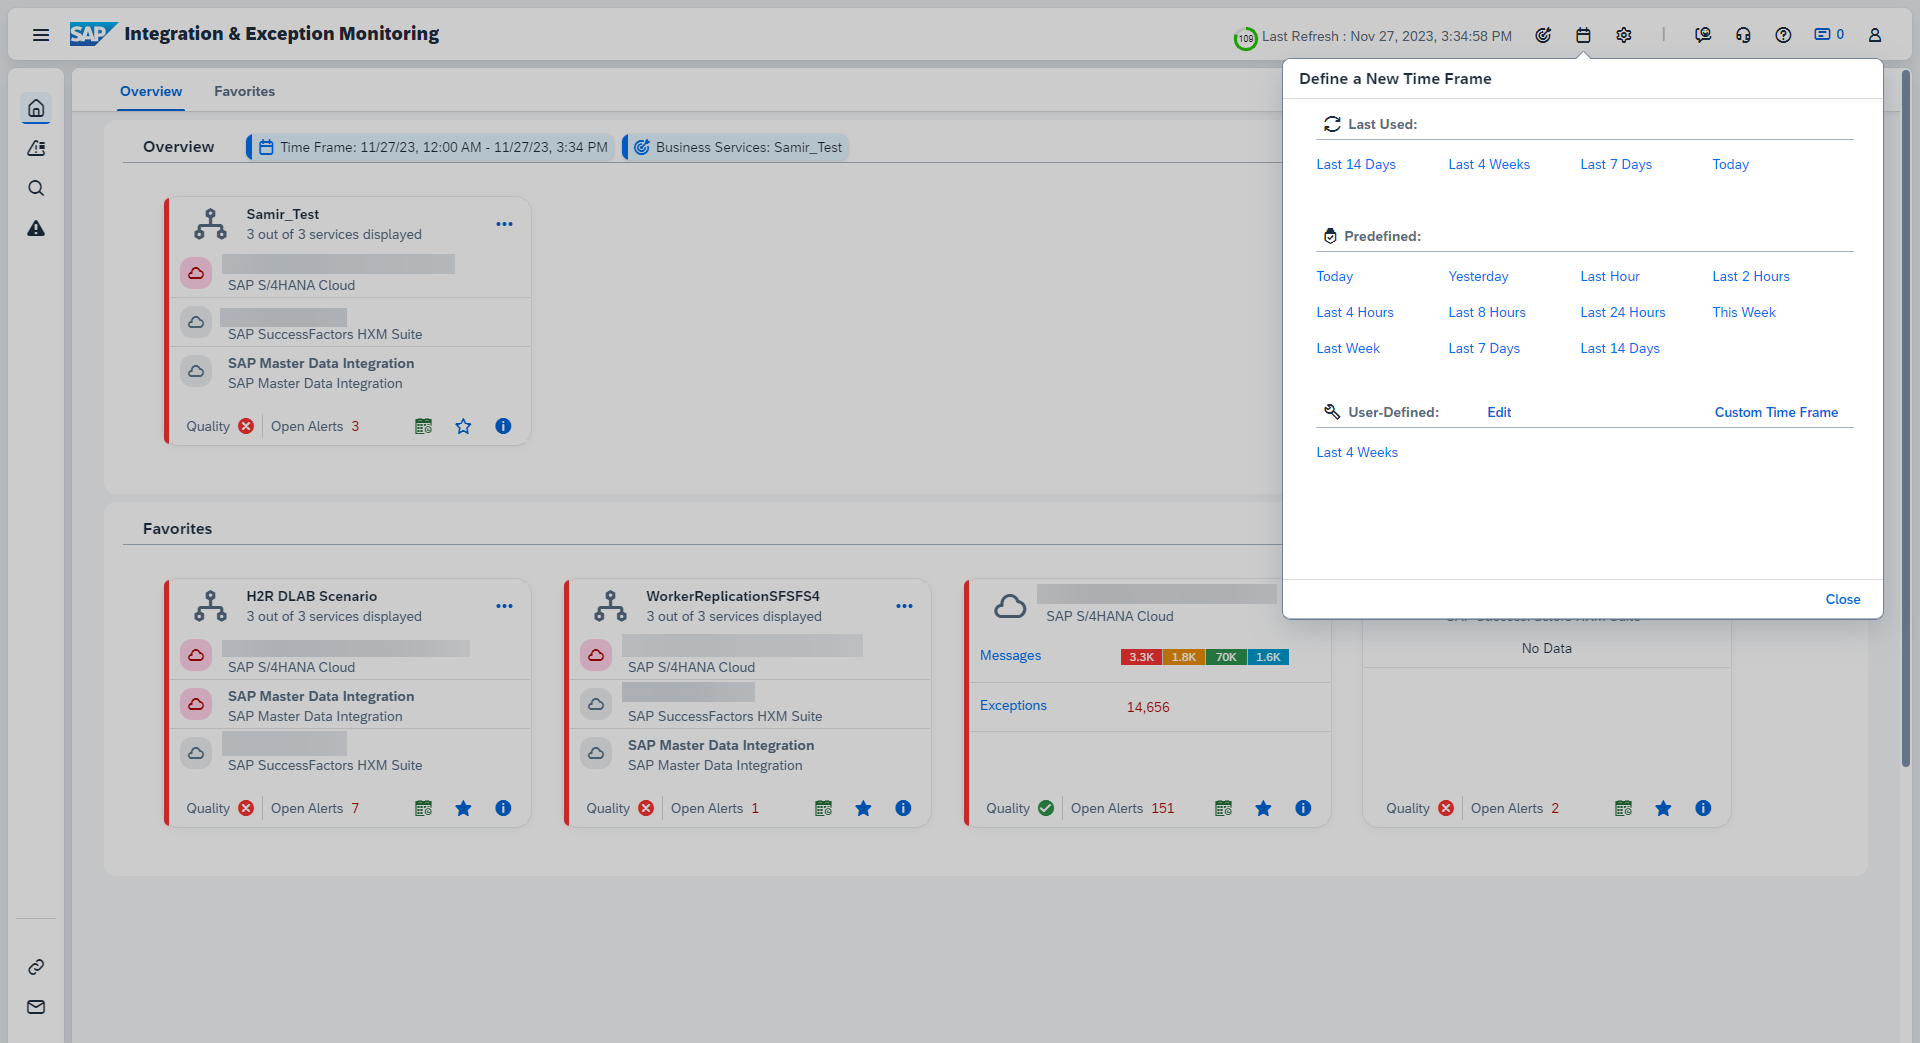
- Open the time frame selection (calendar icon in the top right or via the information tab)

- Choose the desired time frame.
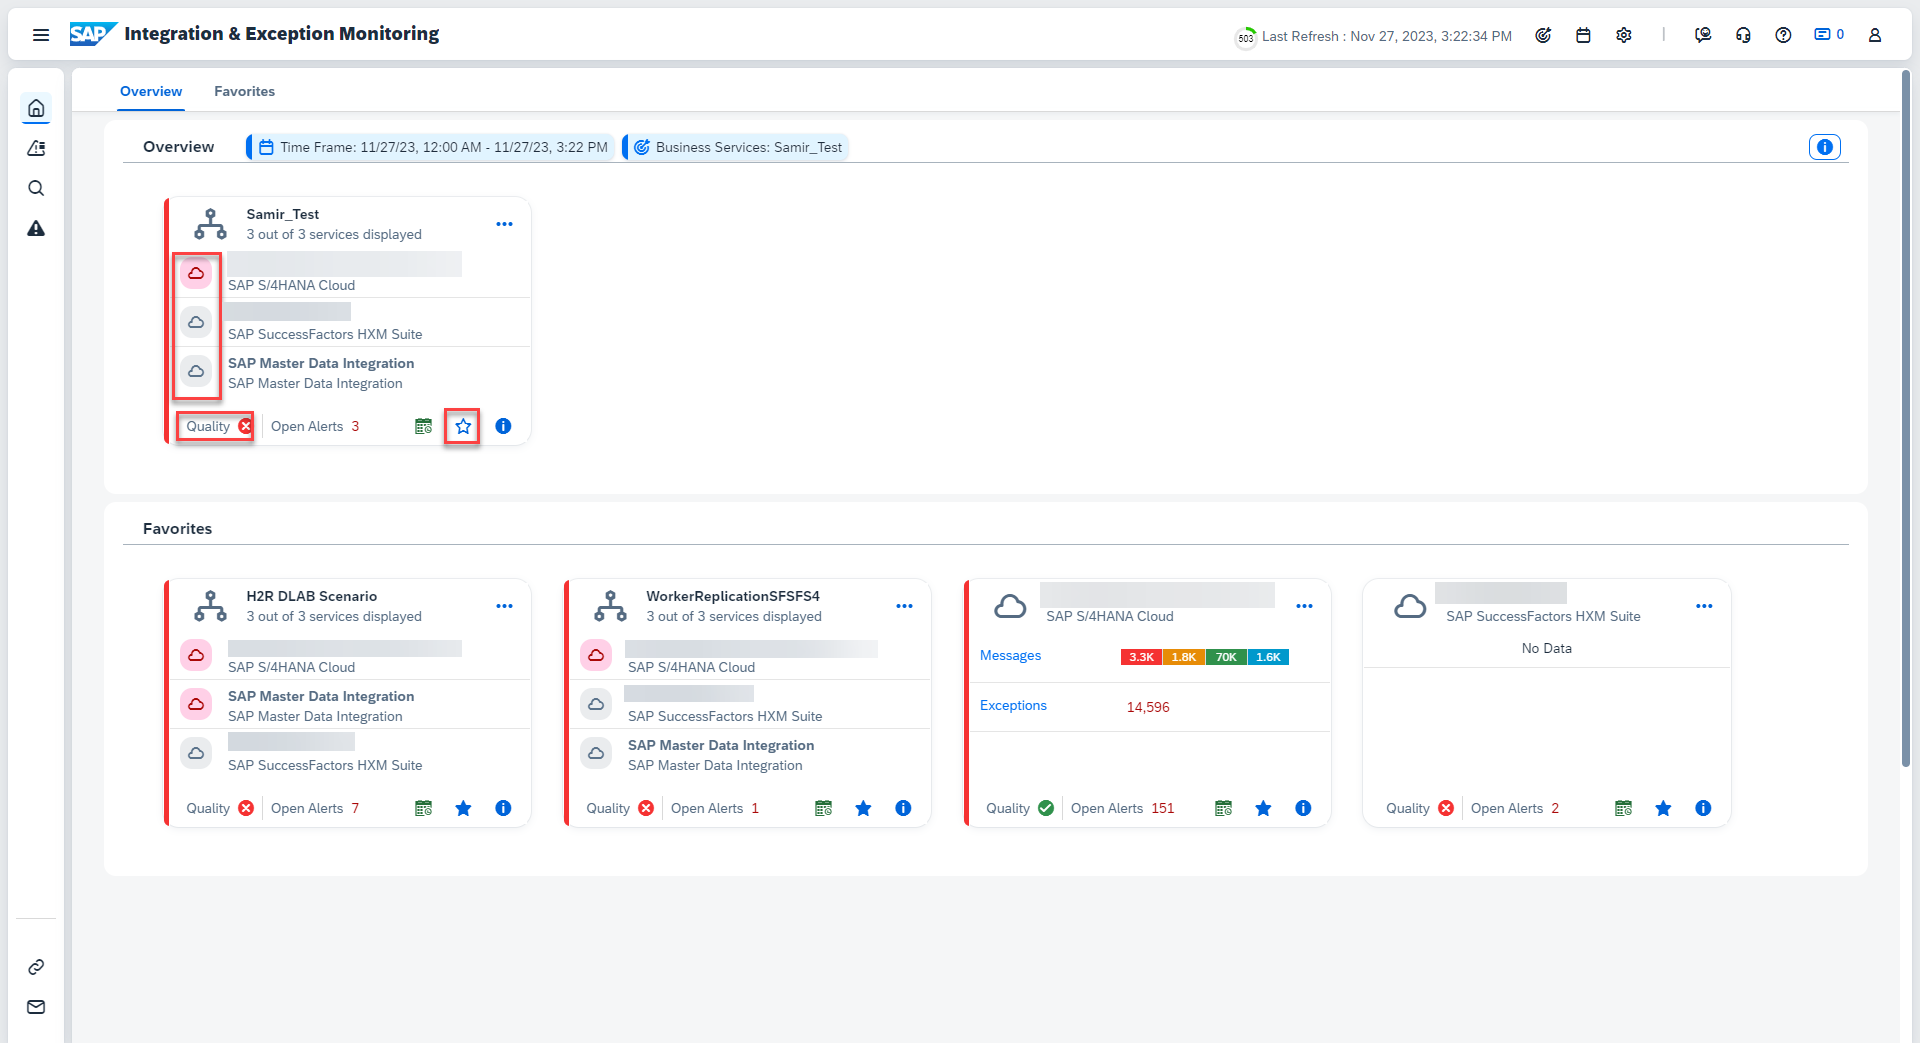
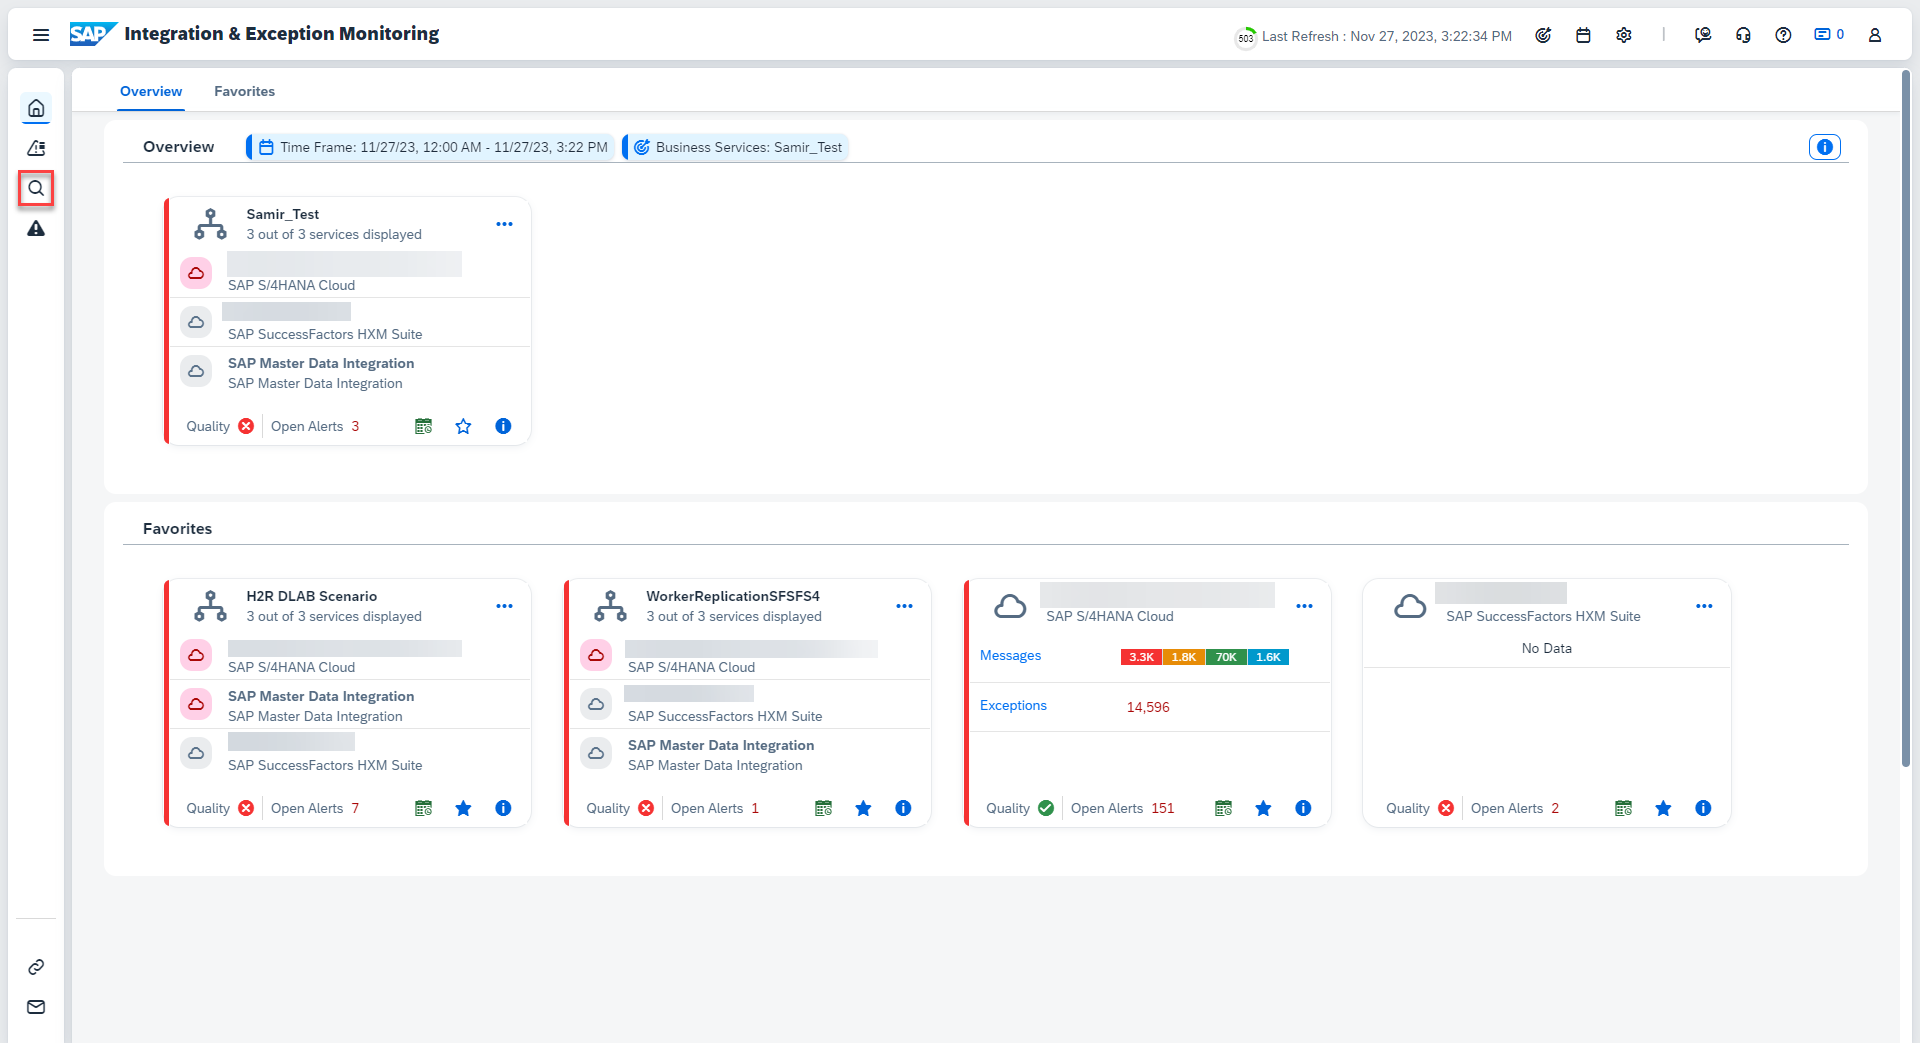
- Once a component is chosen, you’ll get a quick overview. From this page you can now
- Get information on the data quality in CALM.
- Favor the Business Service for quick access (star icon).
- Quickly get an understanding of the existence of errors per application, based on color codes.
Scenario 1 – proactive error detection
This scenario applies when you want to check the status of your landscape without a concrete issue at hand. You can then check each individual applications for erroneous messages and correct the data before anyone even notices. Intuitive color coding gives a great indication as to what is working and what isn’t.
- From your Business Service go to the details page
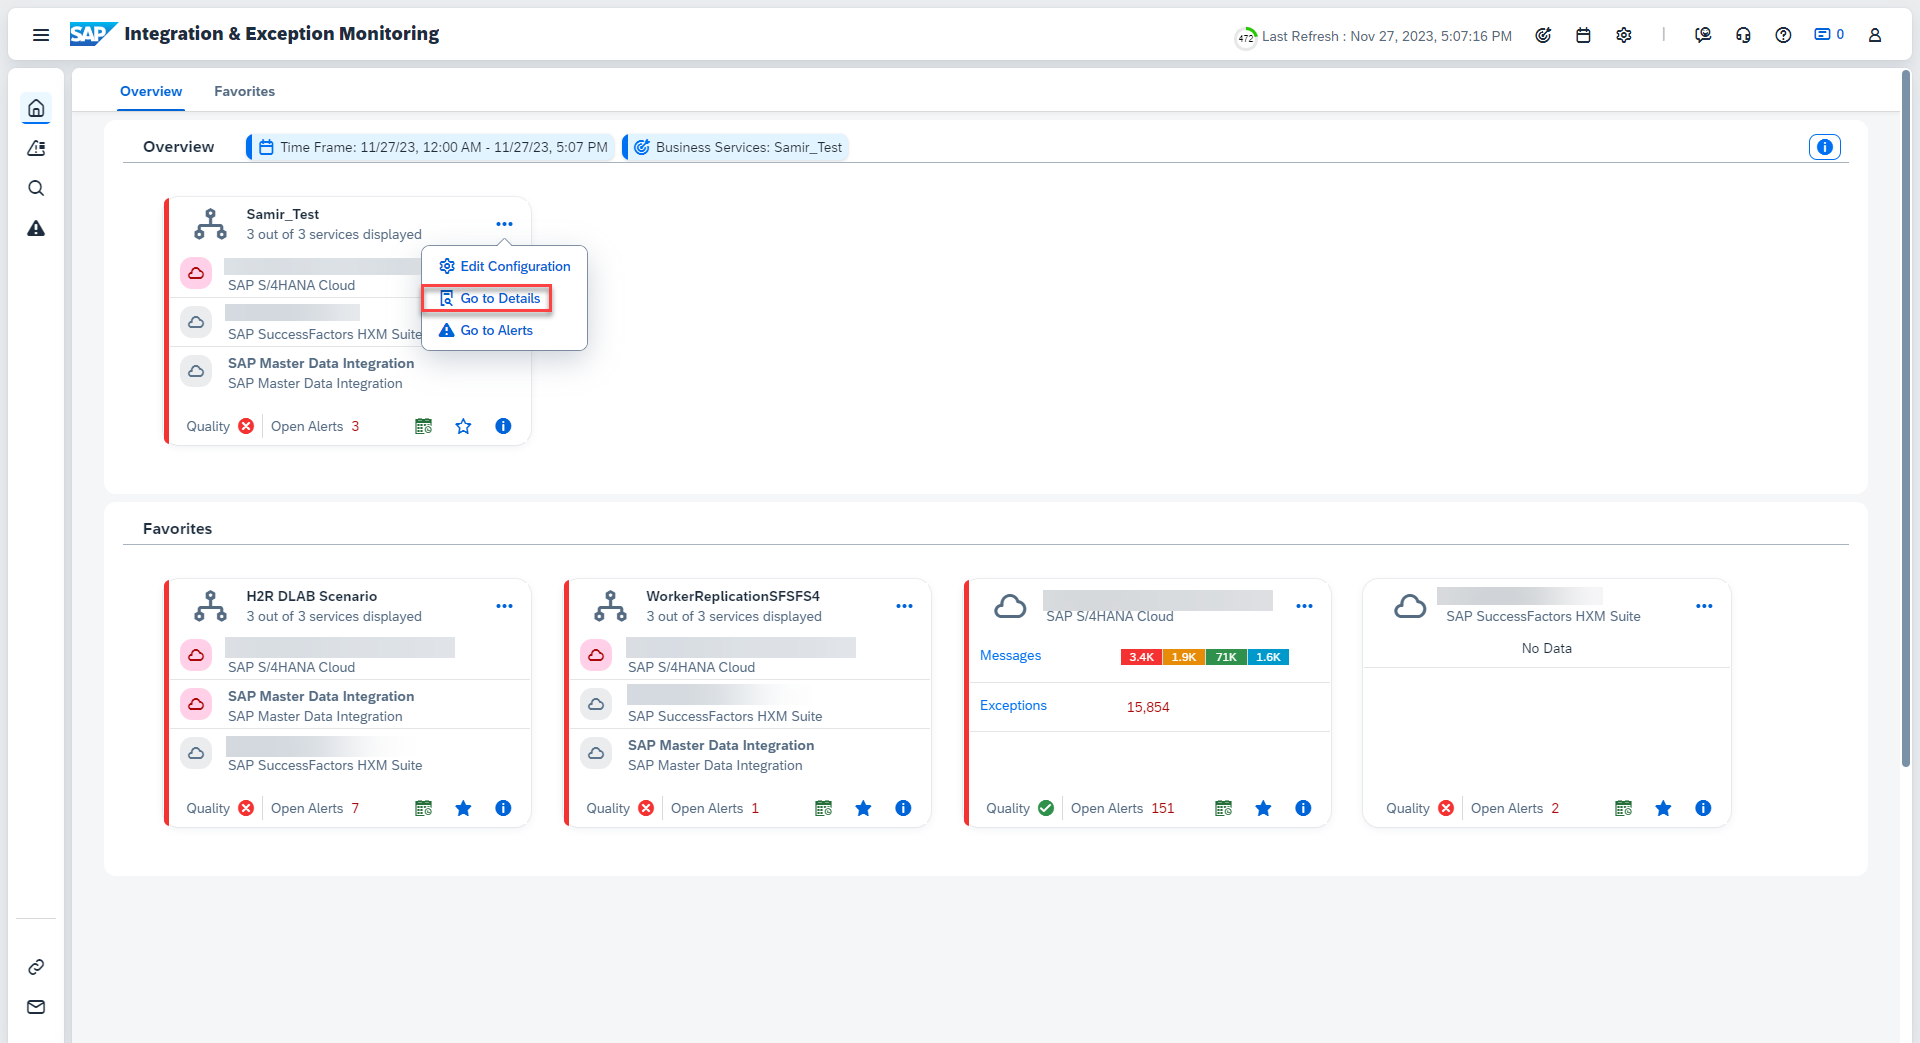
- On this page you can get more insights into your Business Service.

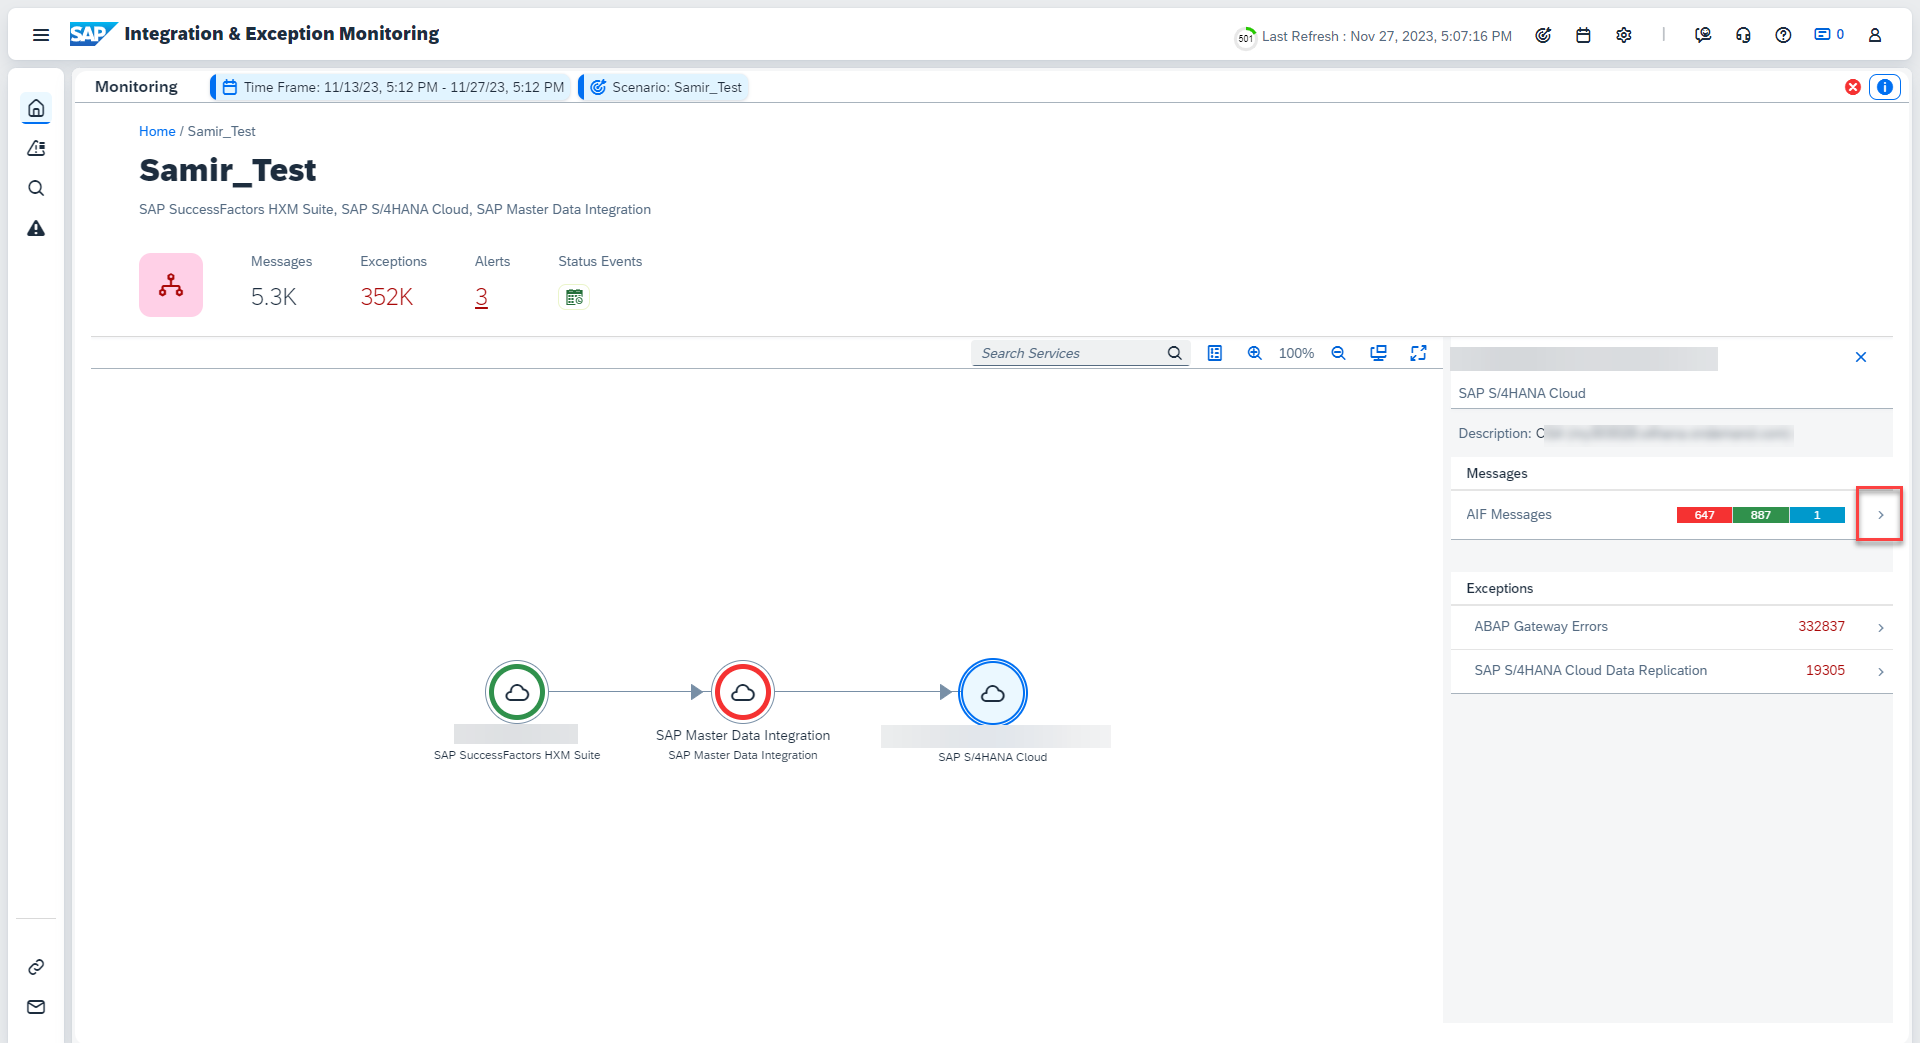
- Select the S4HC Service from the diagram to get a detailed breakdown on the messages and exceptions for your S4HC, honoring your defined filters. You can disregard the “Exceptions”.
Click on the “Messages”.
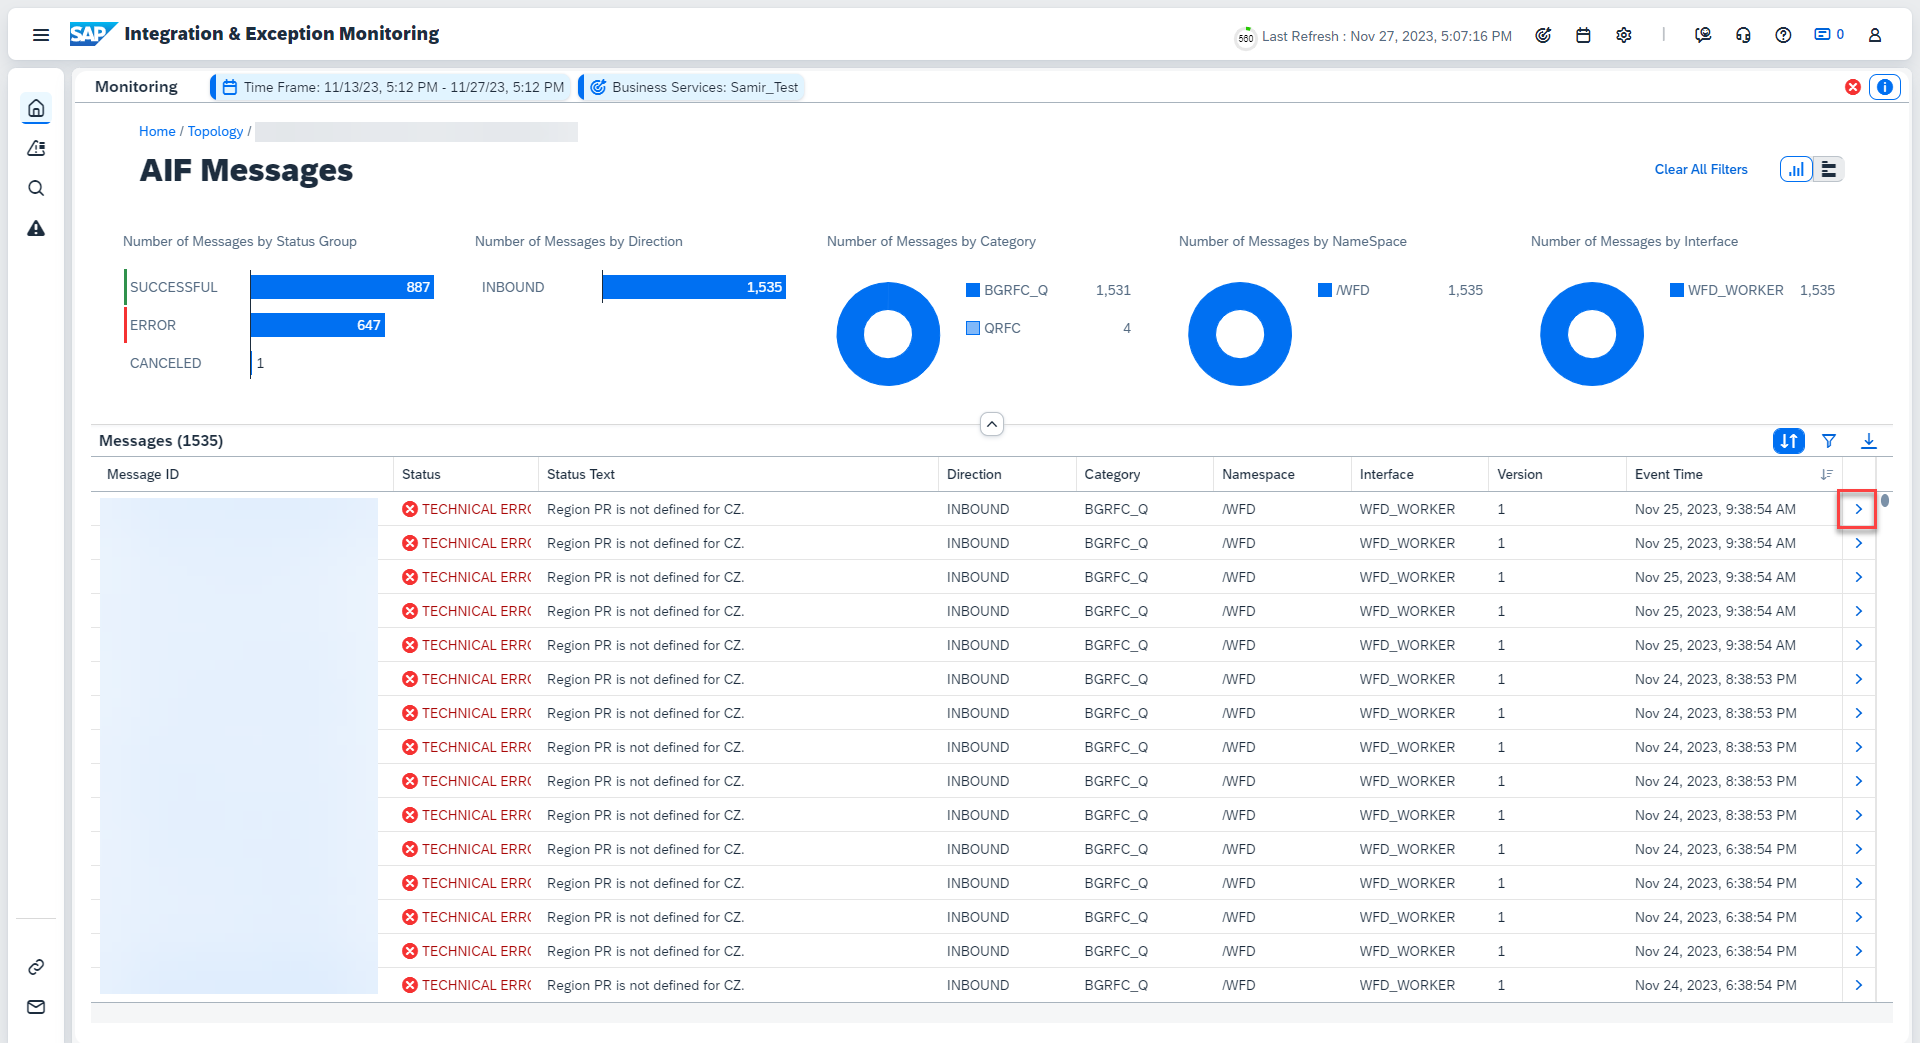
- On the next screen we are presented with a detailed list of all the Messages. You can use the diagrams in the top for further filtering.
Once you have identified a message, click the arrow symbol on it’s right.
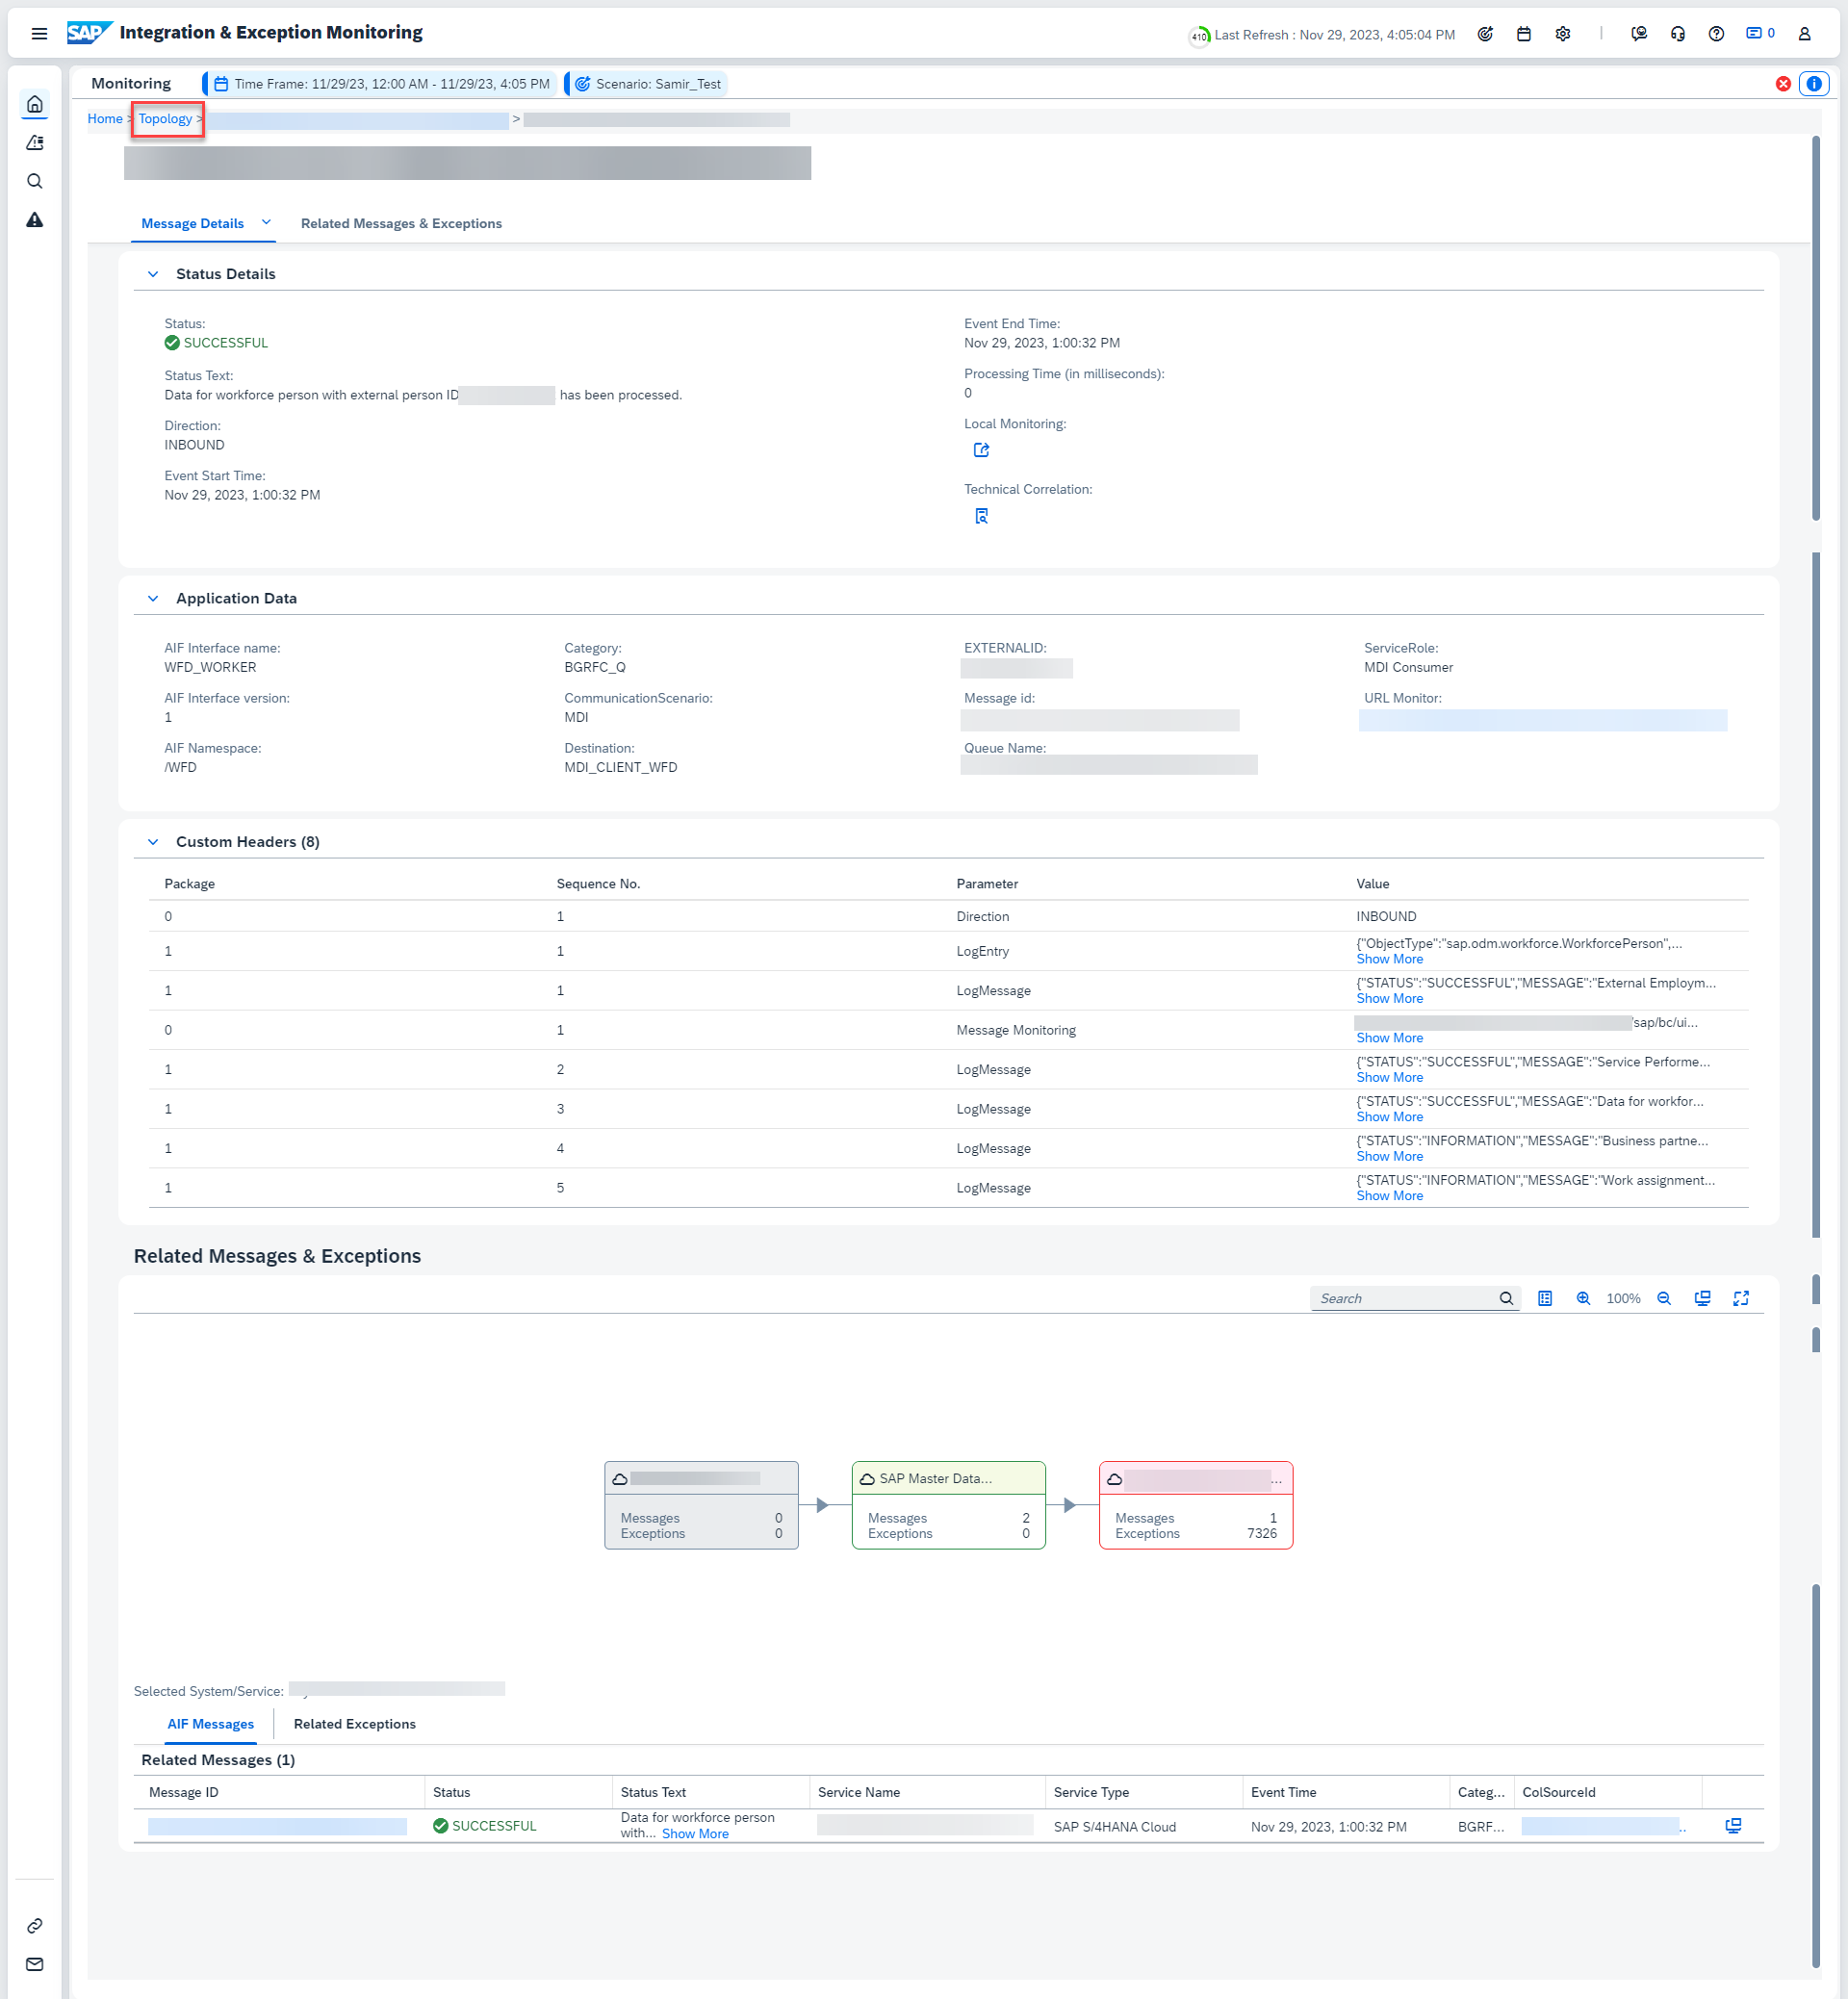
- You’ll get the most detailed overview for this specific message.
The most relevant information on this screen is the following:
- “Status” + “Status text” and a link to the local monitoring tool in section “Status Details”.
- “External ID” in section “Application Data”, please do not use the “URL Monitor” link in this section.
- The individual processing steps in section “Custom Headers”.
- The “Related Messages & Exceptions” section, to identify the corresponding messages in the other applications, containing this specific Object.
Once finished return to the Business Service overview, by clicking “Topology”
- Next select the MDI Service and click the arrow next to the “Messages” bar

- Like the S4HC you can further filter the messages, once you identified the one you are interested in, click the arrow on it’s right.

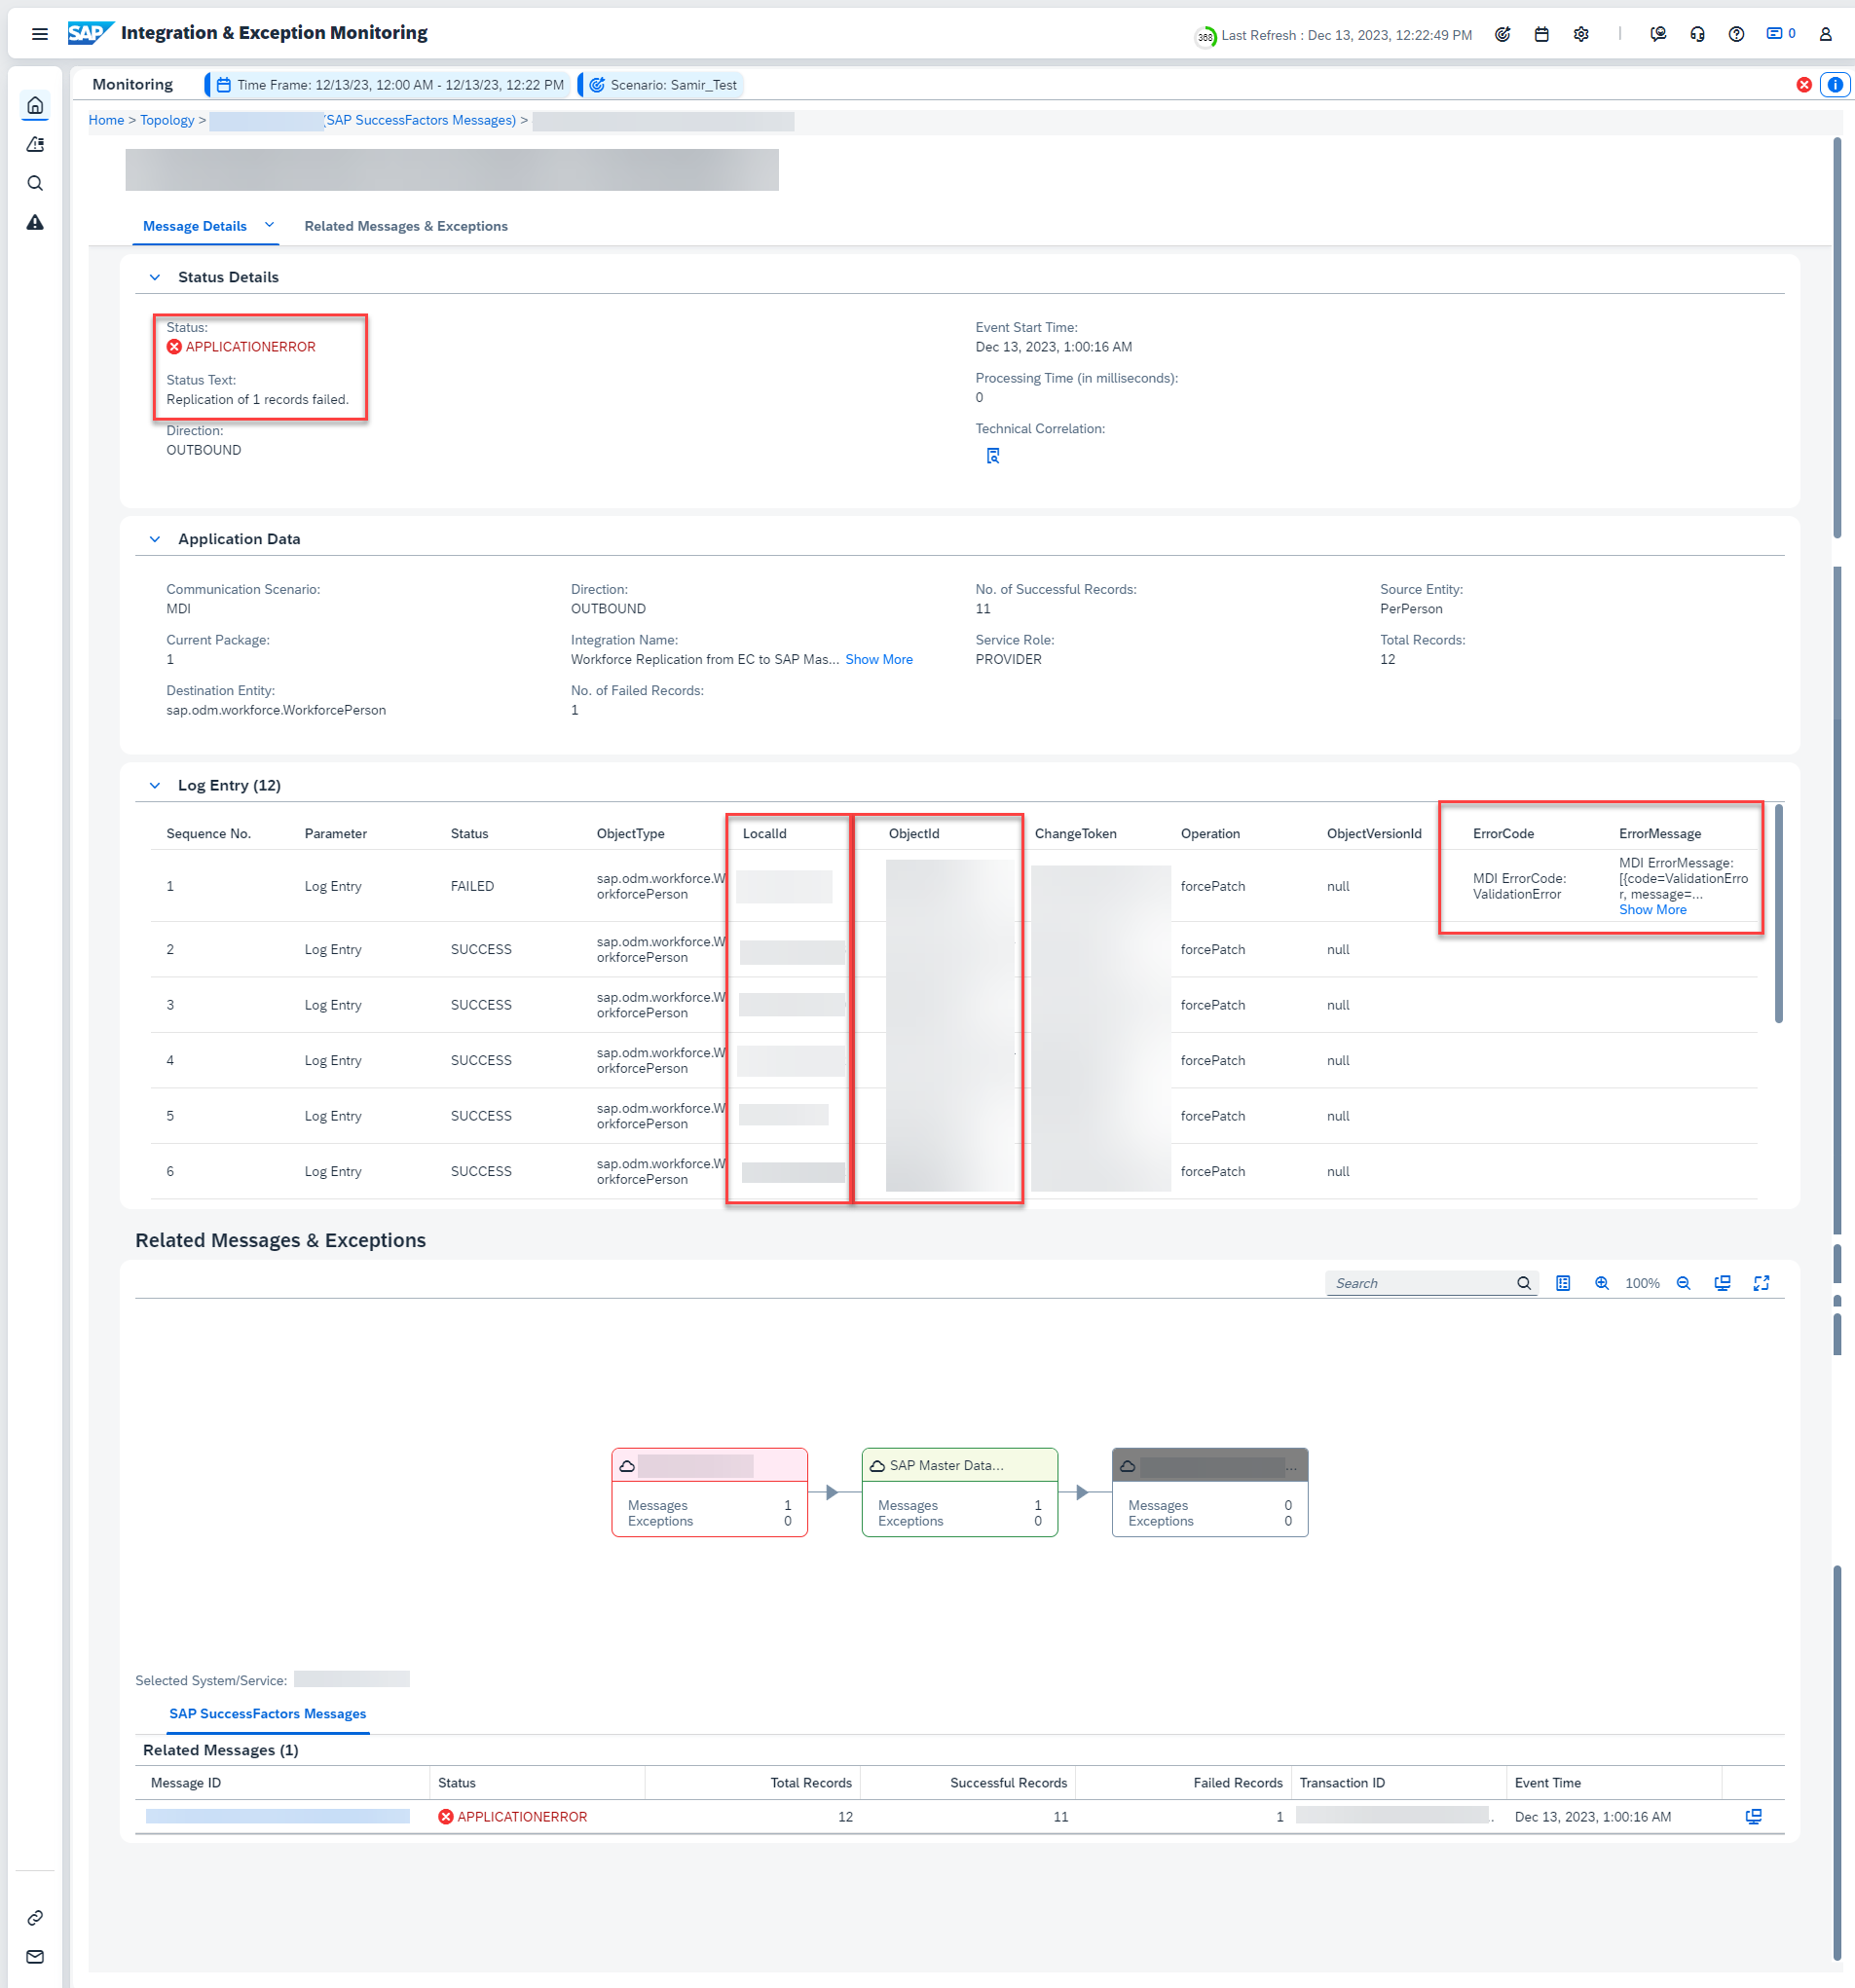
- You’ll get the most detailed overview for this specific message.
The most relevant information on this screen is the following:
- “Status” and “Status text” in section “Status Details”.
- “Object Types” in section “Application Data”.
- “Object ID” as the GUID of this specific record used to correlate across all applications and the “ErrorMessage” (replaced by “SuccessMessage” in case of success) in the “Log Entry” section.
- The “Related Messages & Exceptions” section, to identify the corresponding messages in the other applications, containing this specific Object.

- Back at the topology overview select SFSF service and navigate into the details here.

- SFSF replication to MDI is triggered based on a scheduled job, that picks up every change in the relevant period. CALM shows these jobs and hence a single message can have almost any number of workforce records in it. If you scroll to the right, you see the columns “Total Records”, “Successful Records” and “Failed Records” indicating this.
Additionally you can identify messages without any records by the Status “Completed” (which is part of Status Group “Info”) instead of “Success” (which is part of Status Group “Successful”) and the Status Text “No records fetched”, and filter them out if desired.

- You’ll get the most detailed overview for this specific message.
The most relevant information on this screen is the following:
- “Status” and “Status text” in section “Status Details”.
- “Object Types” in section “Application Data”.
- “Object ID” as the GUID of this specific record used to correlate across all applications and the “ErrorMessage” (replaced by “SuccessMessage” in case of success) in the “Log Entry” section.
- The “Related Messages & Exceptions” section, to identify the corresponding messages in the other applications, containing this specific Object.
Scenario 2 – find records for a specific Worker.
In this scenario, you have been informed or identified a worker that didn’t replicate correctly. Based on the existing information, usually the ID of the record, you want to first understand which integration failed, so that you can then perform a root cause analysis and correct the issue.
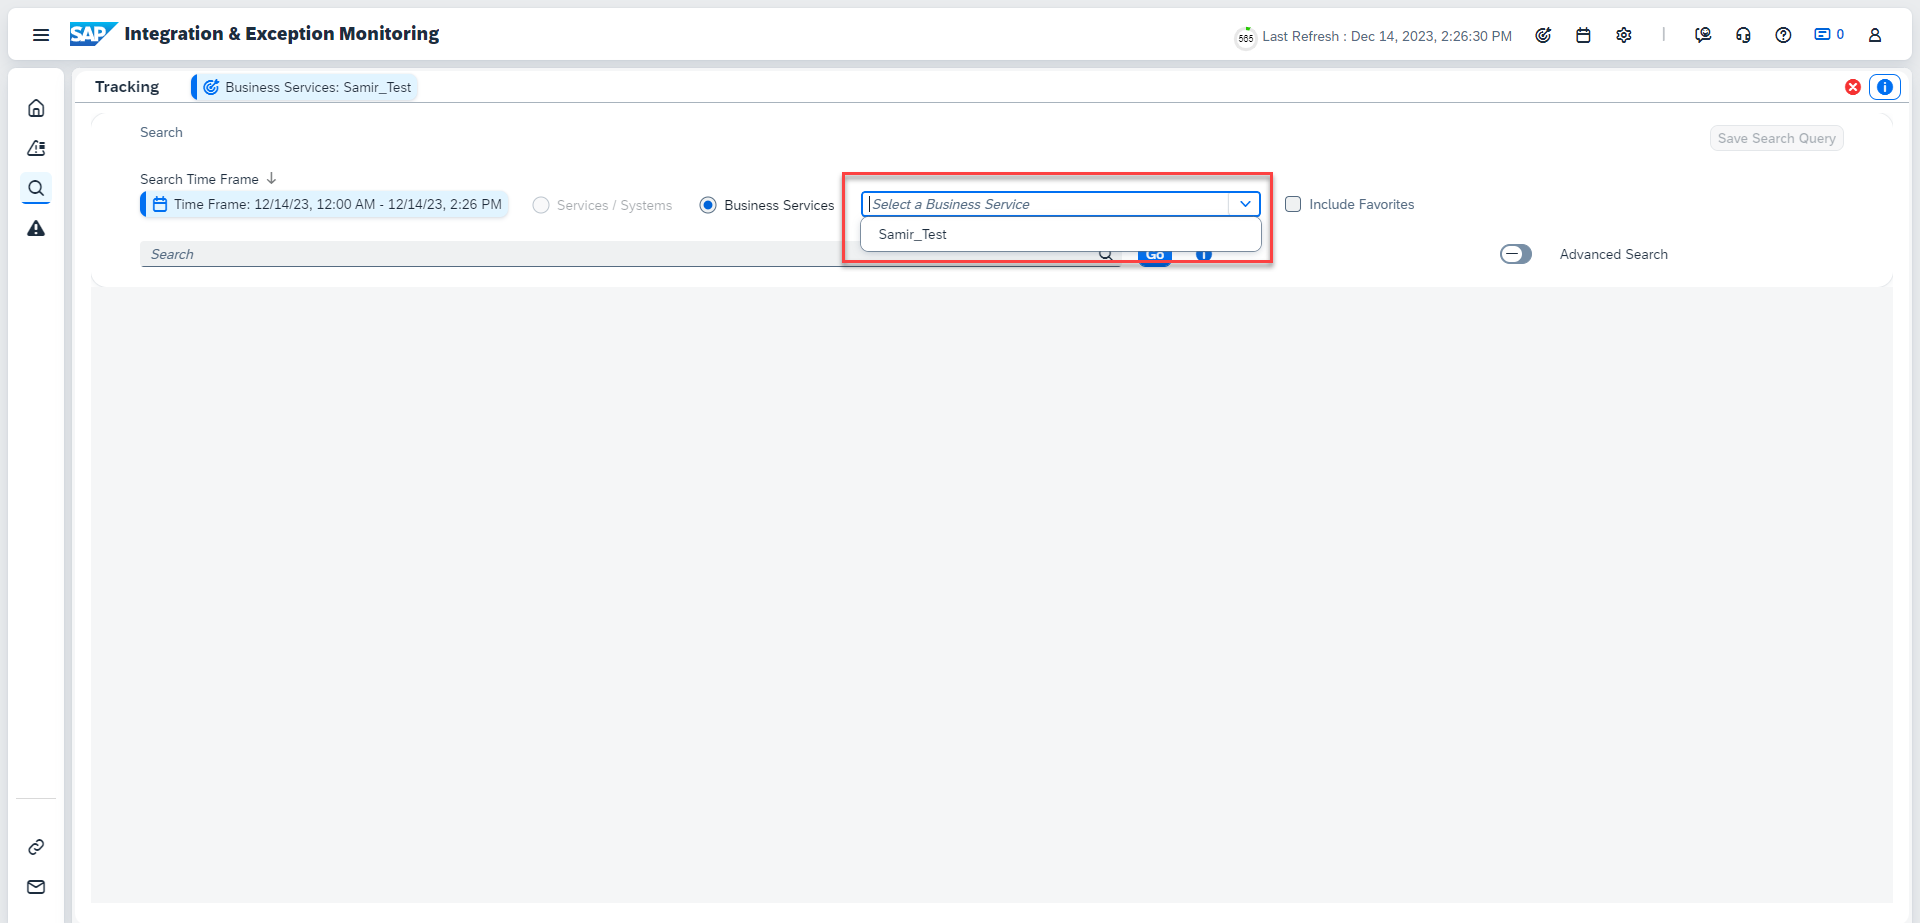
Before proceeding make sure the relevant Business Service (or Services) are active
- Go to Tracking (magnifying glass on the left).
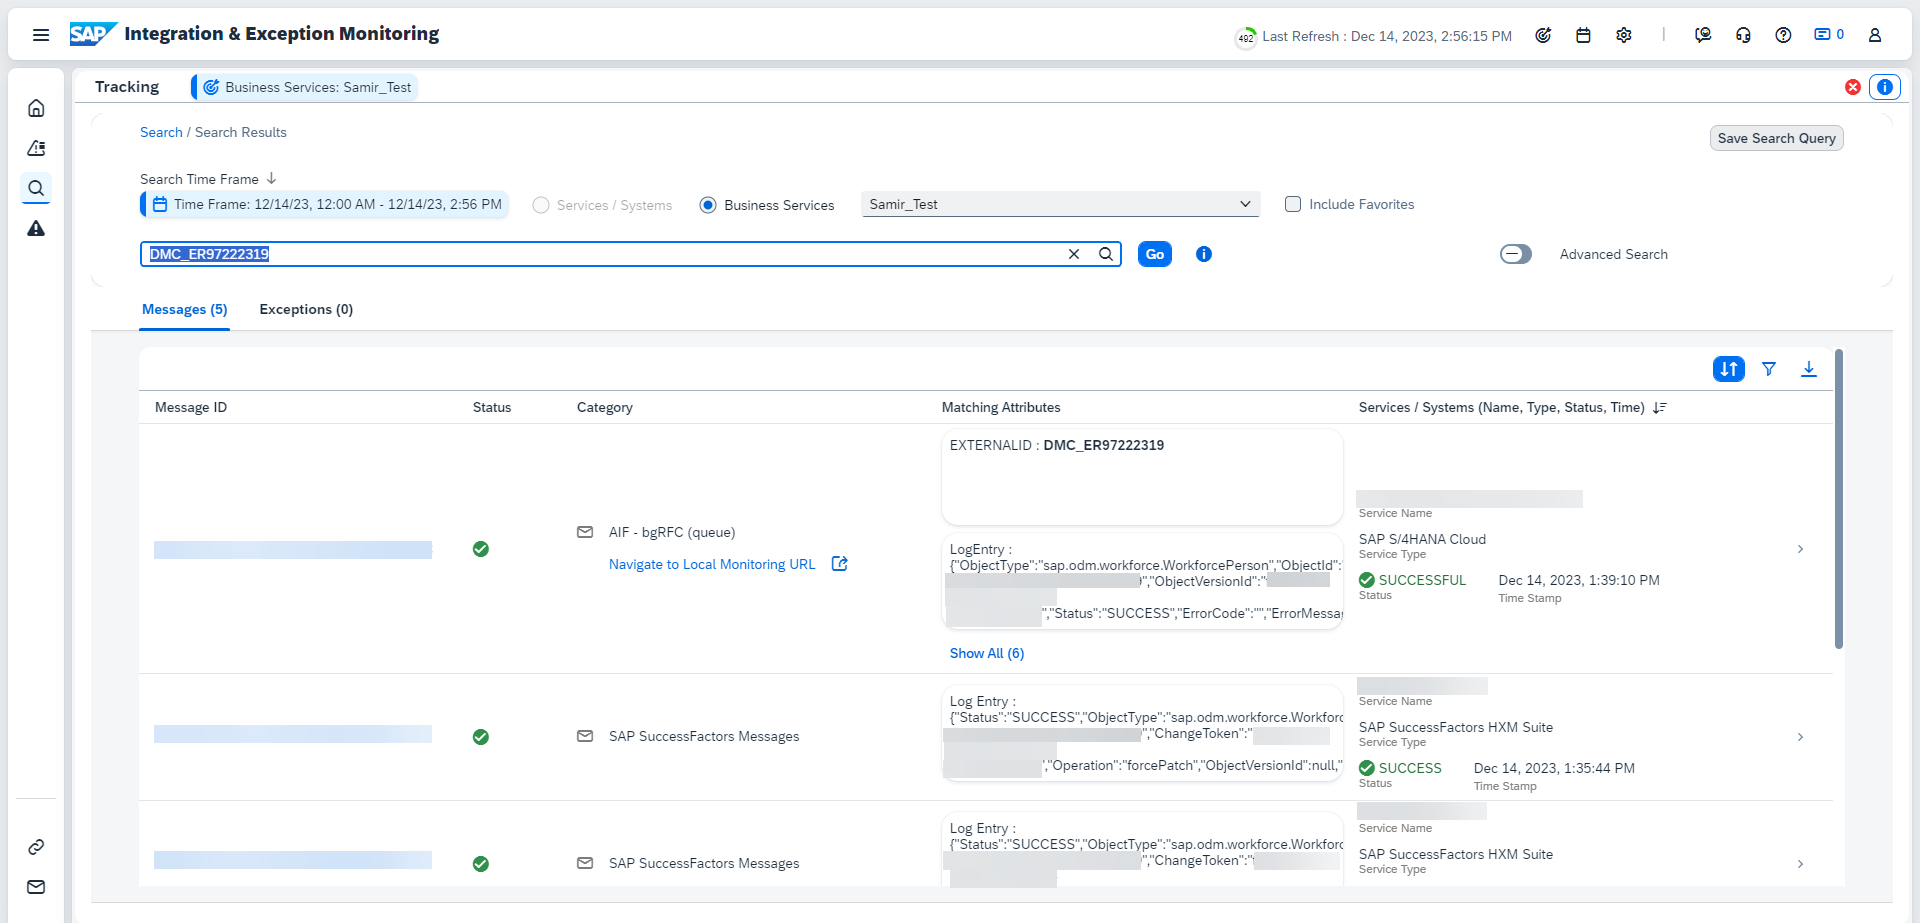
- Ensure the Business Service is chosen, enter search term (e.g., PersonExternal ID) and see all related messages. If you don’t find the relevant messages, you can try to add a star symbol “*” in the front and back of your search term. Also, often you get better results when using the objects GUID, instead of local IDs.
- You can then centrally navigate to the messages from each application containing this search term. The messages are then handled in the exact same manner as described in the section above.
This concludes this blog. I’m looking forward to getting your feedback and stay tuned for the next blogs in this series early next year.
Labels:
1 Comment
You must be a registered user to add a comment. If you've already registered, sign in. Otherwise, register and sign in.
Labels in this area
-
Artificial Intelligence (AI)
1 -
Business Trends
363 -
Business Trends
24 -
Customer COE Basics and Fundamentals
1 -
Digital Transformation with Cloud ERP (DT)
1 -
Event Information
461 -
Event Information
24 -
Expert Insights
114 -
Expert Insights
160 -
General
1 -
Governance and Organization
1 -
Introduction
1 -
Life at SAP
415 -
Life at SAP
2 -
Product Updates
4,684 -
Product Updates
220 -
Roadmap and Strategy
1 -
Technology Updates
1,502 -
Technology Updates
89
Related Content
- Enhanced RISE with SAP Methodology with clean core quality checks in Enterprise Resource Planning Blogs by SAP
- SAP Master Data Integration issue for Subscription Billing with SAP S/4HANA Public Cloud in Enterprise Resource Planning Q&A
- Working with SAFe Epics in the SAP Activate Discover phase in Enterprise Resource Planning Blogs by SAP
- Update of the SAP Activate Roadmap for SAP S/4HANA (on prem) upgrades with the Clean Core Strategy in Enterprise Resource Planning Blogs by SAP
- Integration of SAP Service and Asset Manager(SSAM) with SAP FSM to support S/4HANA Service Processes in Enterprise Resource Planning Blogs by SAP
Top kudoed authors
| User | Count |
|---|---|
| 11 | |
| 10 | |
| 9 | |
| 8 | |
| 7 | |
| 7 | |
| 6 | |
| 5 | |
| 4 | |
| 4 |