From reporting perspective, it is important to analyze the overall demand and supply situation to understand below scenarios
- Excess demand and shortage of supply
- Excess Supply due to overplanning of supply or cancellation of demand
- Analyze supply availability for the demand i.e. if the supply is arriving on time or late for the demand
Supply and Demand Overview provides details to tackle above use cases. Below are the list of available Supply Demand Overview Apps in standard:
- Supply Demand Overview - Detailed Analysis (F3387)
- Supply Demand Overview - Flexible Analysis (W0178)
- Supply Demand Overview - All Documents (F4055)
- Supply and Demand Cockpit (F4373)
This blog posts explains steps to create a new Supply Demand Fiori app using List Report Template.
Let us take an example where you have following demand and supply elements:
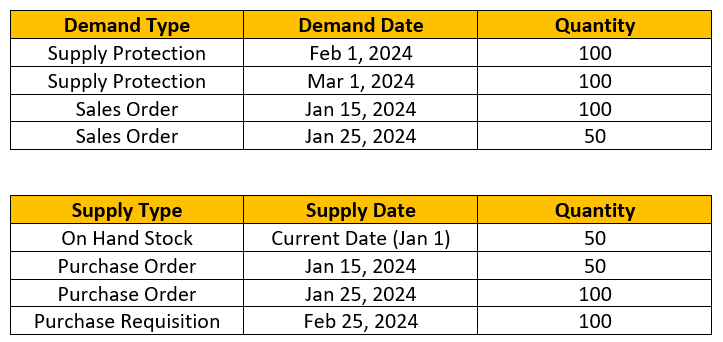
In above example,
- You want to understand if you have sufficient supply covered for the demand. for e.g. in this case, sales order for Jan 25, 2024 does not get any supply (No supply situation)
- If planned supply arrives on time for demand or not. In above case, sales order on Jan 15, 2024 does not get supply on time (delayed supply situation).
Pre-Requisites:
- Material is relevant for Supply Assignment
- Assignment of demand and supply is already executed through Supply Assignment or Preview Assignment or Temporary Assignments
Below are the steps to build a simple Supply Demand Overview Fiori app using List Report Template.
Step 1: Open Business Application Studio
Step 2: Create a new project based on template

Step 3: Click on List Report Page

Step 4: Specify the data source and OData service
In this case, we reuse the standard OData service RFM_ARUN_SDO_ALL_DOC_SRV.

Select the main entity as '
C_SupDmndAllDocAssgmtQry'. The Navigation entity can be left as blank.
Step 5: Specify the project attributes

Step 6: Save the project and Preview application.
You will observe the supply and demand details are displayed. The columns can be adjusted and the aggregation is done automatically based on the selected columns. (Note - the dynamic calculation is already handled in CDS View C_SupDmndAllDocAssgmtQry).

Supply Demand Overview (LR)
In above screenshot, its observed that Sales Order on Jan 15, 2024 has a delayed supply of 50 units and Sales Order on Jan 25,2024 does not have any supply. Also Supply Protection time buckets on Feb 1 and Mar 1 have supply arriving on time for the planned protected units. [Note - The list report can show further granular columns such as demand document number/ item, SUP Timebucket UUID, supply document number/item, etc.]
Step 7: Deploy the app to the corresponding development system and capture the changes in TR
Step 8: Create a Tile for the BSP application and add the tile catalog and tile group to the desired role
