
- SAP Community
- Products and Technology
- Human Capital Management
- HCM Blogs by Members
- Get Better People Insights with SuccessFactors Wor...
Human Capital Management Blogs by Members
Gain valuable knowledge and tips on SAP SuccessFactors HCM suite and human capital management market from member blog posts. Share your insights with a post of your own.
Turn on suggestions
Auto-suggest helps you quickly narrow down your search results by suggesting possible matches as you type.
Showing results for
ErikEbertDK
Contributor
Options
- Subscribe to RSS Feed
- Mark as New
- Mark as Read
- Bookmark
- Subscribe
- Printer Friendly Page
- Report Inappropriate Content
09-05-2017
8:22 PM
Many articles have been written about People Analytics and the value of converting people and HR data into actionable insights to gain competitive advantages. 2017 seems to be the year of digital transformation everywhere - and analytics is an important part of the business case. If you just have time to read one short story on the topic, I would recommend this inspirational article https://lnkd.in/dTTJ5FD by David Green that describes six reasons fuelling the interest in and growth of analytics in HR.
Anyway, me being part of the vibrant SAP SuccessFactors community and having a longtime passion for Human Capital Management and Analytics, I will share some initial experiences with the newest addition to the SuccessFactors software suite – Workforce Analytics on HANA (WFA on HANA). This innovation allows companies to analyse people data over time, understanding the trends and changes giving you actionable insights. And since it is based on the in-memory architecture of HANA most of the insights can get are provided in just a few seconds. No time wasted!
Hoping you will still read on, I will give you the conclusion first:
And knowing intimately what innovations has been provided in the last 30+ releases this is a big thing to say. Read on, and I hope you understand why I am making this bold claim!
First of all, before embarking on an analytical journey it is important to define what key performance indicators or metrics are important to your organisation. What is it that is most important to you? What makes your company different? What trends in the demographics do you need to be aware of? What hypothesis do you want to test? The definitions can rely on your own historical experiences, but you can also take advantage of the experiences from GP Strategies and SAP who defines a framework of standards for Human Capital Measures. These ensure that you follow good industry practise and allows you to compare your own organisation to market data provided by SAP.
WFA on HANA lets you look at your data like you have never been able to before so you can understand more about the trends that is shaping your workforce over time, and so you can make better People Decisions to secure your future. WFA on HANA has a set of predefined metrics following good industry practises and is flexible enough to allow companies add their own dimensions and filtering capabilities. For example, you can run headcount reports over different time periods, split by different dimensions, drill down, filter and even combine metrics (eg. "managerial headcount split by gender"). So in that sense, WFA is a flexible tool that allows you to report on the items that give you a competitive edge while on the other hand following good industry principles. End users are intended to be not only business analysts and reporting specialists, but just as well HR professionals and senior managers.
Let’s say that you just want to know the headcount over time for the past 4 years has been. Easy, just pull out the measure “EOP Headcount” (End Of Period Headount). If you were to do this in other reporting tools such as Online Report Designer this report would take minutes to load and would not be suitable for online analytics. In WFA, even for a large company with 10000 employees, this below snippet is displayed within a few seconds.

Then you may want to know what the gender distribution looks like over time for your headcount. Easy, just specify that you want to analyse data by Gender (multiple other analytical dimensions exist). Again, the report shows up in 2-3 seconds.
Now this report shows you that there was some data quality issues in previous years (gender unallocated), but also that the gender split is fairly linear across the years. It is possible to drill down to e.g. Country level to look at differences in geographical areas. So this is what we want to document to our CHRO who asked the question.
Then you may want to look at headcount and age distribution over time. Simple – just add Age as an analytical dimension and you get the numbers displayed (yes, again in 2 seconds).
Instead of Age you could also use the dimension Generation which converts age to a descriptive text.
But these three you may say is just simple data – it is not really insights. OK, then let’s try to answer a little more complex question about managerial positions – how are we staffing them? To answer this, let’s first look at how many managerial colleagues we employ.

As expected we can see as we have grown, the number of managerial positions has also grown. We can also see that the growth has been significantly larger in the older segment than in the younger. Again, this is not a surprise but important to know.
Like the regular headcount dimension you could also look at the gender dimension instead of age ranges. Just add Gender to the Dimension and the report generates.

Like all others you can drill down to understand if there are geographical differences. If for example you have a large presence in South East Asia you can look at that region only to see how the numbers are stacking up.
OK, this covered maybe around 1% of the capabilities in WFA on HANA. I did not even mention anything about termination trends (voluntary vs. involuntary terminations per business area) or combining different data sources such as performance ratings and termination trends or looking at average salary and salary ranges split by gender or generations. In my next blog I will write about the embedded feature Investigate which allows you to slice and dice your data even more creatively, allowing you to get even more precise insights into your people data, so stay tuned.
I think it is fair to say this is a major improvement in the SuccessFactors suite. WFA on HANA can be implemented now if you have Employee Central in place. WFA sources all data from other SuccessFactors modules optimises your data views from the transactional database into cubes which runs in the background, automated daily or hourly. Processing data changes for +10.000 employees happens within a few minutes, so if you are fine with daily refreshes this is great news.
Working with people analytics is both a project where you define a set of KPIs, implement a tool and build processes and education around it. But it is also a journey where you will be able to – if not forced to –adapt new KPIs as your business surroundings change and as your business matures in their analytical thinking. This is an important point to understand, that WFA on HANA is not the end result, it is the beginning of a continuous journey where you will improve your understanding over time and your capabilities to make better people decisions will improve over time.
If you have any comments or questions please do reach out to us. At GP Strategies we have always been leading the path and we are happy to be part of the first partners able to implement WFA on HANA for real. And hey – do leave a comment here – it is always a great inspiration for me to get feedback.
Best regards
Erik Ebert, SAP SuccessFactors Solutions Director
Erik Ebert, GP Strategies is an experienced SuccessFactors Solution Architect with 13 years experience in SuccessFactors and 25 years in IT professional services.
Anyway, me being part of the vibrant SAP SuccessFactors community and having a longtime passion for Human Capital Management and Analytics, I will share some initial experiences with the newest addition to the SuccessFactors software suite – Workforce Analytics on HANA (WFA on HANA). This innovation allows companies to analyse people data over time, understanding the trends and changes giving you actionable insights. And since it is based on the in-memory architecture of HANA most of the insights can get are provided in just a few seconds. No time wasted!
Hoping you will still read on, I will give you the conclusion first:
WFA on HANA is the most important feature that has been added for a long time to the SuccessFactors suite.
And knowing intimately what innovations has been provided in the last 30+ releases this is a big thing to say. Read on, and I hope you understand why I am making this bold claim!
First things first: define what you want to know
First of all, before embarking on an analytical journey it is important to define what key performance indicators or metrics are important to your organisation. What is it that is most important to you? What makes your company different? What trends in the demographics do you need to be aware of? What hypothesis do you want to test? The definitions can rely on your own historical experiences, but you can also take advantage of the experiences from GP Strategies and SAP who defines a framework of standards for Human Capital Measures. These ensure that you follow good industry practise and allows you to compare your own organisation to market data provided by SAP.
WFA on HANA lets you look at your data like you have never been able to before so you can understand more about the trends that is shaping your workforce over time, and so you can make better People Decisions to secure your future. WFA on HANA has a set of predefined metrics following good industry practises and is flexible enough to allow companies add their own dimensions and filtering capabilities. For example, you can run headcount reports over different time periods, split by different dimensions, drill down, filter and even combine metrics (eg. "managerial headcount split by gender"). So in that sense, WFA is a flexible tool that allows you to report on the items that give you a competitive edge while on the other hand following good industry principles. End users are intended to be not only business analysts and reporting specialists, but just as well HR professionals and senior managers.
Case: Headcount reporting
Let’s say that you just want to know the headcount over time for the past 4 years has been. Easy, just pull out the measure “EOP Headcount” (End Of Period Headount). If you were to do this in other reporting tools such as Online Report Designer this report would take minutes to load and would not be suitable for online analytics. In WFA, even for a large company with 10000 employees, this below snippet is displayed within a few seconds.
Case: Headcount reporting and Diversity
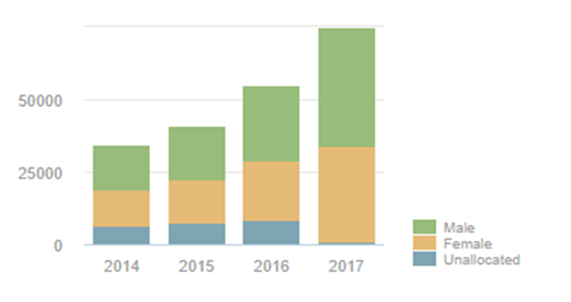
Then you may want to know what the gender distribution looks like over time for your headcount. Easy, just specify that you want to analyse data by Gender (multiple other analytical dimensions exist). Again, the report shows up in 2-3 seconds.
Now this report shows you that there was some data quality issues in previous years (gender unallocated), but also that the gender split is fairly linear across the years. It is possible to drill down to e.g. Country level to look at differences in geographical areas. So this is what we want to document to our CHRO who asked the question.
Case: Headcount reporting and Generations
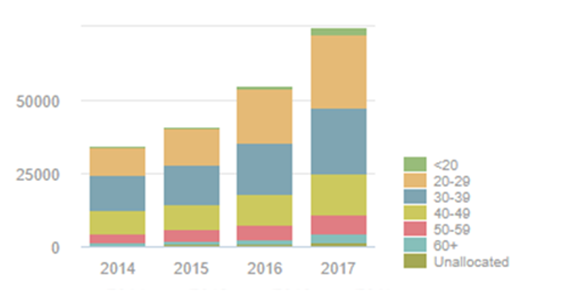
Then you may want to look at headcount and age distribution over time. Simple – just add Age as an analytical dimension and you get the numbers displayed (yes, again in 2 seconds).
Instead of Age you could also use the dimension Generation which converts age to a descriptive text.
Case: Managerial positions split by Age Ranges
But these three you may say is just simple data – it is not really insights. OK, then let’s try to answer a little more complex question about managerial positions – how are we staffing them? To answer this, let’s first look at how many managerial colleagues we employ.
As expected we can see as we have grown, the number of managerial positions has also grown. We can also see that the growth has been significantly larger in the older segment than in the younger. Again, this is not a surprise but important to know.
Case: Managerial Positions split by Gender
Like the regular headcount dimension you could also look at the gender dimension instead of age ranges. Just add Gender to the Dimension and the report generates.
Like all others you can drill down to understand if there are geographical differences. If for example you have a large presence in South East Asia you can look at that region only to see how the numbers are stacking up.
Concluding remarks
OK, this covered maybe around 1% of the capabilities in WFA on HANA. I did not even mention anything about termination trends (voluntary vs. involuntary terminations per business area) or combining different data sources such as performance ratings and termination trends or looking at average salary and salary ranges split by gender or generations. In my next blog I will write about the embedded feature Investigate which allows you to slice and dice your data even more creatively, allowing you to get even more precise insights into your people data, so stay tuned.
I think it is fair to say this is a major improvement in the SuccessFactors suite. WFA on HANA can be implemented now if you have Employee Central in place. WFA sources all data from other SuccessFactors modules optimises your data views from the transactional database into cubes which runs in the background, automated daily or hourly. Processing data changes for +10.000 employees happens within a few minutes, so if you are fine with daily refreshes this is great news.
Working with people analytics is both a project where you define a set of KPIs, implement a tool and build processes and education around it. But it is also a journey where you will be able to – if not forced to –adapt new KPIs as your business surroundings change and as your business matures in their analytical thinking. This is an important point to understand, that WFA on HANA is not the end result, it is the beginning of a continuous journey where you will improve your understanding over time and your capabilities to make better people decisions will improve over time.
If you have any comments or questions please do reach out to us. At GP Strategies we have always been leading the path and we are happy to be part of the first partners able to implement WFA on HANA for real. And hey – do leave a comment here – it is always a great inspiration for me to get feedback.
Best regards
Erik Ebert, SAP SuccessFactors Solutions Director
Erik Ebert, GP Strategies is an experienced SuccessFactors Solution Architect with 13 years experience in SuccessFactors and 25 years in IT professional services.
- SAP Managed Tags:
- SAP SuccessFactors Workforce Analytics
You must be a registered user to add a comment. If you've already registered, sign in. Otherwise, register and sign in.
Labels in this area
-
1H 2024 Product Release
5 -
2H 2023 Product Release
1 -
Absences-Only Time Recording in SAP SuccessFactors
1 -
ACCRUAL TRANSFER
1 -
Advanced Workflow
1 -
AI
1 -
AI & Skills Ontology
1 -
Alerts for National ID Information portlet: Full step-by-step guide
1 -
Alerts for Payment Information: Full step-by-step guide
1 -
Anonymization
1 -
API and Integration
1 -
Auto Delegation on the Leave Request (Time Off) Screen
1 -
BTP
1 -
Business Rules
2 -
Calibrating with Performance Form Data
1 -
Canvas Report
1 -
Career Development
1 -
Certificate-Based Authentication
1 -
Cloud Identity Services
1 -
Cloud Platform Integration
1 -
Common Super Domain
1 -
Compensation
1 -
Compensation Information Management
1 -
Compensation Management
1 -
compliance
2 -
Content
1 -
Conversational AI
2 -
CSD
1 -
Custom Data Collection
1 -
Custom event
1 -
custom portlet
1 -
Data & Analytics
1 -
Data Integration
1 -
Dayforce
1 -
deep link
1 -
deeplink
1 -
Delimiting Pay Components
1 -
Deprecation
1 -
EC Payroll
1 -
Employee Central
1 -
Employee Central Global Benefits
1 -
Employee Central Integration (Inc. EC APIs)
1 -
Employee Central Payroll
2 -
employee profile
2 -
Employee Rehires
2 -
external terminal
1 -
external time events
1 -
Generative AI
2 -
Getting Started
1 -
Global Benefits
1 -
Goals
1 -
Guidelines
1 -
h12024
1 -
H2 2023
1 -
HCM
1 -
HR
2 -
HR Data Management
1 -
HR Transformation
1 -
ilx
1 -
Incentive Management Setup (Configuration)
1 -
Integration Center
3 -
Integration Monitoring
1 -
Integration Suite
1 -
Intelligent Services
1 -
internal mobility
1 -
Introduction
1 -
Learning
3 -
LMS
2 -
LXP
1 -
Managing Pay Scale Progression based on Age (or) Service Period
1 -
Massively MDF attachments download
1 -
Mentoring
1 -
Metadata Framework
1 -
Middleware Solutions
1 -
OCN
1 -
ODATA
1 -
OData APIs
2 -
ONB USA Compliance
1 -
Onboarding
2 -
Opportunity Marketplace
1 -
Pay Component Management
1 -
PCE
1 -
Performance & Goals
1 -
Performance Form
1 -
Performance Forms
1 -
Platform
1 -
portlet
1 -
POSTMAN
1 -
Predictive AI
2 -
Rating the Skills in Performance Form
1 -
Recruiting
1 -
recurring payments
1 -
RISE PCE
1 -
Role Based Permissions (RBP)
2 -
S4 HANA On-Premise
1 -
SAP Build CodeJam
1 -
SAP Build Marketplace
1 -
SAP CPI (Cloud Platform Integration)
1 -
SAP HCM
1 -
SAP HCM (Human Capital Management)
3 -
SAP HCM ECC
1 -
SAP HR Solutions
2 -
SAP Integrations
1 -
SAP release
1 -
SAP successfactors
6 -
SAP SuccessFactors OData API
2 -
SAP Workzone
1 -
SAP-PAYROLL
1 -
self-service migration
1 -
sftp
1 -
SFTP scenario
1 -
Skills
1 -
Skills Management
1 -
sso deeplink
1 -
Stories in People Analytics
3 -
Story Report
1 -
SuccessFactors
3 -
SuccessFactors Employee central home page customization.
1 -
SuccessFactors Onboarding
1 -
successfactors onboarding i9
1 -
SuccessFactors Platform
1 -
Table Report
1 -
talent
1 -
Talent Intelligence Hub
2 -
talentintelligencehub
1 -
talents
1 -
Tax
1 -
Tax Integration
1 -
TIH
1 -
Time Accounts
1 -
Time Management implementation links
1 -
Workflows
1 -
XML Rules
1
- « Previous
- Next »
Related Content
- Activate SAP SuccessFactors SCIM IPS connector for Permission-Based User Sync for Story Reporting in Human Capital Management Q&A
- Sicherstellung der Datensicherheit in SAP SuccessFactors in Human Capital Management Blogs by SAP
- API Integration from EC to ADP WFN in Human Capital Management Q&A
- Creating a “My Team-esque” Story Report for HR Managers + Deep Links in Human Capital Management Blogs by Members
- 1H 2024 the “Employee Experience” release in Human Capital Management Blogs by SAP
Top kudoed authors
| User | Count |
|---|---|
| 8 | |
| 3 | |
| 2 | |
| 2 | |
| 2 | |
| 1 | |
| 1 | |
| 1 | |
| 1 | |
| 1 |