
- SAP Community
- Products and Technology
- Technology
- Technology Blogs by SAP
- ALP(Analytical List Pages) Reports from Manage KPI...
Technology Blogs by SAP
Learn how to extend and personalize SAP applications. Follow the SAP technology blog for insights into SAP BTP, ABAP, SAP Analytics Cloud, SAP HANA, and more.
Turn on suggestions
Auto-suggest helps you quickly narrow down your search results by suggesting possible matches as you type.
Showing results for
abhi1185
Explorer
Options
- Subscribe to RSS Feed
- Mark as New
- Mark as Read
- Bookmark
- Subscribe
- Printer Friendly Page
- Report Inappropriate Content
03-29-2021
1:51 PM
This blog is basically to give a brief about the new tool available to simplify the design/creation of Analytical list Page Fiori applications (ALP). Usually, for ALP Applications we need to write a lot of annotations in our consumption CDS view, like annotations to create list, annotations to create charts, selection variants, SelectionPresentation variants, PresenationVariants. Some local annotations need to be added on the UI side also. From ABAPes point of view, this entire exercise of understanding annotations and writing them is a bit difficult and something new. They are more accustomed to designing Data models.
This new tool "Manage KPI and Reports" helps to reduce the effort of writing annotations so that more attention can be paid to the Data model.
Let's start with a short introduction of the Analytical List page Reports, then a brief about the previous approach, and an introduction to a new tool to develop these reports easily.
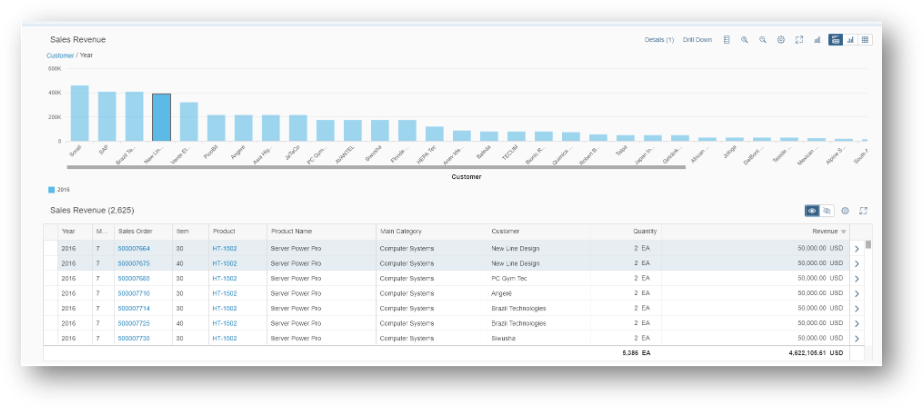
Analytical List Page is a powerful Fiori Element that provides the ability to create an analytical dashboard with KPIs, charts, tables, and also drill-down navigation to a detail page.
It basically consists of three areas.
Page Title
Contains the variant management and a section of global KPI tags. Each tag is associated with a detailed chart.
Page Header :
Composed by the filter area which allows users to filter the result set.
Two types of filters are supported, Users can toggle between the two filter modes anytime
Page Content: Consists of a Result set, can be displayed in three different modes.
Chart only view
Table only view
Hybrid view( Both Chart & Table)
Previous Approach: We used to add a lot of annotations in CDS, along with some local annotations that need to be added on the UI side.
For Eg. Annotations required for KPI tags and changes in the Manifest.json file like below. Then this selection presentation variant has to be added in the Manifest.json file against "keyPerformanceIndicators" attribute of the UI application.
Same way lot of Charts need to be created in CDS using @UI.Chart annotations, then mapped presentation variants have to be added in local annotations in WebIde to create visual filters and charts in the page content area.
There is a lot of effort going in to create all these elements, but in a way, it was good to get a basic understanding of how things fit together. Now there is a new tool that simplifies the creation of Analytical List Page reports.
Manage KPI and Reports: A single platform used to create groups, KPIs, reports, and applications that can be launched directly from SAP Fiori launchpad.
Role Required: SAP_BR_ANALYTICS_SPECIALIST
ICF node Details :
Now first create a simple CDS (consumption view), without any annotation containing all the fields required in the ALP application. Publish it as an OData service. Aggregation attribute is required to be there solving the similar purpose like Query browser. No need to add an annotation for Charts, Presentation variants, selection variants like before.
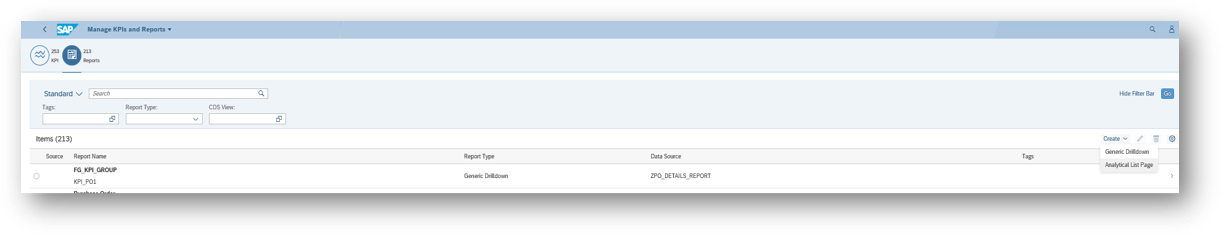
Now go inside Manage KPI and Reports application. Switch to Reports Tab, then click Create, select Analytical List page
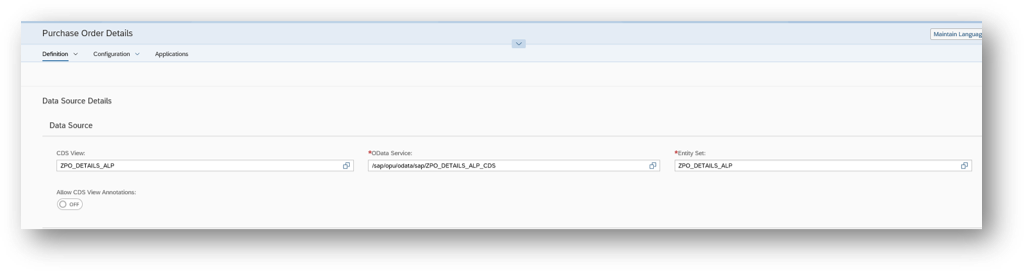
Give Data Source Details: Referenced CDS need not be having any annotations, like in normal ALP.
Now once the CDS & OData service is mapped, switch to the configuration tab, where you can create KPI tags, Input parameters, charts, tables.
To add KPI tags, first create individual KPI using the same application from the KPI tab.
Now switch back to ALP Report, click on KPI Tags under the Configuration tab. Select created KPI, so now KPI is added to your ALP Report.
Now to add visual Filters to the report, click on the Input Parameters and Filters under the Configuration tab.
Now add a new Visual filter by clicking the + icon.
Supports three chart types :
Bar Chart
Line Chart
Donut Chart
Provide Dimension and measure by selecting from the dropdown. (* same we used to do by specifying in annotations). That's it. that too without adding a single annotation for it. You can add multiple visual filters as per your requirement.
Now coming to the Page content area. Select table from Configuration drop-down, then select all fields you want to add as columns.
It's for displaying data in tabular form instead of aggregated one.
Click on Settings and Select all columns required in the table.
then the table is displayed, no need to add any annotation for it 🙂
We can add a chart also in Page content, select Chart from Configuration dropdown, then select Attribute which can act as Dimension (Assign Role as Category to it), Select measure. And that's it. No need to add an annotation for it also.
A chart will be visible after that.
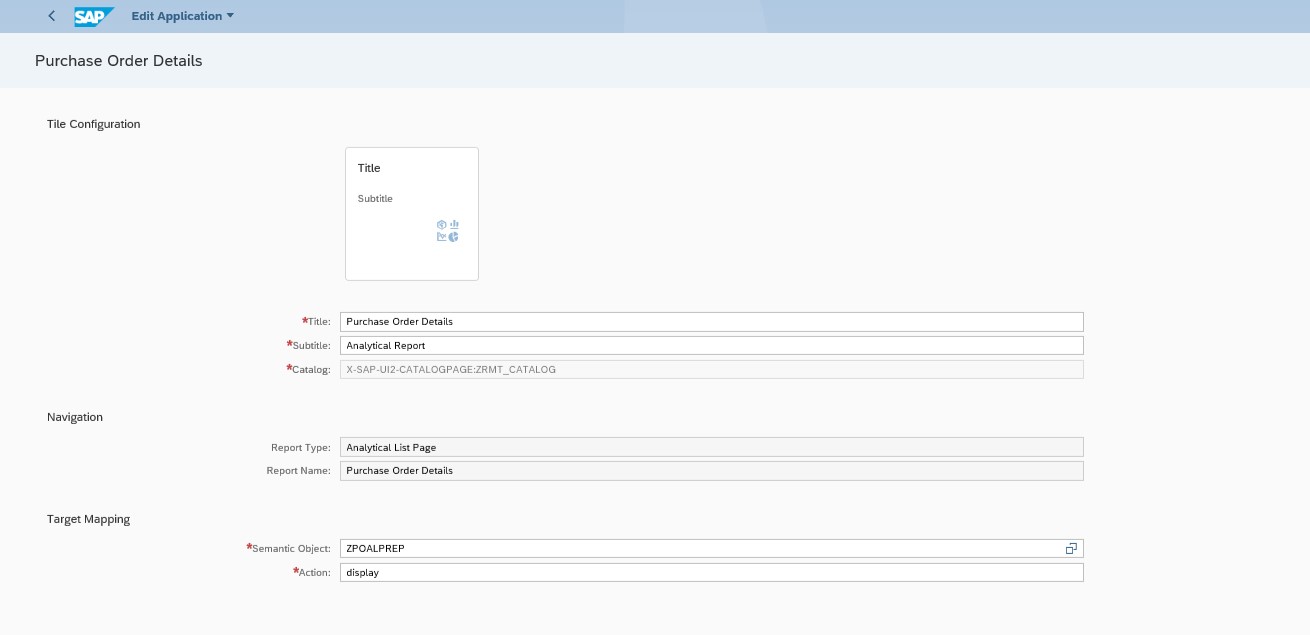
Activate, then create Application & Fiori tile from the Application tab for your ALP report.
You have to specify Semantic object, action & other details in the same way as we do while creating Fiori Tile.
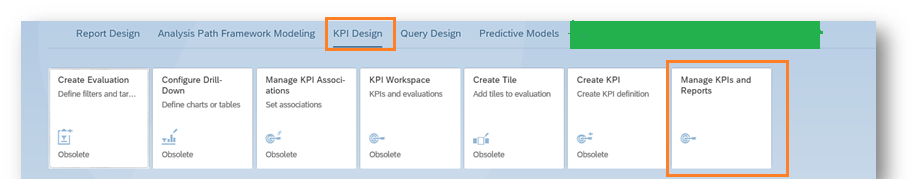
So " Manage KPI and Report" is a standard tool that can be used to Create KPIs, Generic drill down Reports and Analytical List page reports. All the previous KPI tools for creating new KPIs, Evaluations, Associations, Drilldowns, Reports are now obsolete and everything is combined into this new single platform.
Along with KPI-related applications, you can also create ALP reports using this tool. You can create all elements ( KPI tags, Visual Filters, Charts & Tables) of the ALP report using the graphical user interface provided with this tool without having to write a single annotation on CDS or UI.
Please check this tool and provide feedback in case this is helpful.
Below are some references which can be helpful to get more insight into this.
https://help.sap.com/viewer/6b356c79dea443c4bbeeaf0865e04207/2020.000/en-US/c00cbf7fe8464663aee830fb...
You can also post your queries related to Fiori elements at the below link.
https://answers.sap.com/tags/73555000100800000131
This new tool "Manage KPI and Reports" helps to reduce the effort of writing annotations so that more attention can be paid to the Data model.
Let's start with a short introduction of the Analytical List page Reports, then a brief about the previous approach, and an introduction to a new tool to develop these reports easily.
Analytical List Page is a powerful Fiori Element that provides the ability to create an analytical dashboard with KPIs, charts, tables, and also drill-down navigation to a detail page.

It basically consists of three areas.
Page Title
Contains the variant management and a section of global KPI tags. Each tag is associated with a detailed chart.

Page Header :
Composed by the filter area which allows users to filter the result set.
Two types of filters are supported, Users can toggle between the two filter modes anytime
- Compact Filters
- Visual Filters (Visual filters are composed of a title and an interactive chart)

Page Content: Consists of a Result set, can be displayed in three different modes.
Chart only view
Table only view
Hybrid view( Both Chart & Table)
Previous Approach: We used to add a lot of annotations in CDS, along with some local annotations that need to be added on the UI side.
For Eg. Annotations required for KPI tags and changes in the Manifest.json file like below.
Then this selection presentation variant has to be added in the Manifest.json file against "keyPerformanceIndicators" attribute of the UI application.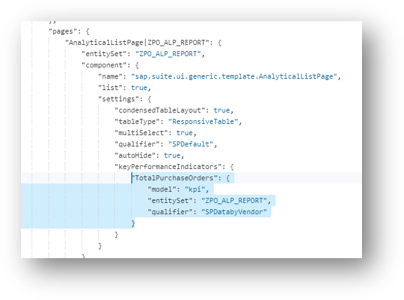
Same way lot of Charts need to be created in CDS using @UI.Chart annotations, then mapped presentation variants have to be added in local annotations in WebIde to create visual filters and charts in the page content area.
There is a lot of effort going in to create all these elements, but in a way, it was good to get a basic understanding of how things fit together. Now there is a new tool that simplifies the creation of Analytical List Page reports.
Manage KPI and Reports: A single platform used to create groups, KPIs, reports, and applications that can be launched directly from SAP Fiori launchpad.
Role Required: SAP_BR_ANALYTICS_SPECIALIST
ICF node Details :
| ANALYTICSDTS1 | Manage KPIs and Reports | ui.cloudfnd.analyticsdesigntool.s1 | /sap/bc/ui5_ui5/ssb/ANALYTICSDTS1 |
Now first create a simple CDS (consumption view), without any annotation containing all the fields required in the ALP application. Publish it as an OData service. Aggregation attribute is required to be there solving the similar purpose like Query browser. No need to add an annotation for Charts, Presentation variants, selection variants like before.

Now go inside Manage KPI and Reports application. Switch to Reports Tab, then click Create, select Analytical List page
Give Data Source Details: Referenced CDS need not be having any annotations, like in normal ALP.
Now once the CDS & OData service is mapped, switch to the configuration tab, where you can create KPI tags, Input parameters, charts, tables.

To add KPI tags, first create individual KPI using the same application from the KPI tab.

Go inside KPI, click on Add KPI button, then map Odata service and define measure properties and activate KPI.

Now switch back to ALP Report, click on KPI Tags under the Configuration tab. Select created KPI, so now KPI is added to your ALP Report.

Now to add visual Filters to the report, click on the Input Parameters and Filters under the Configuration tab.

Now add a new Visual filter by clicking the + icon.
Supports three chart types :
Bar Chart
Line Chart
Donut Chart
Provide Dimension and measure by selecting from the dropdown. (* same we used to do by specifying in annotations). That's it. that too without adding a single annotation for it. You can add multiple visual filters as per your requirement.

Now coming to the Page content area. Select table from Configuration drop-down, then select all fields you want to add as columns.
It's for displaying data in tabular form instead of aggregated one.
Click on Settings and Select all columns required in the table.

then the table is displayed, no need to add any annotation for it 🙂

We can add a chart also in Page content, select Chart from Configuration dropdown, then select Attribute which can act as Dimension (Assign Role as Category to it), Select measure. And that's it. No need to add an annotation for it also.
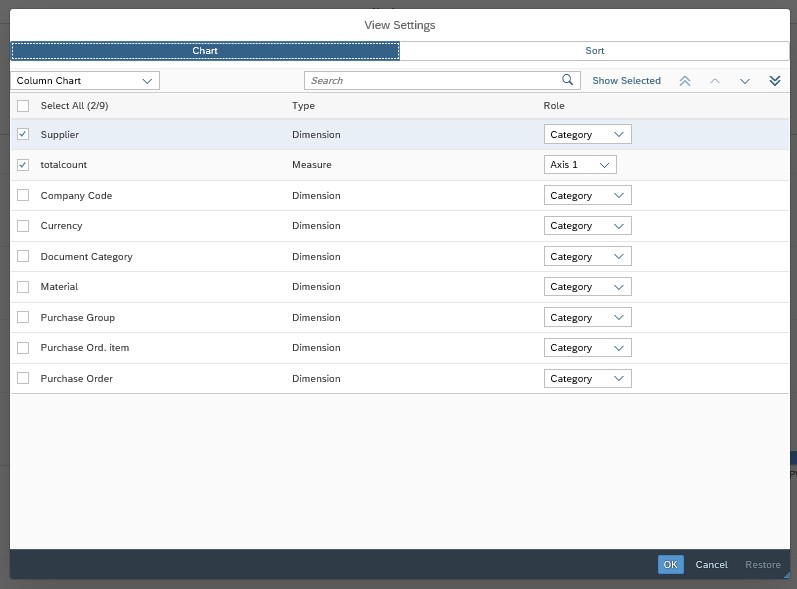
A chart will be visible after that.

Activate, then create Application & Fiori tile from the Application tab for your ALP report.

You have to specify Semantic object, action & other details in the same way as we do while creating Fiori Tile.
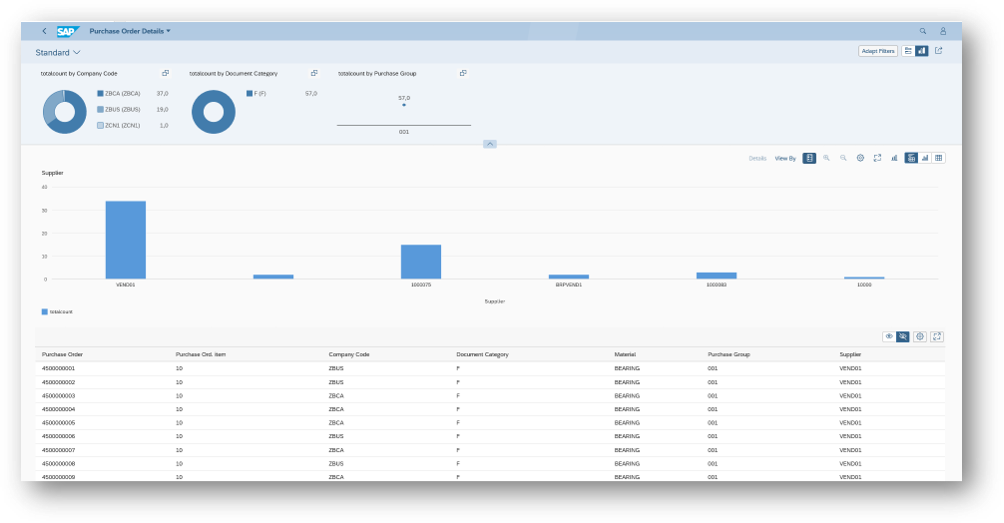
That's it, the ALP application is developed and can be accessed via the corresponding tile. Thank you 🙂 this is my first-hand experience with this application, which I feel can be helpful if you want to skip defining annotations and design ALP quickly. It's more like a graphical approach for defining annotations.
However, it only helps to implement some annotations for you related to KPI tags, tables, charts, visual filters. Rest of the annotations as per the requirement still have to be defined at the CDS level or at the UI level.
So " Manage KPI and Report" is a standard tool that can be used to Create KPIs, Generic drill down Reports and Analytical List page reports. All the previous KPI tools for creating new KPIs, Evaluations, Associations, Drilldowns, Reports are now obsolete and everything is combined into this new single platform.
Along with KPI-related applications, you can also create ALP reports using this tool. You can create all elements ( KPI tags, Visual Filters, Charts & Tables) of the ALP report using the graphical user interface provided with this tool without having to write a single annotation on CDS or UI.
Please check this tool and provide feedback in case this is helpful.
Below are some references which can be helpful to get more insight into this.
https://help.sap.com/viewer/6b356c79dea443c4bbeeaf0865e04207/2020.000/en-US/c00cbf7fe8464663aee830fb...
You can also post your queries related to Fiori elements at the below link.
https://answers.sap.com/tags/73555000100800000131
- SAP Managed Tags:
- SAP Fiori for SAP S/4HANA,
- SAP S/4HANA Embedded Analytics
Labels:
1 Comment
You must be a registered user to add a comment. If you've already registered, sign in. Otherwise, register and sign in.
Labels in this area
-
ABAP CDS Views - CDC (Change Data Capture)
2 -
AI
1 -
Analyze Workload Data
1 -
BTP
1 -
Business and IT Integration
2 -
Business application stu
1 -
Business Technology Platform
1 -
Business Trends
1,658 -
Business Trends
109 -
CAP
1 -
cf
1 -
Cloud Foundry
1 -
Confluent
1 -
Customer COE Basics and Fundamentals
1 -
Customer COE Latest and Greatest
3 -
Customer Data Browser app
1 -
Data Analysis Tool
1 -
data migration
1 -
data transfer
1 -
Datasphere
2 -
Event Information
1,400 -
Event Information
74 -
Expert
1 -
Expert Insights
177 -
Expert Insights
346 -
General
1 -
Google cloud
1 -
Google Next'24
1 -
GraphQL
1 -
Kafka
1 -
Life at SAP
780 -
Life at SAP
14 -
Migrate your Data App
1 -
MTA
1 -
Network Performance Analysis
1 -
NodeJS
1 -
PDF
1 -
POC
1 -
Product Updates
4,575 -
Product Updates
388 -
Replication Flow
1 -
REST API
1 -
RisewithSAP
1 -
SAP BTP
1 -
SAP BTP Cloud Foundry
1 -
SAP Cloud ALM
1 -
SAP Cloud Application Programming Model
1 -
SAP Datasphere
2 -
SAP S4HANA Cloud
1 -
SAP S4HANA Migration Cockpit
1 -
Technology Updates
6,871 -
Technology Updates
479 -
Workload Fluctuations
1
Related Content
- Is it possible to capture the Logged on User and the current date of an AO report? in Technology Q&A
- Your Ultimate Guide for SAP Sapphire 2024 Orlando in Technology Blogs by SAP
- migrate all the Crystal Reports into WEBI reports 4.3 in Technology Q&A
- First steps to work with SAP Cloud ALM Deployment scenario for SAP ABAP systems (7.40 or higher) in Technology Blogs by SAP
- S_ALR_87013611 Report Painter report to Internal Table in Technology Q&A
Top kudoed authors
| User | Count |
|---|---|
| 17 | |
| 15 | |
| 11 | |
| 11 | |
| 9 | |
| 8 | |
| 8 | |
| 7 | |
| 7 | |
| 7 |