- SAP Community
- Products and Technology
- Technology
- Technology Blogs by SAP
- Kyma Integration with SAP Cloud Logging. Part 2: L...
- Subscribe to RSS Feed
- Mark as New
- Mark as Read
- Bookmark
- Subscribe
- Printer Friendly Page
- Report Inappropriate Content
In the first blog post of this three-part series, we talked about:
- What is SAP Cloud Logging?
- How to integrate it with Kyma runtime?
- How to ship logs?
In this blog, we will explore:
- Shipping traces from Kyma runtime to SAP Cloud Logging.
- Using SAP Cloud Logging dashboard to view and leverage traces.
What is distributed tracing?
Distributed tracing is a method used to monitor and profile applications that span multiple services or components. It provides a detailed view of the flow of requests as they traverse through various parts of a distributed system. By capturing and correlating information about each request, distributed tracing enables developers and operators to understand the performance characteristics, latency bottlenecks, and dependencies within their systems.
Shipping traces from Kyma runtime to SAP Cloud Logging
SAP Cloud Logging based on OpenSearch supports ingestion of traces when having the OTLP ingestion mode enabled. It provides pre-integrated dashboards to introspect them easily.
The goal of the next steps is to establish a cluster-central gateway using the Kyma Telemetry module being connected to Cloud Logging.
Additionally, we enable Istio to propagate trace context for every incoming request and emit trace data to the central gateway. Also, we enable our application to instrument and emit trace data to the gateway.
Prerequisites
- SAP BTP, Kyma runtime instance
- Telemetry module enabled in Kyma runtime instance
- SAP Cloud Logging Instance, Blog 1
- kubectl and command line support
Steps
- Configure Trace pipeline.
You must tell Kyma to ship the generated traces to the SAP Cloud Logging instance. This is done by creating a Trace pipeline. If you followed steps in the previous blog post, then you can simply run the following command, else adjust the name for secretKeyRef accordingly.
kubectl apply -f https://raw.githubusercontent.com/SAP-samples/kyma-runtime-extension-samples/main/sap-cloud-logging/k8s/tracing/traces-pipeline.yaml
For reference, this is what the TracePipeline looks like:
apiVersion: telemetry.kyma-project.io/v1alpha1
kind: TracePipeline
metadata:
  name: my-cls-trace-pipeline
spec:
  output:
    otlp:
      endpoint:
        valueFrom:
          secretKeyRef:
            name: my-cls-binding
            namespace: cls
            key: ingest-otlp-endpoint
      tls:
        cert:
          valueFrom:
            secretKeyRef:
              name: my-cls-binding
              namespace: cls
              key: ingest-otlp-cert
        key:
          valueFrom:
            secretKeyRef:
              name: my-cls-binding
              namespace: cls
              key: ingest-otlp-key
To learn more about TracePipeline and possible configuration options, check the resource documentation.
- Next, you enable mesh level configuration using Istio Telemetry resource.
kubectl apply -f https://raw.githubusercontent.com/SAP-samples/kyma-runtime-extension-samples/main/sap-cloud-logging/k8s/tracing/trace-istio-telemetry.yaml
For reference, this is how the default telemetry configuration looks like:
apiVersion: telemetry.istio.io/v1alpha1
kind: Telemetry
metadata:
  name: tracing-default
  namespace: istio-system
spec:
  tracing:
  - providers:
    - name: "kyma-traces"
    randomSamplingPercentage: 1.0
You can learn more about various options in the standard Istio documentation.
With this configuration, you enable tracing 1.0% of all requests that enter the Kyma runtime via Istio Service mesh. To optimize resource and network usage, it is important to set the sampling percentage value to a sensible default.
To understand how tracing is implemented in Kyma and what its architecture looks like, check the Kyma documentation.
NOTE: This would require an SAP Cloud Logging service instance. To find out how to create it, read the first blog post.
Viewing the traces
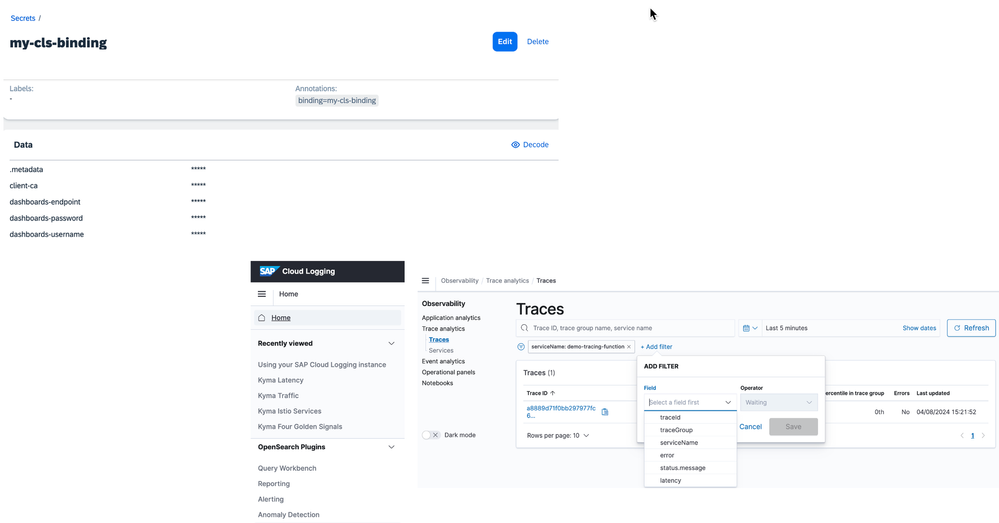
You can access the SAP Cloud Logging instance dashboard. The access details are available in the Secret generated by the service binding.
Next, to access the traces, you can navigate to:
Observability --> Trace Analytics --> Traces
You can also use various filter criteria to narrow down to the trace you are particularly interested in. The simplest one to use is the Service Name. It is the name of the Kubernetes Service which is associated with your microservice or function.
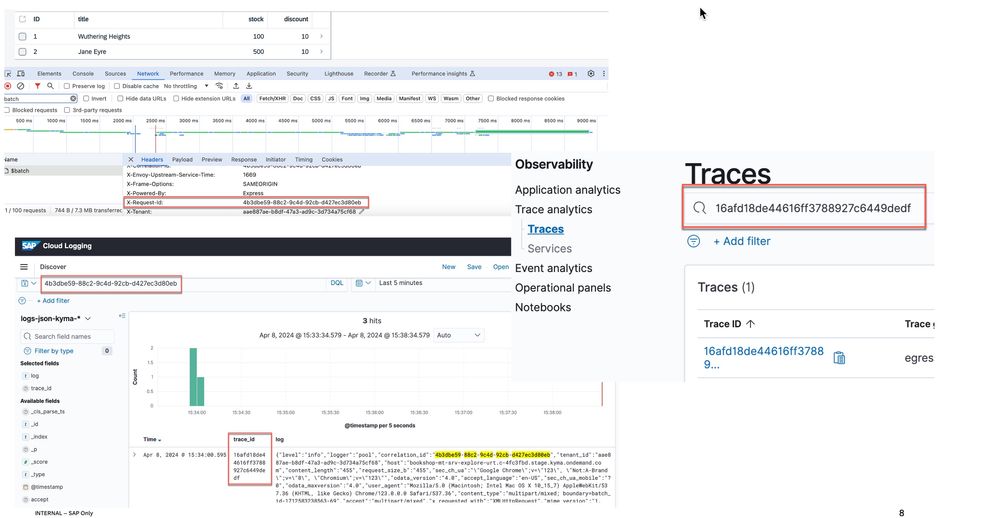
In case the response contains a request ID, you can always use it to find the corresponding Trace ID from the logs and use that as filter criteria.
This is particularly useful if you have enabled 100% tracing and want to troubleshoot a specific request.
Here is an example of using the request-id for a CAP application.
Examples
Here are some examples of how traces look for various scenarios:
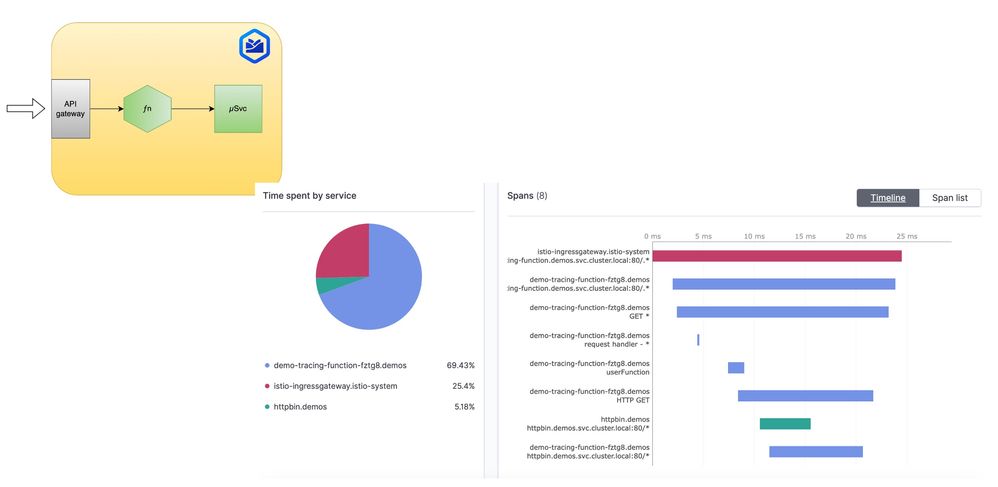
A function calling an upstream microservice:
I would like to point out that Kyma serverless does the additional instrumentation of your function code for tracing, and the same is visible in the spans generated.
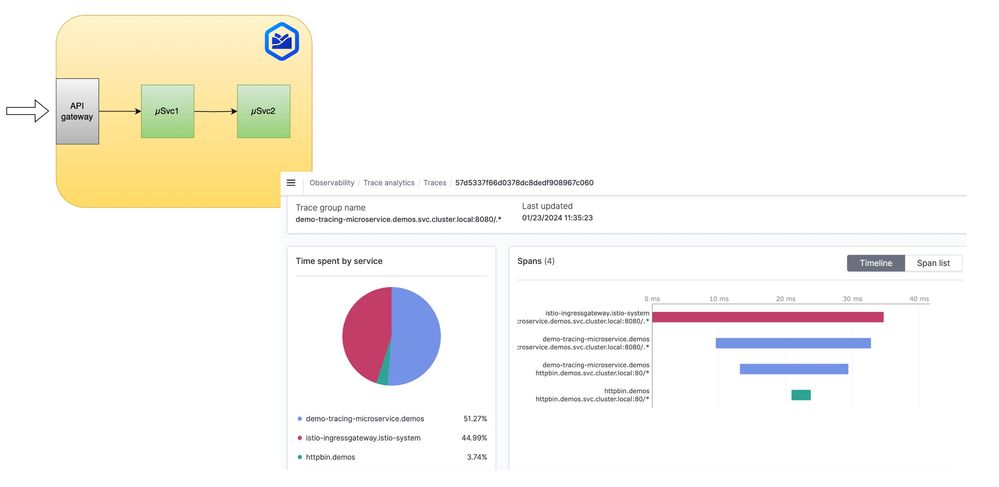
One microservice calling another upstream microservice:
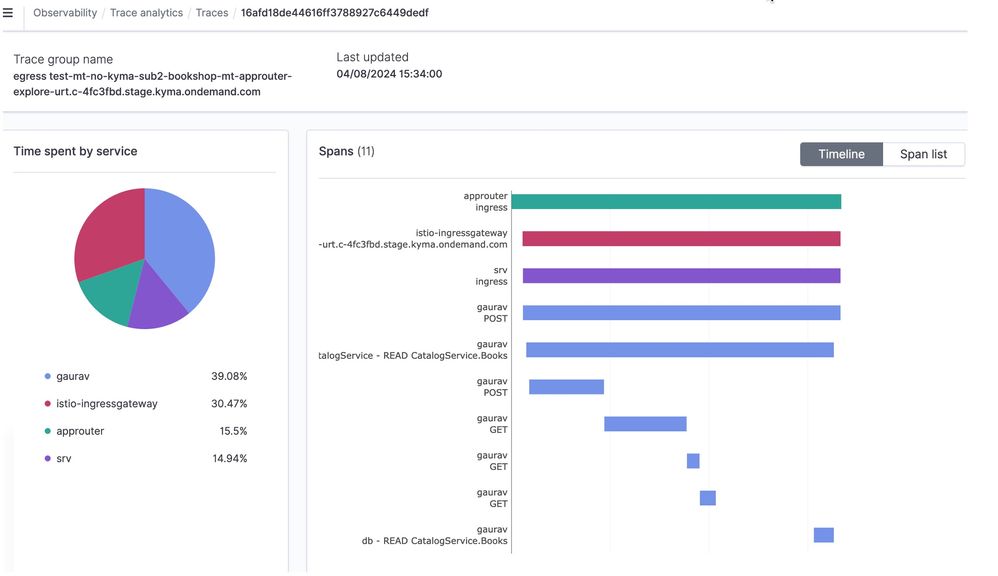
A multi-tenant JavaScript CAP application:
CAP JavaScript supports instrumentation. You just need to add the following NPM packages to your CAP project, provided by SAP and open telemetry.
{
  "dependencies": {
    "@cap-js/telemetry": "^0.1.0",
    "@grpc/grpc-js": "^1.10.3",
    "@opentelemetry/exporter-metrics-otlp-grpc": "^0.49.1",
    "@opentelemetry/exporter-trace-otlp-grpc": "^0.49.1",
    .....
  }
}
You can learn more about cap-js/telemetry in npm package documentation as well as GitHub repository.
Instrumentation
As mentioned in the previous example, you can use the npm package cap-js/telemetry for a JavaScript-based CAP application. For other technologies, consider using the SDKs provided by OpenTelemetry.
Cloud Native Buildpacks + Java
If you are using cloud native buildpacks, then you can also consider enabling OpenTelemetry while building the docker image. Check out this example from OpenTelemetry. There is also information about Paketo Buildpack for OpenTelemetry
NOTE: The endpoints to which the traces and metrics need to be shipped are available in the Telemetry default custom resource. You can view them in kyma-system namespace under Kyma -> Telemetry
Istio sidecar trace generation
If you have Istio sidecar enabled, Istio takes care of generating Spans, linking them to traces when you make upstream calls to services in the Istio service mesh. The requirement is to pass the appropriate headers so Istio can do the linking and generate the trace / span details.
This can be achieved by:
- Using one of the SDKs mentioned above. (Preferred option)
- Or, manually passing the required headers.
Reference: Istio distributed tracing
If you would like to do manual propagation, you should take the incoming "x-request-id" and "traceparent" headers from the HTTP request and forward them when making upstream calls to other microservices running inside the same Kyma cluster and part of Istio service mesh.
Other scenarios
Similarly, for calls to DB e.g. to SAP HANA Cloud, you can consider using SDKs that do the instrumentation.
How can you benefit from using distributed tracing?
Distributed tracing is a powerful technique used to monitor and understand the behavior of complex distributed systems. By implementing distributed tracing, you can gain several benefits:
Troubleshooting and debugging: Distributed tracing allows you to track requests as they flow through various components of your system. This helps identify performance bottlenecks, latency issues, and errors, making it easier to troubleshoot and debug problems.
Performance optimization: With distributed tracing, you can analyze the timing and dependencies of requests across different services. This helps identify areas where performance improvements can be made, such as optimizing slow database queries, reducing network latency, or optimizing resource usage.
Service dependency visualization: Distributed tracing provides a holistic view of how different services interact with each other. This helps understand the dependencies between services and identify potential points of failure or bottlenecks.
Capacity planning: By analyzing the traces of requests, you can gain insights into the resource utilization patterns of your system. This can help in capacity planning, ensuring that your system is provisioned with the right amount of resources to handle the expected load.
Coming next
Stay tuned for the next blog on Shipping metrics to SAP Cloud Logging from Kyma runtime.
- SAP Managed Tags:
- SAP BTP, Kyma runtime
You must be a registered user to add a comment. If you've already registered, sign in. Otherwise, register and sign in.
-
ABAP CDS Views - CDC (Change Data Capture)
2 -
AI
1 -
Analyze Workload Data
1 -
BTP
1 -
Business and IT Integration
2 -
Business application stu
1 -
Business Technology Platform
1 -
Business Trends
1,658 -
Business Trends
99 -
CAP
1 -
cf
1 -
Cloud Foundry
1 -
Confluent
1 -
Customer COE Basics and Fundamentals
1 -
Customer COE Latest and Greatest
3 -
Customer Data Browser app
1 -
Data Analysis Tool
1 -
data migration
1 -
data transfer
1 -
Datasphere
2 -
Event Information
1,400 -
Event Information
68 -
Expert
1 -
Expert Insights
177 -
Expert Insights
315 -
General
1 -
Google cloud
1 -
Google Next'24
1 -
GraphQL
1 -
Kafka
1 -
Life at SAP
780 -
Life at SAP
13 -
Migrate your Data App
1 -
MTA
1 -
Network Performance Analysis
1 -
NodeJS
1 -
PDF
1 -
POC
1 -
Product Updates
4,576 -
Product Updates
360 -
Replication Flow
1 -
REST API
1 -
RisewithSAP
1 -
SAP BTP
1 -
SAP BTP Cloud Foundry
1 -
SAP Cloud ALM
1 -
SAP Cloud Application Programming Model
1 -
SAP Datasphere
2 -
SAP S4HANA Cloud
1 -
SAP S4HANA Migration Cockpit
1 -
Technology Updates
6,873 -
Technology Updates
448 -
Workload Fluctuations
1
- New webcast series on “SAP BTP DevOps and Observability in Action” in Technology Blogs by SAP
- Hello, can you please help me in getting logged in user Info UI integration cards in sap build in Technology Q&A
- Enhancing S/4HANA with SAP HANA Cloud Vector Store and GenAI in Technology Blogs by SAP
- SAP PI/PO migration? Why you should move to the Cloud with SAP Integration Suite! in Technology Blogs by SAP
| User | Count |
|---|---|
| 20 | |
| 14 | |
| 11 | |
| 9 | |
| 8 | |
| 8 | |
| 7 | |
| 7 | |
| 7 | |
| 6 |
