In this blogpost I will describe how you can use the SAP Analytics Cloud choropleth layers to visualise HANA spatial clusters, such as grid, k-means or hexagons.

I have previously described
Using Choropleth Layers with HANA Cloud and SAP Analytics Cloud.
With that in place the steps are pretty easy
- Create database view (or table) to encapsulate spatial clustering
- Expose database view as Dimension Calculation View
- Update SAC Custom Regions Metadata
- Visualise with SAP Analytics Cloud
- Other Possibilities, Voronoi Regions
1. Create database view (or table) to encapsulate spatial clustering
The spatial clustering require spatial data with an ST_POINT datatype, this can be calculated from longitude and latitude if necessary.
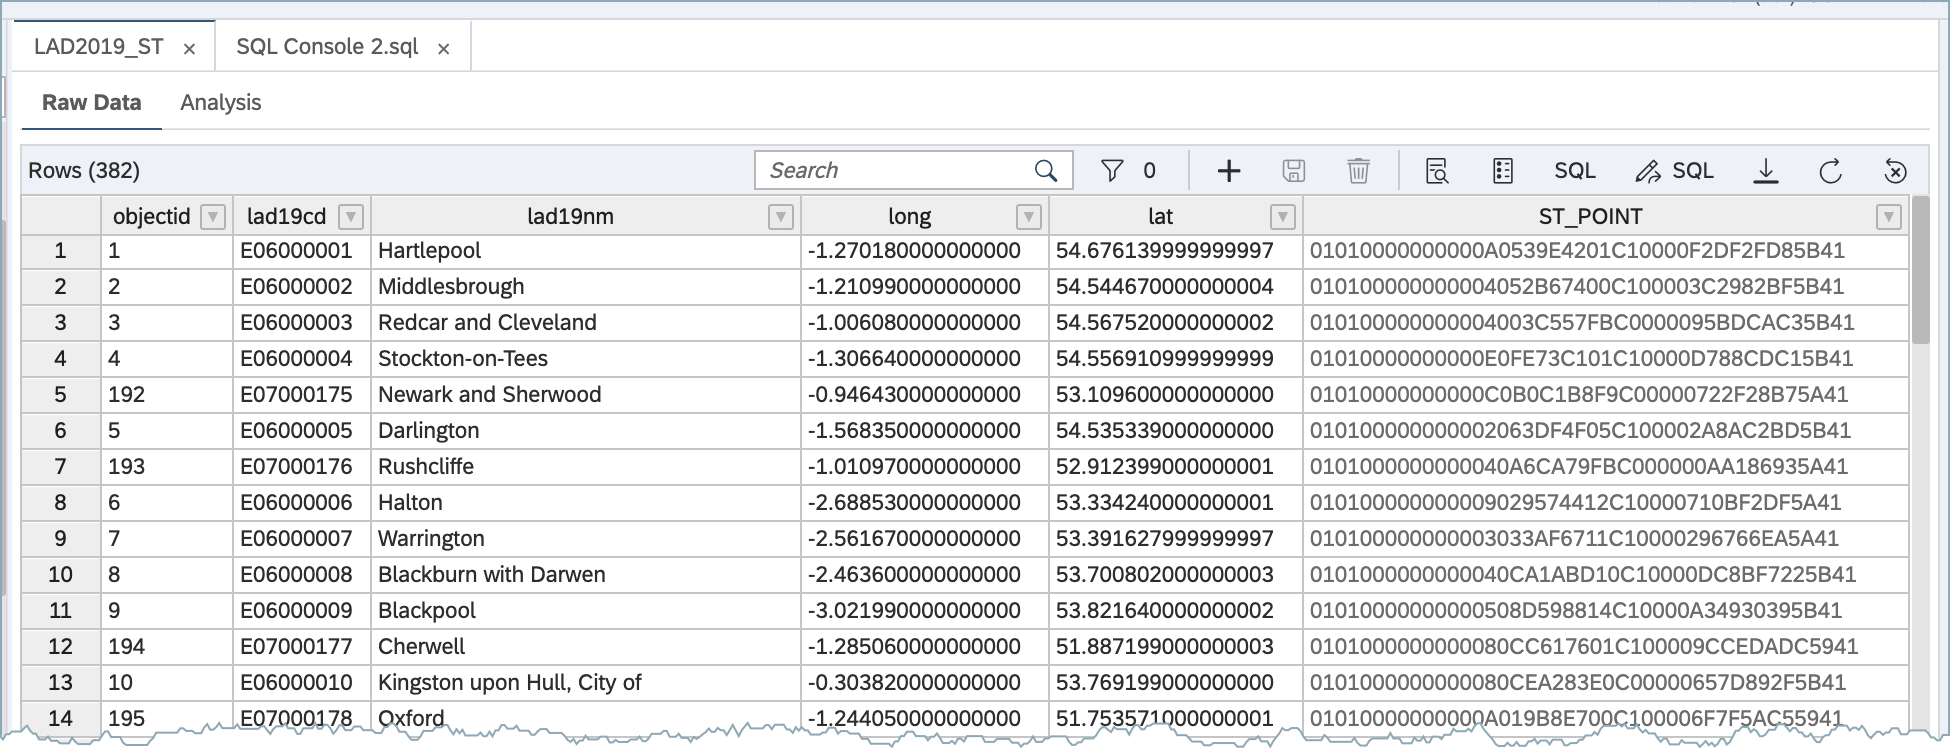
Figure 1.1: Database Explorer data preview

Figure 1.2: Database view with Hexagon Clustering
VIEW "view::LAD_2019_HEX15" AS

    SELECT COUNT(*) AS LAD_COUNT, ST_ClusterID() AS ID, ST_ClusterCell() AS SHAPE_HEX

    FROM LAD2019_ST

    GROUP CLUSTER BY ST_POINT USING HEXAGON X CELLS 15
The cluster definition specifies 15 "x" cells, i.e 15 hexagons across.
For more details on spatial clustering see the official
SAP HANA Spatial Reference.
2. Expose database view as Dimension Calculation View
SAP Analytics Cloud requires a dimensional calculation view with 4 fields exposed
The output of the Calculation view should contain these fields. ID and IS_LEAF are required as column names

Figure 2.1 Calculation View

Figure 2.2: Data Preview
3. Update SAC Custom Regions Metadata
You need to update the metadata to tell SAC that a new choropleth layer is available.
INSERT INTO "SAP_FPA_SPATIAL_CUSTOM_REGIONS"."sap.fpa.services.spatial::custom_hierarchy.CHOROPLETH_CUSTOM_HIERARCHY" VALUES	(

'Hexagons',	5,	'CLUSTER_NAME',	'name',	13,	1,	'Hexagons 15',	'SHAPE_HEX',	'cv::ENGLAND_HEX_15',	'',	'COVID', '0');


SELECT * FROM "SAP_FPA_SPATIAL_CUSTOM_REGIONS"."sap.fpa.services.spatial::custom_hierarchy.CHOROPLETH_CUSTOM_HIERARCHY";
You can check the metadata looks as expected.

Figure 3.1: Preview SAC Custom Spatial Regions
4. Visualise with SAP Analytics Cloud
Within SAC you can create a Geo Map with a Choropleth / Drill Layer and you should see the newly exposed view as a hierarchy.

Figure 4.1: Create Choropleth / Drill Layer

Figure 4.2: Hexagon Spatial Clustering in SAP Analytics Cloud
5. Other Possibilities, Voronoi Regions
Using exactly the same techniques you can access other spatial techniques such as Voronoi regions, as suggested by a colleague
jamesgiffin Voronoi regions/cells sound more like a beer or wine to me, makes for an interesting visual.
VIEW "view::LAD_VORONOI" AS

SELECT "objectid" AS ID, "lad19nm" AS NAME, ST_VoronoiCell(ST_POINT, -1.0) OVER () AS VORONOI_SHAPE FROM "LAD2019_ST"

Figure 5: Voronoi Cells / Regions
Conclusion
Using the flexibility provided by the SAC Choropleth / Drill Layer you can now visualise many type of polygons from SAP HANA. This includes stored geometries, as well as those that computed with techniques such as spatial clustering and Voronoi regions.
