- SAP Community
- Groups
- Interest Groups
- SAP Builders
- Discussions
- Re: April (Citizen) Developer Challenge – SAP Buil...
- Subscribe to RSS Feed
- Mark Topic as New
- Mark Topic as Read
- Float this Topic for Current User
- Bookmark
- Subscribe
- Mute
- Printer Friendly Page
April (Citizen) Developer Challenge – SAP Build Apps: Task 2 - Formulas
- Mark as New
- Bookmark
- Subscribe
- Mute
- Subscribe to RSS Feed
- Permalink
- Report Inappropriate Content
3 weeks ago - last edited a week ago
Now the challenge gets real 😯
I’ve heard that many developers – citizen and otherwise -- pretty much understand the idea of formulas, and can modify existing formulas and create basic formulas. But even those around SAP Build Apps for a while still struggle to come up with complex formulas from scratch. This challenge will take you to the next level.
The challenges so far:
- Task 0: Set Up SAP Build Apps
- Task 1: OData
- Task 2: Formulas (this post)
- Task 3: Theming, Styling and Layout Design
- Task 4: Mobile device capabilities
The Real Purpose of Formulas
Essentially, formulas are a way to transform data – to convert data to a different data type, to aggregate, to reduce, to format.
So given that, we need to first understand the different “types” of data.
Type of Data
Before beginning, it helps to know the basics of the JSON format, a text-based data interchange format. There are plenty of sites for learning JSON, such as this one: https://developer.mozilla.org/en-US/docs/Learn/JavaScript/Objects/JSON
Despite it looking complicated, essentially, all the data you deal with will be one of the following:
- Primitive: String, number, Boolean, null
"My string"
100
True
null
- Object: A single collection of fields, each of which is a primitive, list or another object
{a: “My String”, b: 100, c: True}
{a: 100, b: {c: “subobject”} }
{a: 100, b: [1, "Two", { x: 3 } ]}
- Lists: A set of primitives, objects or (sub)-lists
[1, 2, 3, 4, 5, 6]

[
   {salesOrderID: 1234, NetAmount: 100.33},
   {salesOrderID: 9999, NetAmount: 3240.99}
]

[1, [2, 3], 4, "five", 6, {"next": 7} ]
These 3 “types” can be combined in all sorts of ways to get interesting data, but essentially that’s all there is.
Tools for Transforming Data
The formula editor is the tool you use to build formulas. Inside here, you have many functions to transform data from one type to another.
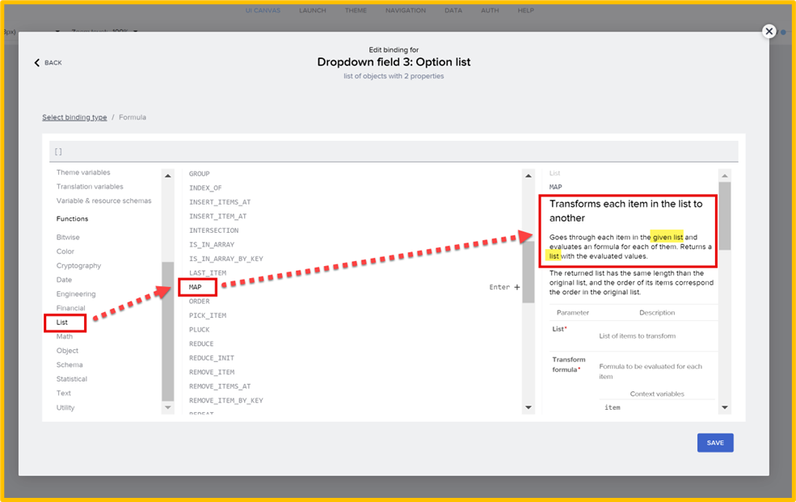
For example, you search for functions that work on lists – these functions will take lists and transform them in some way. Take the MAP function. The documentation inside the formula editor is very good – it will provide a very good explanation of what the function does, with examples that you can actually modify and see how the function works.
The description tells you what type of data you start with and what type you end up with. Here, for MAP, it says it takes a list, and returns a list, but the contents of the list are transformed.
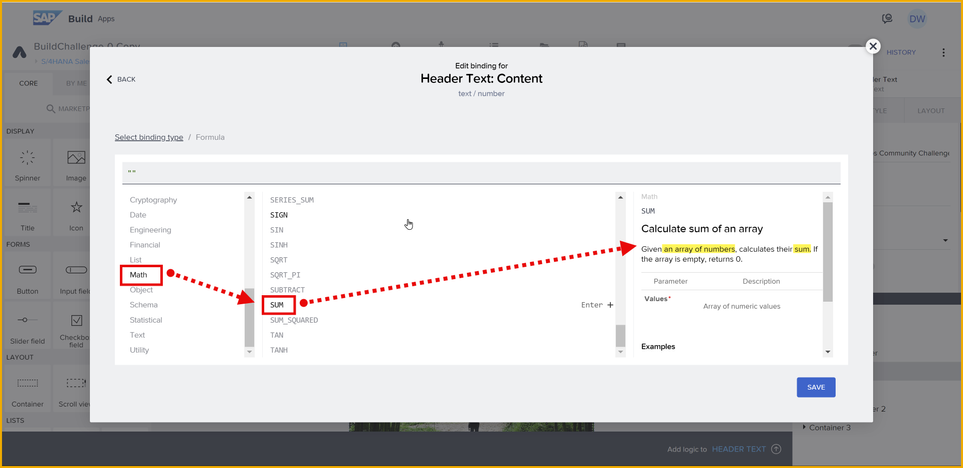
Or take SUM, which takes a list of numbers and returns a number..
Any function can be thought of this way: What type of data does it take, and what type of data does it return.
Strategy for Formulas (Example)
When you need to transform data, you should know what you are starting with and what you want to end up with, then figure out the intermediary steps for the transformation. Finally you have to find the functions that can do the type of transformations you need.
For example, let’s say you want to configure a dropdown list so the user can select a number that is in the range of 1 to some number, and that number is stored in a page variable.
pageVars.options
But the dropdown control needs a list of objects in this format:
[
{label: "1", value: "1"},
{label: "2", value: "2"},
{label: "3", value: "3"}
]
So, you need to come up with a strategy for transforming the primitive into a list of objects. Here’s one way to do this, step by step.
- Since you need a list, you can use the GENERATE_RANGE function to transform the single number (primitive) to a list of numbers:
GENERATE_RANGE(1, pageVars.options)
This gets you this result.
[1,2,3,4,5]
- But instead of a list of primitives, you need a list of objects. So you can use the MAP function to transform the items in the list -- because you know the MAP function transforms from one type of list to another type of list.
MAP(GENERATE_RANGE(1, pageVars.options),{label: item, value: item })
MAP iterates over your original list, and provides you the variable item that holds the current item in the list.
This gets you this result.
[
   {label: 1, value: 1},
   {label: 2, value: 2}
]
- But the label and value fields must be provided as strings, so you will do another transformation, changing one type of primitive to another type of primitive. Here, you can use the STRING function to transform a number to a string.
MAP(GENERATE_RANGE(1, pageVars.options),{label: STRING(item), value: STRING(item)})
This gets you this result, which is what you need for your dropdown list.
[
   {label: "1", value: "1"},
   {label: "2", value: "2"},
   {label: "3", value: "3"},
   {label: "4", value: "4"},
   {label: "5", value: "5"}
]
Your Task
Part I
Using the app you worked on from Task 1, change the pagination so it returns 20 items per page.
Then add a button with the text Sum of Top 20.
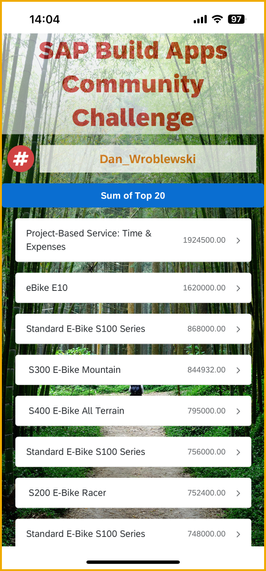
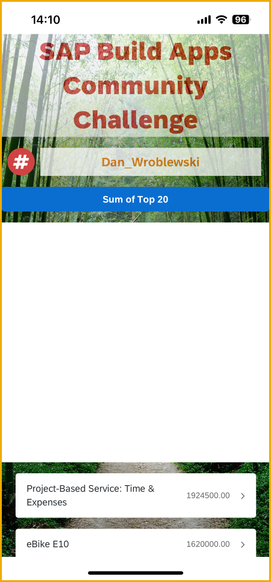
When the user taps the button, set the stringToHash app variable using a formula to the sum of the 20 items in your data variable, and format the sum with a dollar sign, commas, and 2 decimal places, no spaces (there is a function that does this for you). Your number should look something like this (your amount will differ):
$123,456.99
Go to the Submit page, hash the string.
NOTE: If you need help with the formula, just take it one step at a time, and see the formula editor for all the formulas you can use. If needed, post in this thread for assistance.
Part II
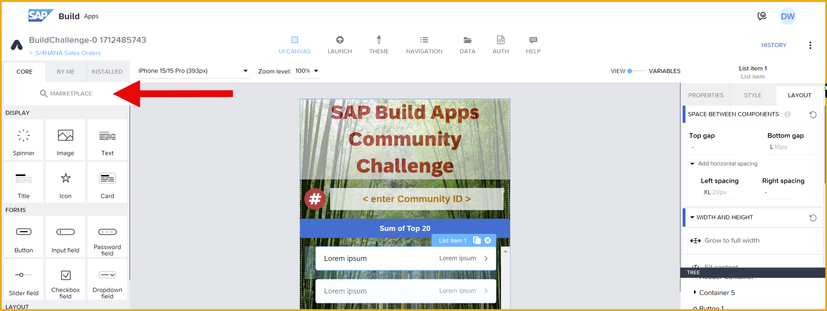
You will use another formula, but this time to chart the data. Go to the Marketplace by clicking on Marketplace at the top of the UI components. Take some time to explore all the cool components (and flow functions) available.
Find the pie chart component and install it.
Just below the button, add a container, make it white, and then add a pie chart to the container. At this point it should look like this, since you have no data:
Now you will set the data for the pie chart with a formula. Go to the Chart data property of the pie chart and create a formula to display the top 6 sales order items. Use:
- Material for the display text
- NetAmount for the data value
It should look something like this (your data will be different):
👉When you are done, take a screenshot, reply to this thread, and post the hash from Part I, and the screenshot Part II. Feel free to share your formulas.
- SAP Managed Tags:
- SAP Build Apps,
- SAP Build,
- SAP Business Technology Platform
- Mark as New
- Bookmark
- Subscribe
- Mute
- Subscribe to RSS Feed
- Permalink
- Report Inappropriate Content
2 weeks ago
0e47e836235e253b0f76a3733ccaeebaad0b88867654f85d64888262a514e124
- SAP Managed Tags:
- SAP Build Apps,
- SAP Build,
- SAP Business Technology Platform
- Mark as New
- Bookmark
- Subscribe
- Mute
- Subscribe to RSS Feed
- Permalink
- Report Inappropriate Content
2 weeks ago
a48ab2bf7fd2ce5bf32dfaac41eac814506a8810fc2fc114faa533773765ae9f
- SAP Managed Tags:
- SAP Build Apps,
- SAP Build,
- SAP Business Technology Platform
- Mark as New
- Bookmark
- Subscribe
- Mute
- Subscribe to RSS Feed
- Permalink
- Report Inappropriate Content
2 weeks ago
- Mark as New
- Bookmark
- Subscribe
- Mute
- Subscribe to RSS Feed
- Permalink
- Report Inappropriate Content
2 weeks ago
Hash 8fc7c7f7014e037660ba59a598c679640472c6a5666a1d42020e6da66d782eba
- SAP Managed Tags:
- SAP Build Apps,
- SAP Build,
- SAP Business Technology Platform
- Mark as New
- Bookmark
- Subscribe
- Mute
- Subscribe to RSS Feed
- Permalink
- Report Inappropriate Content
2 weeks ago
Hi,
Hash: d95979acf39ac0d7e4213d2ba10fce856865645f1d184e39405d482984a1b75b
- SAP Managed Tags:
- SAP Build Apps,
- SAP Build,
- SAP Business Technology Platform
- Mark as New
- Bookmark
- Subscribe
- Mute
- Subscribe to RSS Feed
- Permalink
- Report Inappropriate Content
2 weeks ago
Part I - 9242eb48a4cbd978f402fb015da41f3f1e4c7cd14e73f755ddce12b89f0e26f1
Part II
Formula for stringtoHash: "$"+FORMAT_LOCALIZED_DECIMAL(SUM_BY_KEY(MAP(data.A_SalesOrderItem1,{"NetAmount": NUMBER(item.NetAmount)}), "NetAmount"),"en",2)
Formula for Chart :
MAP(SELECT(data.A_SalesOrderItem1,index<6),{ x:item.Material, y: NUMBER(item.NetAmount)})
- SAP Managed Tags:
- SAP Build Apps,
- SAP Build,
- SAP Business Technology Platform
- Mark as New
- Bookmark
- Subscribe
- Mute
- Subscribe to RSS Feed
- Permalink
- Report Inappropriate Content
2 weeks ago
- Mark as New
- Bookmark
- Subscribe
- Mute
- Subscribe to RSS Feed
- Permalink
- Report Inappropriate Content
2 weeks ago
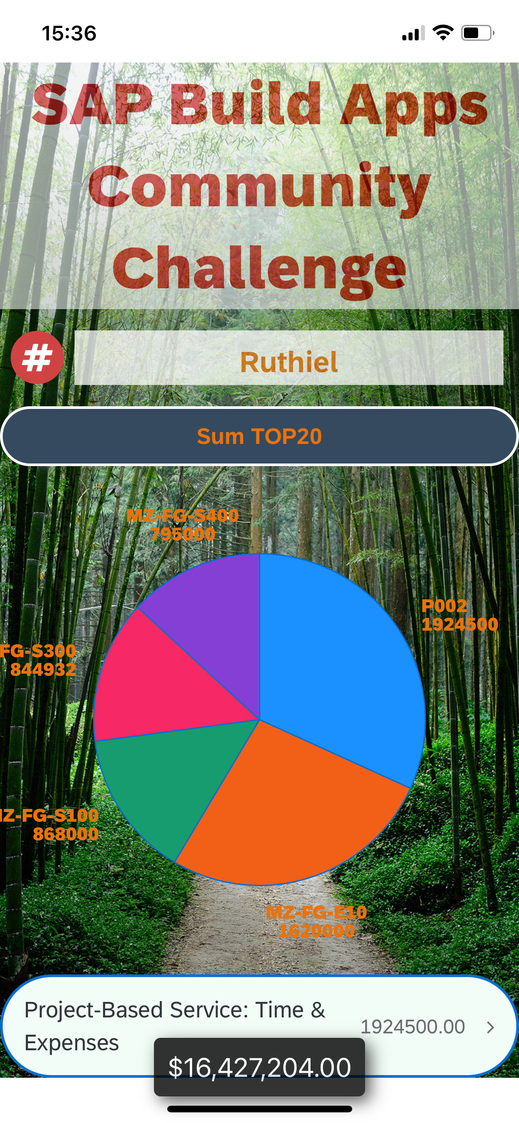
sum- $16,427,204.00
hash- 1127937de75ccac1087a5b75f6eca404fa6fdb32c67feb538c019c08c27124c6
- SAP Managed Tags:
- SAP Build Apps,
- SAP Build,
- SAP Business Technology Platform
- Mark as New
- Bookmark
- Subscribe
- Mute
- Subscribe to RSS Feed
- Permalink
- Report Inappropriate Content
2 weeks ago
d4271e305d7ab9588b1df8fd90ad8f097290e193b9de6fb62aaa74ef42aacd6c
- SAP Managed Tags:
- SAP Build Apps,
- SAP Build,
- SAP Business Technology Platform
- Mark as New
- Bookmark
- Subscribe
- Mute
- Subscribe to RSS Feed
- Permalink
- Report Inappropriate Content
a week ago
34a525c16bba7b8ed347d7d59367a3ecbcd1ad4798341f9cccc1228a7d2d4c7a
- SAP Managed Tags:
- SAP Build Apps,
- SAP Build,
- SAP Business Technology Platform
- Mark as New
- Bookmark
- Subscribe
- Mute
- Subscribe to RSS Feed
- Permalink
- Report Inappropriate Content
a week ago
- Mark as New
- Bookmark
- Subscribe
- Mute
- Subscribe to RSS Feed
- Permalink
- Report Inappropriate Content
a week ago - last edited a week ago
Hello @Dan_Wroblewski ,
Here is my submission for task 3.
Hash: 3b754b9ae389897e95192836a9db1953c4770a05c0936f59f2becd4f41e661e5
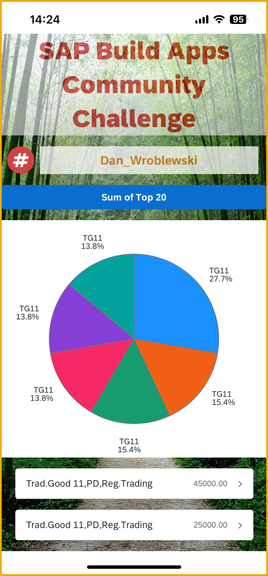
Pie Chart:
- SAP Managed Tags:
- SAP Build Apps,
- SAP Build,
- SAP Business Technology Platform
- Mark as New
- Bookmark
- Subscribe
- Mute
- Subscribe to RSS Feed
- Permalink
- Report Inappropriate Content
a week ago
12ccc5f06ecce7760f8e29e1fffe874a6e0b4d00ebdfa593eb9aa76a43abbcb1
tricky one!
- SAP Managed Tags:
- SAP Build Apps,
- SAP Build,
- SAP Business Technology Platform
- Mark as New
- Bookmark
- Subscribe
- Mute
- Subscribe to RSS Feed
- Permalink
- Report Inappropriate Content
a week ago
2b7797c4dd515ee1b0b60d9bd16dd2ad95d79e5b994edc7227820ad9a88d4f5c
- SAP Managed Tags:
- SAP Build Apps,
- SAP Build,
- SAP Business Technology Platform
- Mark as New
- Bookmark
- Subscribe
- Mute
- Subscribe to RSS Feed
- Permalink
- Report Inappropriate Content
a week ago
Unfortunately, this hash is wrong. You have done all the other challenges so far.
Please note that you must sum the first 20 sales order items, and hat it must be in this format (your number will be different). If you use the formatting function, use "en" as the format region.
$123,456.99
- SAP Managed Tags:
- SAP Build Apps,
- SAP Build,
- SAP Business Technology Platform
- Mark as New
- Bookmark
- Subscribe
- Mute
- Subscribe to RSS Feed
- Permalink
- Report Inappropriate Content
a week ago
Task 2 -
Hash - bbf8282abf54344d0e3f86baa777e87fcd19cf9fd84ca15a1a9e6f91db685671
Data labels are getting collided, can we do anything for this?
- SAP Managed Tags:
- SAP Build Apps,
- SAP Build,
- SAP Business Technology Platform
- Mark as New
- Bookmark
- Subscribe
- Mute
- Subscribe to RSS Feed
- Permalink
- Report Inappropriate Content
a week ago
- Mark as New
- Bookmark
- Subscribe
- Mute
- Subscribe to RSS Feed
- Permalink
- Report Inappropriate Content
a week ago
Task -2 :
Hash - ce47e0b2f684b194e72465df82580ccfe0e95518096dea1ba0080a49810fa216
- SAP Managed Tags:
- SAP Build Apps,
- SAP Build,
- SAP Business Technology Platform
- Mark as New
- Bookmark
- Subscribe
- Mute
- Subscribe to RSS Feed
- Permalink
- Report Inappropriate Content
Thursday
4f4c08bf63bf09966e4806fac863e867a13fdb7c881c3f3367b6ba54581a14c2
- SAP Managed Tags:
- SAP Build Apps,
- SAP Build,
- SAP Business Technology Platform
- Mark as New
- Bookmark
- Subscribe
- Mute
- Subscribe to RSS Feed
- Permalink
- Report Inappropriate Content
Thursday
155f1e2a9ee6c9c3b0037515bade4ee3d17ea346e42eb6312f92fd86813646ec
- SAP Managed Tags:
- SAP Build Apps,
- SAP Build,
- SAP Business Technology Platform
- Mark as New
- Bookmark
- Subscribe
- Mute
- Subscribe to RSS Feed
- Permalink
- Report Inappropriate Content
Friday
Here's my hash from Part I: ac3f252d200ec9a3ddd5602d8ae809791861e7477cdf97bb227296ea09dc09f7
and screenshot from Part II
Formulas used:
Part I: "$" + FORMAT_LOCALIZED_DECIMAL(SUM_BY_KEY(MAP(data.A_SalesOrderItem1,{ "NetAmount": NUMBER(item.NetAmount) }), "NetAmount"), "en-IN", 2,2)
Part II: MAP(SELECT(data.A_SalesOrderItem1, index < 6),{ x: item.Material, y: NUMBER(item.NetAmount) })
- SAP Managed Tags:
- SAP Build Apps,
- SAP Build,
- SAP Business Technology Platform
- Mark as New
- Bookmark
- Subscribe
- Mute
- Subscribe to RSS Feed
- Permalink
- Report Inappropriate Content
Friday
- Mark as New
- Bookmark
- Subscribe
- Mute
- Subscribe to RSS Feed
- Permalink
- Report Inappropriate Content
Saturday
Thanks for the hint @Dan_Wroblewski . Here's my revised hash: 9adef9e2f08c4301429f681e61e5c127c58068cb0d5a82623046b8f0c9727b54
- SAP Managed Tags:
- SAP Build Apps,
- SAP Build,
- SAP Business Technology Platform
- Mark as New
- Bookmark
- Subscribe
- Mute
- Subscribe to RSS Feed
- Permalink
- Report Inappropriate Content
Tuesday
______________________________________________________
Part 1
Hash - 22452d6e0d82c54e1cd11142ee0475ee2421ee869d580fc0042810a38040d859
______________________________________________________
Part 2
Screenshot -
________________________________________________
- BY RAHUL1221
- SAP Managed Tags:
- SAP Build Apps,
- SAP Build,
- SAP Business Technology Platform


