- SAP Community
- Products and Technology
- Technology
- Technology Q&A
- Variance between dimension values in a column char...
- Subscribe to RSS Feed
- Mark Question as New
- Mark Question as Read
- Bookmark
- Subscribe
- Printer Friendly Page
- Report Inappropriate Content
Variance between dimension values in a column chart
- Subscribe to RSS Feed
- Mark Question as New
- Mark Question as Read
- Bookmark
- Subscribe
- Printer Friendly Page
- Report Inappropriate Content
on 11-25-2022 12:54 PM
Hello,
I need a help.
My setup:
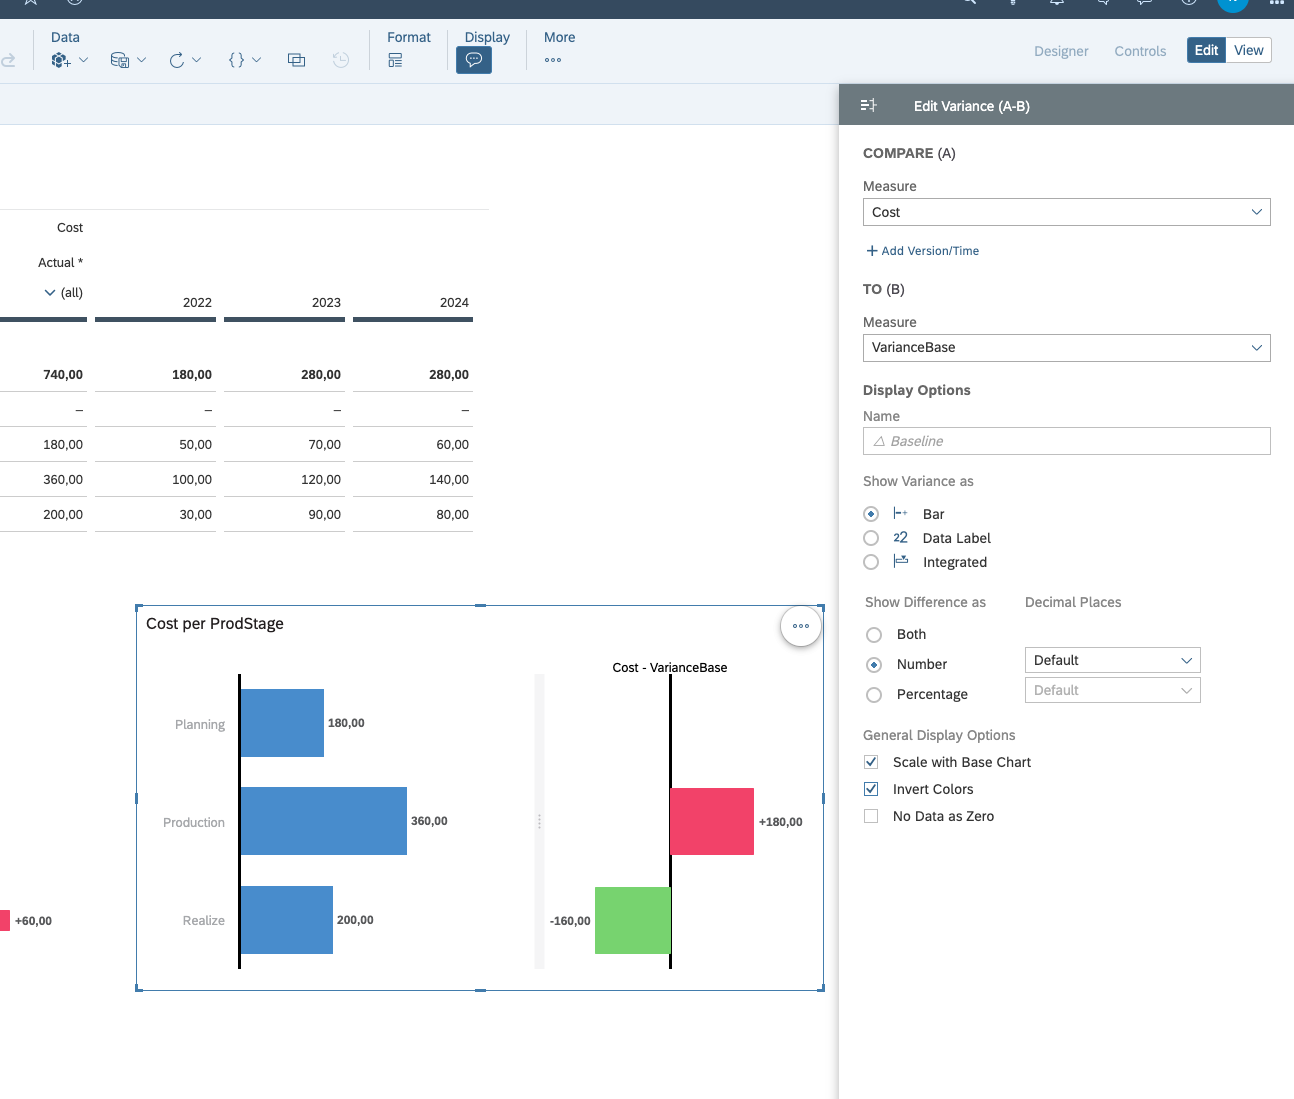
There is a dimension "Production Stage" with three values: "Planning", "Production", "Realise". There is a measure "Cost".
Task is to build a column or waterfall chart that shows costs over production stages and variances between the stages (the screenshot below).

How can I get such setting in SAC?
Any help and tip is welcome.
Thank you and best regards,
Aizhan
- SAP Managed Tags:
- SAP Analytics Cloud
- Mark as New
- Bookmark
- Subscribe
- Subscribe to RSS Feed
- Report Inappropriate Content
Hi Aizhan,
Understood, I'd first create a simple calculation to compare against "VarianceBase"
IF([d/"planPhase":ProdStage]="Production" ;ResultLookup(["planPhase":Cost] ;[d/"planPhase":ProdStage]="Planning" ) ;IF([d/"planPhase":ProdStage]="Realize" ;ResultLookup(["planPhase":Cost] ; [d/"planPhase":ProdStage]="Production" ) ;null ))
From there I can create the Variance like before:
You must be a registered user to add a comment. If you've already registered, sign in. Otherwise, register and sign in.
- How to craft a data strategy? in Technology Blogs by Members
- Unlocking the Potential of Signavio Collaboration Hub – Variant Management in Technology Blogs by SAP
- Dynamic Extensions of the Planning Area Defined by the Table Context QRC2 2024 in Technology Blogs by SAP
- Feature Request: Show which processes are using a certain variant dimension within the dictionary in Technology Q&A
- Currency Conversion: Different Booking Date for different Account Elements in Technology Q&A
| User | Count |
|---|---|
| 77 | |
| 9 | |
| 8 | |
| 7 | |
| 6 | |
| 6 | |
| 5 | |
| 5 | |
| 5 | |
| 5 |
You must be a registered user to add a comment. If you've already registered, sign in. Otherwise, register and sign in.